. 2013 Aug 19;202(4):699-713.
doi: 10.1083/jcb.201301016. Epub 2013 Aug 12.

hGAAP promotes cell adhesion and migration via the stimulation of store-operated Ca2+ entry and calpain 2

Affiliations

hGAAP promotes cell adhesion and migration via the stimulation of store-operated Ca2+ entry and calpain 2

Nuno Saraiva et al. J Cell Biol. .

Abstract

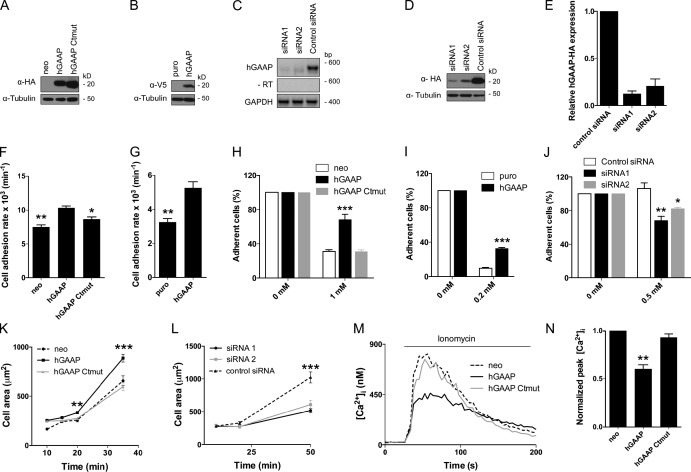
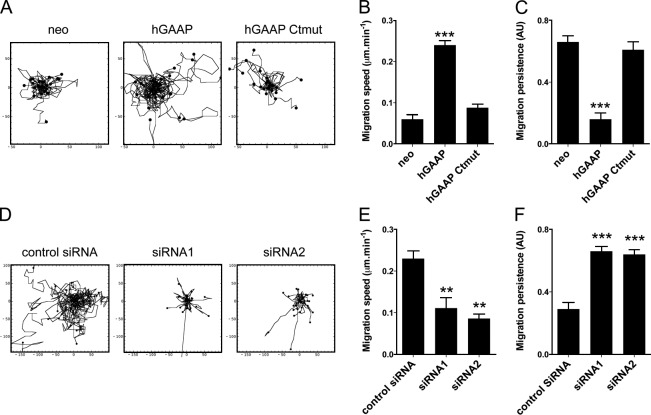
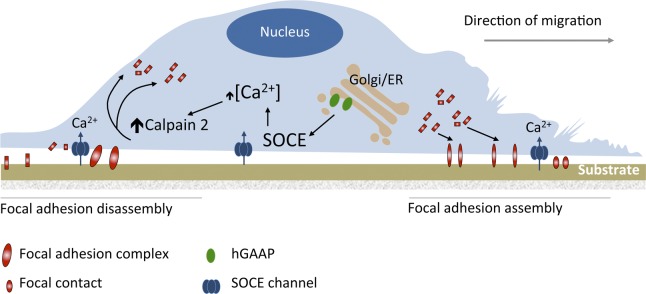
Golgi antiapoptotic proteins (GAAPs) are highly conserved Golgi membrane proteins that inhibit apoptosis and promote Ca(2+) release from intracellular stores. Given the role of Ca(2+) in controlling cell adhesion and motility, we hypothesized that human GAAP (hGAAP) might influence these events. In this paper, we present evidence that hGAAP increased cell adhesion, spreading, and migration in a manner that depended on the C-terminal domain of hGAAP. We show that hGAAP increased store-operated Ca(2+) entry and thereby the activity of calpain at newly forming protrusions. These hGAAP-dependent effects regulated focal adhesion dynamics and cell migration. Indeed, inhibition or knockdown of calpain 2 abrogated the effects of hGAAP on cell spreading and migration. Our data reveal that hGAAP is a novel regulator of focal adhesion dynamics, cell adhesion, and migration by controlling localized Ca(2+)-dependent activation of calpain.


Figures

Figure 1.
Figure 1.
Overexpression or knockdown of hGAAP affects cell adhesion, cell detachment, and cell spreading. (A and B) Immunoblot (IB) of U2-OS cells with anti-HA Ab (A) or HeLa cells with anti-V5 Ab (B) shows expression of tagged hGAAP and hGAAP Ctmut in stable cell lines but not in cells expressing control plasmids (neo and puro). (C) Levels of endogenous hGAAP mRNA were determined by RT-PCR in U2-OS cells transfected with siRNAs for hGAAP (siRNA 1 and 2) or control siRNA. An analysis without reverse transcription (−RT) was included to control for DNA contamination. (D) U2-OS cells overexpressing hGAAP-HA were transfected with the indicated siRNAs, and hGAAP-HA expression was measured using IB with an anti-HA Ab. (E) Summary results (means ± SEM, from three independent experiments) show relative expression of hGAAP protein quantified from IB as in D. (F and G) Adherence of U2-OS (F) or HeLa cells (G) expressing the indicated hGAAPs was determined after washing cells with PBS at intervals after seeding. Results are means ± SEM, from three independent experiments. *, P < 0.05; **, P < 0.01 (Student’s t test, relative to cells overexpressing hGAAP). (H–J) Adherent cells were quantified 20 min after addition of the indicated concentrations of EDTA to U2-OS (H), HeLa cells (I) overexpressing hGAAPs, or U2-OS cells treated with siRNAs (J). Results (H–J) are representative of three experiments and show means ± SEM. (K and L) U2-OS cells overexpressing hGAAPs (K) or after treatment with siRNAs (L) were seeded onto fibronectin-coated slides. Cell areas were measured after fixing cells at intervals after seeding. Results show means ± SEM for ≥35 cells and are typical of three experiments. (H–L) *, P < 0.05; **, P < 0.01; ***, P < 0.001 (Student’s t test, compared with control). (M) Traces show [Ca2+]i after addition of the Ca2+ ionophore, ionomycin (1 µM), in Ca2+-free HBS to populations of fura-2–loaded U2-OS cells expressing the indicated hGAAPs. (N) Summary results (means ± SEM from three independent experiments) show peak increases in [Ca2+]i expressed as fractions of those in matched neo cells. **, P < 0.01 by one-sample Student’s t test.
Figure 2.
Figure 2.
hGAAP expression alters the number and size of focal adhesions. U2-OS cells transfected with siRNA (24 h) or plasmids encoding hGAAP were seeded onto fibronectin-coated slides. (A) Confocal images show cells transfected with vinculin-GFP (14 h), fixed, and stained with phalloidin–Alexa Fluor 568. (B) Summary results (means ± SEM from ≥25 cells for each condition) show numbers of focal adhesions per cell, determined by counting vinculin-GFP spots. (C) IRM images of U2-OS cells overexpressing hGAAP or hGAAP Ctmut, or transfected with the indicated siRNAs. Images are typical of three independent experiments. (D) Example of the image analysis used to determine focal adhesion number and size. Individual cells were imaged for IRM (a) and phalloidin staining (b). IRM images were then band pass filtered (c), and a threshold was imposed (d) to obtain the final images used to determine the number and size of the adhesions. (E and F) Summary results (means ± SEM from ≥20 cells for each condition) show numbers of adhesions per cell (E) and their areas (F). *, P < 0.05; **, P < 0.01; ***, P < 0.001 (Student’s t test). Bars, 10 µm.
Figure 3.
Figure 3.
hGAAP expression alters focal adhesion dynamics. (A and E) U2-OS cells overexpressing hGAAP (A) or transfected with siRNAs (E) were transfected with vinculin-GFP and seeded onto fibronectin-coated dishes. After 30 min, individual cells were imaged at 2-min intervals for 2 h. Representative frames are shown, with arrows highlighting a single typical adhesion for each cell line. Bars, 10 µm. (B–D and F–H) Summary results (means ± SEM, n = 6 cells, with 4–10 focal adhesions analyzed in each) show mean lifetimes of focal adhesions (B and F) and rate constants for their disassembly (C and G) and assembly (D and H). **, P < 0.01; ***, P < 0.001 (Student’s t test). FA, focal adhesion.
Figure 4.
Figure 4.
Overexpression of hGAAP increases the speed of cell migration. (A–F) U2-OS cells overexpressing hGAAP, hGAAP Ctmut, or control neo (A–C) or cells transfected with siRNA (D–F) were seeded at low density on fibronectin-coated dishes. Individual cells were imaged at 5-min intervals for 18 h. Tracks of individual cells (n = 30) are shown in A and D. Migration rates (B and E) and persistence (where 1 represents a straight line of migration from start to finish; C and F) are shown as means ± SEM from 30 cells. **, P < 0.01; ***, P < 0.001 (Student’s t test, relative to neo or control siRNA cells). AU, arbitrary unit.
Figure 5.
Figure 5.
hGAAP stimulates calpain activity. (A) U2-OS cells were transfected with the CFP/YFP calpain FRET biosensor, plated on fibronectin, and imaged live over 20 min in both FRET and IRM channels. Typical examples show stills from videos. Right images show enlargements of boxed areas in left images. Bars, 5 µm. (B) Summary results from the images collected at t = 0 (means ± SEM, for >10 cells) show the percentages of low-FRET pixels (ratio < 1.5, i.e., high calpain activity) within 5 µm of the plasma membrane. (C) Typical IB showing total FAK, calpain 2–dependent cleaved FAK (asterisk, FAK(clv)), and the loading control (α-GAPDH) for U2-OS cells transfected as shown, reseeded on fibronectin for 30 min, and assayed with or without treatment with ALLM. (D) Summary results (means ± SEM, n = 3). (E) IB, typical of three independent experiments, showing total endogenous calpain 2. *, P < 0.05; **, P < 0.01; ***, P < 0.001 (Student’s t test, relative to neo or hGAAP cells).
Figure 6.
Figure 6.
Inhibition of calpain reduces the effects of hGAAP on cell migration and spreading. (A and B) Cells treated with PD150606 (A) or ALLM (B) were seeded on fibronectin-coated slides and left to adhere and spread for different times. Cells were fixed, and cell size was measured for >50 cells per condition. (C–F) Cells treated with PD150606 (C and D) or ALLM (E and F) were seeded at low density in fibronectin-coated dishes, and cells were imaged every 5 min for 18 h. Individual cell tracks are shown in C and E (n = 25 cells), and cumulative migration speeds from multiple migration tracks are shown in D and F. (G–J) Cells expressing hGAAP, hGAAP Ctmut, or control neo were treated with calpain 2–specific siRNAs. (G) IB showing effectiveness of calpain 2 knockdown in cells expressing hGAAP, hGAAP Ctmut, or control neo, and treated with calpain 2–specific siRNAs. (H) Areas of cells (measured 60 h after calpain 2 (Capn2) siRNA transfection, >50 cells per condition) seeded on fibronectin-coated slides. (I and J) Cells treated with calpain 2 siRNA were seeded at low density in fibronectin-coated dishes, and individual cells were imaged every 5 min for 18 h. Individual cell tracks are shown (n = 25 cells; I), and cumulative migration speeds are shown (J). Data are representative of three experiments and are shown as mean ± SEM. *, P < 0.5; **, P < 0.01; ***, P < 0.001 (Student’s t test, in comparison to neo cells).
Figure 7.
Figure 7.
hGAAP increases calpain activity by enhancing SOCE. Changes in [Ca2+]i or rates of Mn2+ entry were measured in fura-2–loaded U2-OS cells expressing the indicated hGAAPs or neo control or treated with siRNA. (A) Typical traces show changes in [Ca2+]i after restoration of extracellular Ca2+ (2 mM) to populations of cells bathed in nominally Ca2+-free HBS. (B) Summary results (means ± SEM, n = 3) show the peak increases in [Ca2+]i. (C) Addition of 1 mM Mn2+ to populations of cells in normal HBS quenches cytosolic fura-2 fluorescence as Mn2+ enters cells via channels in the plasma membrane. Typical traces show fluorescence normalized to the initial fluorescence intensity. (D) Summary results (means ± SEM, n = 3) show rates of fluorescence quenching, in arbitrary fluorescence units per second (AFU/s), determined from the gradients of lines fitted by linear regression to intervals of 100–200 s after Mn2+ addition. (E) Effects of 50 µM 2-APB or 1 µM Gd3+ on [Ca2+]i in cells overexpressing hGAAP after restoration of extracellular Ca2+ (2 mM) to populations of cells bathed in nominally Ca2+-free HBS. (F) Summary results (means ± SEM, n = 3) show the normalized peak Ca2+ signals. (G) Effects of 50 µM 2-APB or 1 µM Gd3+ on the quenching of fura-2 fluorescence after addition of 1 mM Mn2+ to populations of cells overexpressing hGAAP. (H) Summary results (means ± SEM, n = 3) show normalized rates of Mn2+-evoked fluorescence quenching. (I) Typical traces show changes in [Ca2+]i after addition of 1 µM thapsigargin (Tg) in nominally Ca2+-free HBS to populations of cells overexpressing hGAAP followed by restoration of extracellular Ca2+ (2 mM). The initial thapsigargin-evoked increases in [Ca2+]i were smaller in cells overexpressing hGAAP (139 ± 4 nM, n = 5) than in neo cells (154 ± 4 nM, n = 5; P < 0.05) or cells expressing hGAAP Ctmut (176 ± 8 nM, n = 5). (J) Summary results (means ± SEM, n = 3–4) show normalized peak changes in [Ca2+]i after restoration of extracellular Ca2+ (2 mM) to thapsigargin-treated cells. Effects of 50 µM 2-APB or 1 µM Gd3+ are indicated. Responses are normalized to parallel measurements from cells overexpressing hGAAP. (K) Single-cell analysis shows changes in [Ca2+]i after treatment with 1 µM thapsigargin and restoration of extracellular Ca2+ (2 mM) to U2-OS cells overexpressing hGAAP and transfected with either DN-Orai1 or control pcDNA3.1 plasmid. Transfected cells were identified using cotransfected pmCherry-C1. Typical traces show average responses from 11 transfected cells in each condition. (L) Summary results show inhibition of thapsigargin-evoked SOCE by DN-Orai1 in hGAAP and neo cells, calculated from the differences between parallel measurements of SOCE in cells expressing DN-Orai1 or pcDNA3.1 (means ± SEM, from three independent transfections, with responses from 6–18 transfected cells measured in each). (M) Effect of hGAAP siRNA on rates of Mn2+-evoked quenching of fura-2 fluorescence (means ± SEM, n = 3). (N) U2-OS cells transfected with the calpain FRET biosensor were plated on fibronectin, treated with 2 µM Gd3+ or 50 µM 2-APB, and imaged for 20 min. Typical images, taken from videos, show the IRM and FRET signals recorded 5 min after addition of the inhibitors. Bar, 5 µm. (O) Summary results (means ± SEM, from ≥10 cells) show the percentage of low FRET pixels (<1.5 ratio, i.e., high calpain activity) within 5 µm of the plasma membrane in the image collected at t = 0. *, P < 0.05; **, P < 0.01; ***, P < 0.001 (unpaired Student’s t test).
Figure 8.
Figure 8.
Model of hGAAP-dependent control of cell adhesion and migration. hGAAP both stimulates loss of Ca2+ from the Golgi/ER, thereby activating SOCE, and it promotes activation of SOCE by empty stores. The resulting localized increase in [Ca2+]i near the plasma membrane stimulates calpain 2 activity, leading to increased turnover of focal adhesions. This in turn leads to increased speed of cell spreading and more rapid migration. See text in Results and Discussion for further details.

Similar articles

Cited by

References

    1. Ahn T., Yun C.H., Chae H.Z., Kim H.R., Chae H.J. 2009. Ca2+/H+ antiporter-like activity of human recombinant Bax inhibitor-1 reconstituted into liposomes. FEBS J. 276:2285–2291 10.1111/j.1742-4658.2009.06956.x - DOI - PubMed
    1. Bird G.S., DeHaven W.I., Smyth J.T., Putney J.W., Jr 2008. Methods for studying store-operated calcium entry. Methods. 46:204–212 10.1016/j.ymeth.2008.09.009 - DOI - PMC - PubMed
    1. Brundage R.A., Fogarty K.E., Tuft R.A., Fay F.S. 1991. Calcium gradients underlying polarization and chemotaxis of eosinophils. Science. 254:703–706 10.1126/science.1948048 - DOI - PubMed
    1. Bultynck G., Kiviluoto S., Henke N., Ivanova H., Schneider L., Rybalchenko V., Luyten T., Nuyts K., De Borggraeve W., Bezprozvanny I., et al. 2012. The C terminus of Bax inhibitor-1 forms a Ca2+-permeable channel pore. J. Biol. Chem. 287:2544–2557 10.1074/jbc.M111.275354 - DOI - PMC - PubMed
    1. Carrara G., Saraiva N., Gubser C., Johnson B.F., Smith G.L. 2012. Six-transmembrane topology for Golgi anti-apoptotic protein (GAAP) and Bax inhibitor 1 (BI-1) provides model for the transmembrane Bax inhibitor-containing motif (TMBIM) family. J. Biol. Chem. 287:15896–15905 10.1074/jbc.M111.336149 - DOI - PMC - PubMed

Publication types

LinkOut - more resources