. 2013 Sep 18;105(18):1385-93.
doi: 10.1093/jnci/djt205. Epub 2013 Aug 12.

Investigation of complement activation product c4d as a diagnostic and prognostic biomarker for lung cancer

Affiliations

Investigation of complement activation product c4d as a diagnostic and prognostic biomarker for lung cancer

Daniel Ajona et al. J Natl Cancer Inst. .

Abstract

Background: There is a medical need for diagnostic biomarkers in lung cancer. We evaluated the diagnostic performance of complement activation fragments.

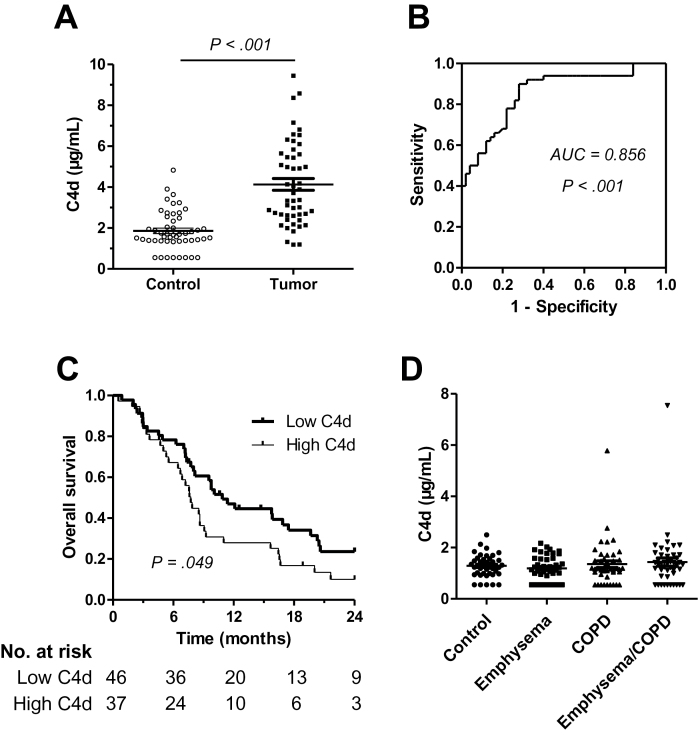
Methods: We assessed complement activation in four bronchial epithelial and seven lung cancer cell lines. C4d, a degradation product of complement activation, was determined in 90 primary lung tumors; bronchoalveolar lavage supernatants from patients with lung cancer (n = 50) and nonmalignant respiratory diseases (n = 22); and plasma samples from advanced (n = 50) and early lung cancer patients (n = 84) subjects with inflammatory lung diseases (n = 133), and asymptomatic individuals enrolled in a lung cancer computed tomography screening program (n = 190). Two-sided P values were calculated by Mann-Whitney U test.

Results: Lung cancer cells activated the classical complement pathway mediated by C1q binding that was inhibited by phosphomonoesters. Survival was decreased in patients with high C4d deposition in tumors (hazard ratio [HR] = 3.06; 95% confidence interval [CI] = 1.18 to 7.91). C4d levels were increased in bronchoalveolar lavage fluid from lung cancer patients compared with patients with nonmalignant respiratory diseases (0.61 ± 0.87 vs 0.16 ± 0.11 µg/mL; P < .001). C4d levels in plasma samples from lung cancer patients at both advanced and early stages were also increased compared with control subjects (4.13 ± 2.02 vs 1.86 ± 0.95 µg/mL, P < 0.001; 3.18 ± 3.20 vs 1.13 ± 0.69 µg/mL, P < .001, respectively). C4d plasma levels were associated with shorter survival in patients at advanced (HR = 1.59; 95% CI = 0.97 to 2.60) and early stages (HR = 5.57; 95% CI = 1.60 to 19.39). Plasma C4d levels were reduced after surgical removal of lung tumors (P < .001) and were associated with increased lung cancer risk in asymptomatic individuals with (n = 32) or without lung cancer (n = 158) (odds ratio = 4.38; 95% CI = 1.61 to 11.93).

Conclusions: Complement fragment C4d may serve as a biomarker for early diagnosis and prognosis of lung cancer.


Figures

Figure 1.
Figure 1.
Complement activation in lung cancer cells. A) Deposition of complement C3-derived fragments after complement activation in bronchial epithelial cells (white bars) and in lung cancer cell lines (black bars). B) C3 deposition and C1q binding in A549 and H157 lung cancer cells after activation of complement using normal human serum (NHS; at different buffer conditions) or depleted sera (factor B [FB]–depleted serum or C1q-depleted serum). C) C3 deposition in A549 and H157 cells after exposure to NHS in the presence of the C1q blocking peptide 2J (1mM). D) Binding of C1q and C4d deposition in bronchial epithelial cell lines (white bars) and in lung cancer cell lines (black bars) after incubation with NHS. In all graphs, data are expressed as the ratio of the mean fluorescence intensity (MFI) between cell incubated with 10% serum and cells incubated with its respective complement inactivated serum. A ratio of 1 means no complement activation (horizontal line). All bar graphs in the figure show mean ± standard deviation (from at least three independent experiments). Statistically significant differences between bronchial and tumor cells were analyzed using the two-sided Mann–Whitney U test.
Figure 2.
Figure 2.
Role of C1q on complement activation in lung cancer cells. A) A549 and H157 cells were preincubated with purified human C1q (15 µg/mL) or phosphate-buffered saline (PBS), washed, treated with C1q-depleted serum, and analyzed for C3 deposition. Cells incubated with normal human serum (NHS) were used as a positive control. Data are shown as mean ± standard deviation of three independent experiments expressed as the ratio of the mean fluorescence intensity (MFI) between serum and its respective complement inactivated serum. A horizontal line crossing the y-axis at 1 indicates the ratio when there is no complement activation. B) A549 and H157 cells were incubated with NHS in the presence of increasing concentrations of phosphoserine, phosphocholine, or phosphoethanolamine and tested for C3 deposition and C1q binding. Complement activity in the absence of phosphomonoesters was set at 100%. Data show a representative result from three independent experiments.
Figure 3.
Figure 3.
Complement activation in primary lung tumors. A) Repre sentative immunostaining for C4d in two lung cancer specimens, an adenocarcinoma (AC) and a squamous cell carcinoma (SCC). Scale bar = 50 μm. B) Kaplan–Meier curve for overall survival. Patients were stratified into two groups according to the median of the C4d H score (≤104 vs >104). The median survival time in the high score group was 6.5 years and was not reached in the low score group. Differences between groups were evaluated using the two-sided log-rank test.
Figure 4.
Figure 4.
Complement component C4d in bronchoalveolar lavage fluid from patients with lung cancer. A) Quantitation of C4d in bronchoalveolar lavage supernatants from patients with lung cancer and patients with nonmalignant respiratory diseases. Mean ± standard deviation is also shown. The P value was calculated using the two-sided Mann–Whitney U test. B) A receiver operating characteristic curve was generated using C4d levels. The area under the curve (AUC) was 0.726 (95% confidence interval = 0.610 to 0.843; P = .002, based on a two-sided z score test).
Figure 5.
Figure 5.
C4d levels in plasma samples from patients with advanced lung cancer (stages III and IV). A) Dot plot quantifying C4d in each plasma sample. Mean ± standard deviation is also shown. The P values were calculated using the two-sided Mann–Whitney U test. B) The area under the curve (AUC) was 0.856 (95% confidence interval = 0.782 to 0.930; P < .001, based on a two-sided z score test). C) Kaplan–Meier curve for overall survival in an independent cohort of lung cancer patients at advanced stages. Based on the median value of the cohort of patients, a cutoff of 3 μg/mL was used to classify patients into high and low C4d plasma levels. The statistical significance of the difference was evaluated using the two-sided log-rank test. The median survival times in the low and high score groups were 10.9 months and 7.3 months, respectively. D) Plasma C4d levels in control subjects and in patients with emphysema, chronic obstructive pulmonary disease (COPD), or both. No statistically significant differences were found among groups (P = .63; two-sided Kruskal–Wallis H test).
Figure 6.
Figure 6.
Plasma C4d levels in lung cancer patients at early stages (I and II). A) The dot plot shows the concentration of C4d in plasma samples from patients with early lung cancer and control subjects. Mean ± standard deviation is also shown. The P values were calculated using the two-sided Mann–Whitney U test. B) The area under the curve (AUC) was 0.782 (95% confidence interval = 0.705 to 0.859; P < .001, based on a two-sided z score test). C) Kaplan–Meier curve for overall survival. Patients were classified into high or low C4d according to the same cutoff used previously for the advanced patients (3 μg/mL). The median survival time was not reached in any of the groups. The statistical significance of the survival difference between groups was evaluated using the two-sided log-rank test. D) C4d levels in plasma paired samples from 25 lung cancer patients obtained before and after surgical removal of the tumors. Postsurgery samples were obtained between 2 and 44 months after surgery (median = 7 months). The P value was calculated using the two-sided Wilcoxon signed-rank test.
Figure 7.
Figure 7.
Plasma C4d levels in asymptomatic lung cancer patients. A) The dot plot shows the concentration of C4d in plasma samples from asymptomatic lung cancer patients and controls enrolled in a computed tomography screening program. Mean ± standard deviation is also shown. The P values were calculated using the two-sided Mann–Whitney U test. B) Receiver operating characteristic curve generated using the C4d levels. The area under the curve (AUC) was 0.735 (95% confidence interval = 0.623 to 0.847; P < .001, based on a two-sided z score test).

References

    1. Siegel R, Naishadham D, Jemal A. Cancer statistics., 2013CA Cancer J Clin. 2013;63(1):11–30 - PubMed
    1. Aberle DR, Adams AM, Berg CD, et al. Reduced lung-cancer mortality with low-dose computed tomographic screening. N Engl J Med. 2011;365(5):395–409 - PMC - PubMed
    1. Hassanein M, Callison JC, Callaway-Lane C, Aldrich MC, Grogan EL, Massion PP. The state of molecular biomarkers for the early detection of lung cancer. Cancer Prev Res (Phila). 2012;5(8):992–1006 - PMC - PubMed
    1. Finn OJ. Immune response as a biomarker for cancer detection and a lot more. N Engl J Med. 2005;353(12):1288–1290 - PubMed
    1. Shepherd FA, Douillard JY, Blumenschein GR., Jr Immunotherapy for non-small cell lung cancer: novel approaches to improve patient outcome. J Thorac Oncol. 2011;6(10):1763–1773 - PubMed

Publication types

MeSH terms