. 2013 Aug 27;110(35):14432-7.
doi: 10.1073/pnas.1308285110. Epub 2013 Aug 12.

Surge of neurophysiological coherence and connectivity in the dying brain

Affiliations

Surge of neurophysiological coherence and connectivity in the dying brain

Jimo Borjigin et al. Proc Natl Acad Sci U S A. .

Abstract

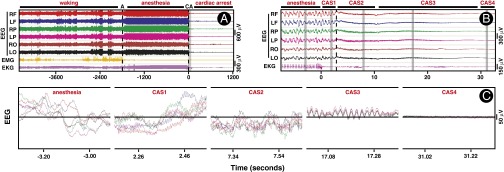
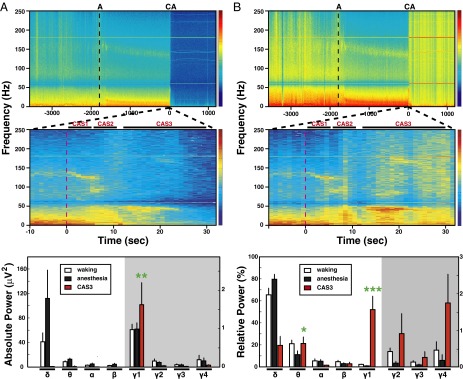
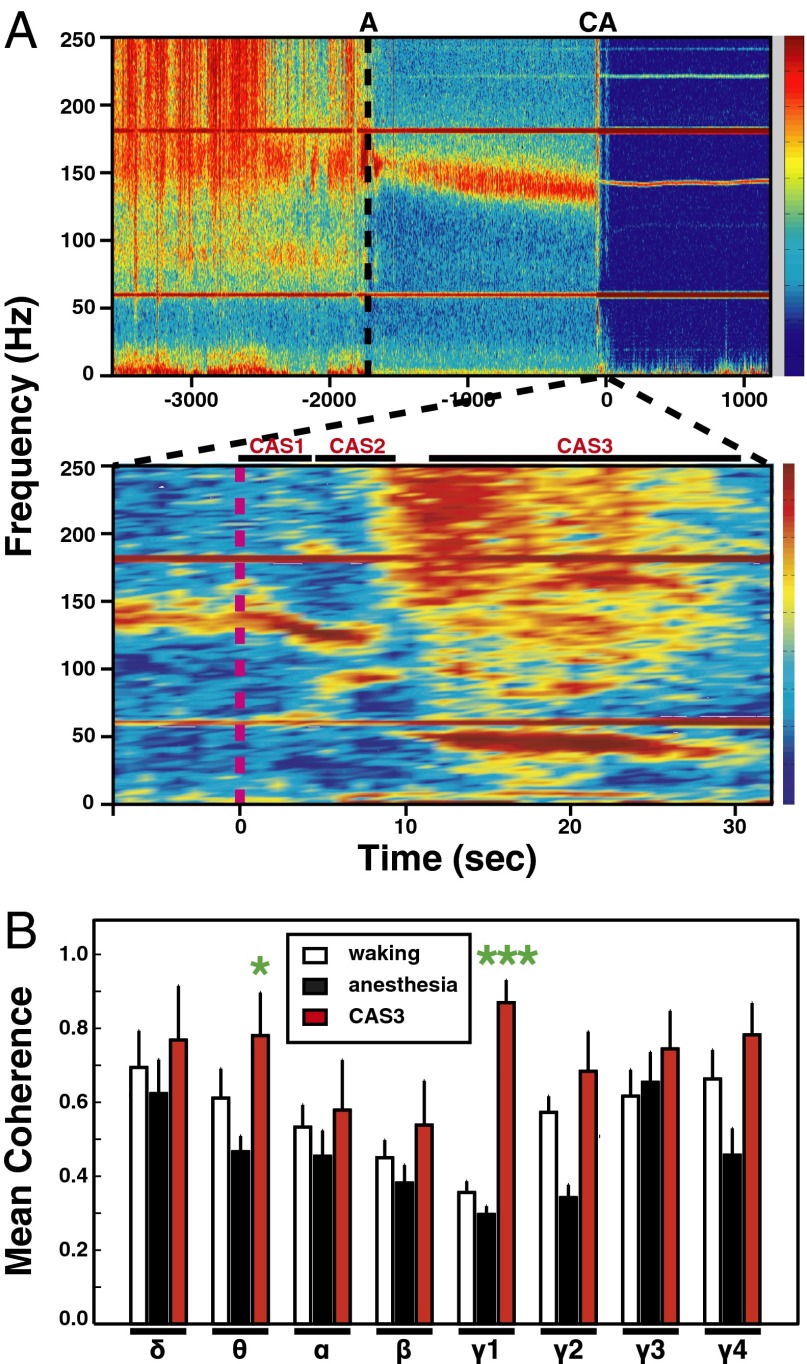
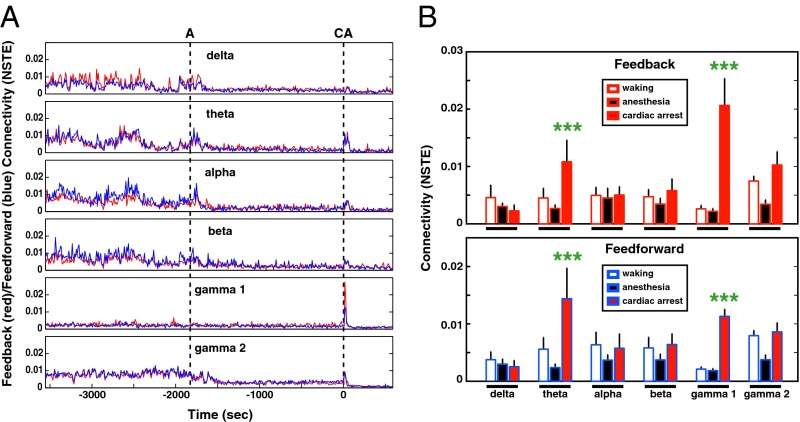
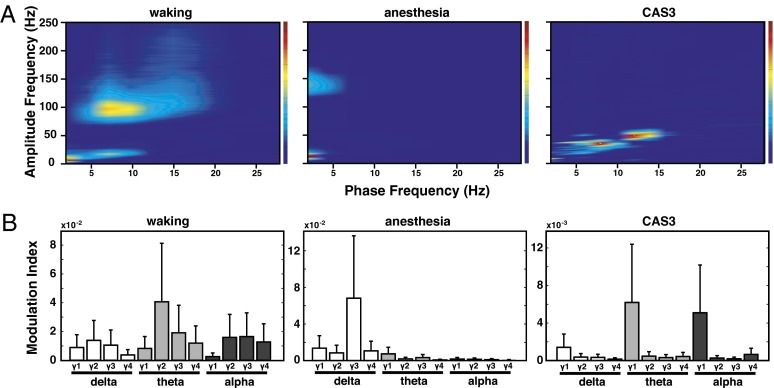
The brain is assumed to be hypoactive during cardiac arrest. However, the neurophysiological state of the brain immediately following cardiac arrest has not been systematically investigated. In this study, we performed continuous electroencephalography in rats undergoing experimental cardiac arrest and analyzed changes in power density, coherence, directed connectivity, and cross-frequency coupling. We identified a transient surge of synchronous gamma oscillations that occurred within the first 30 s after cardiac arrest and preceded isoelectric electroencephalogram. Gamma oscillations during cardiac arrest were global and highly coherent; moreover, this frequency band exhibited a striking increase in anterior-posterior-directed connectivity and tight phase-coupling to both theta and alpha waves. High-frequency neurophysiological activity in the near-death state exceeded levels found during the conscious waking state. These data demonstrate that the mammalian brain can, albeit paradoxically, generate neural correlates of heightened conscious processing at near-death.

Keywords: consciousness; global hypoxia; global ischemia; near-death experience.


Conflict of interest statement

The authors declare no conflict of interest.

Figures

Fig. 1.
Fig. 1.
EEG displays a well-organized series of high-frequency activity following cardiac arrest. (A) EEG, EMG, and EKG during 2,800 s of baseline waking state (−4585 s to −1788 s), 1,788 s of anesthetized state (−1,788 s to 0 s), and 1,216 s following cardiac arrest (0 s to 1,216 s). EEG was recorded from six regions of the rat brain: the right frontal (RF) and left frontal (LR), right parietal (RP) and left parietal (LP), and right occipital (RO) and left occipital (LO) areas. Anesthesia (A) was induced by intramuscular injection of ketamine and xylazine administered at time (T) = −1,788 s (black dashed line). Cardiac arrest (CA) was induced by intracardiac injection of potassium chloride (1 M) at T = 0 s. Both EMG and EKG signals were isoelectric within 1 s of cardiac arrest. No significant correlation of EEG with EMG and EKG signals was found in any of the frequency bands (Fig. S1). (B) The 40-s segment, shown as a vertical gray bar in A, including 8 s before and 32 s after cardiac arrest, was expanded to reveal finer features. Following the last regular cardiac discharge, EKG signals displayed several irregular bursts that were not associated with any features of the EEG. The period following cardiac arrest was divided into four distinct states: CAS1 beginning at the T = 0 s and ending at the loss of oxygenated blood pulse (LOP; marked in vertical dashed line at T = 3 s); CAS2 beginning at LOP and ending at a delta blip (a short burst of delta oscillation) at T = 11 s; CAS3 beginning at the end of the delta blip (T = 12 s) and ending when the EEG signal reached below 10 μV at T = 30 s; and CAS4 spanning the cardiac arrest period after EEG signals were consistently below 10 μV. (C) The selected segments in B (indicated in vertical gray bars) were further expanded, and the EEG signals from all six channels were overlaid on top of each other to reveal further details. These results are not a consequence of pain associated with the cardiac arrest procedures, as nearly identical neurophysiologic events were stimulated at near-death by CO2 inhalation in rats (Fig. S2).
Fig. 2.
Fig. 2.
Gamma power increases after cardiac arrest. (A) The spectrograms of absolute power averaged over the six EEG channels during waking (30 min), anesthesia (30 min), and following cardiac arrest (20 min). A representative rat (ID5513) is shown in Top and Middle, and averaged values for nine rats are shown in Bottom. Time is relative to the moment of cardiac arrest (CA; T = 0 s), and the time of ketamine/xylazine administration was marked as A on top of the graph. (Middle) EEG power around the time of cardiac arrest is displayed in an expanded scale, which shows 8 s of anesthetized state and 32 s of cardiac arrest. The time of cardiac arrest induction, defined as T = 0 s, is marked as a red dashed line. The z axis of spectrograms (Top and Middle) uses a log scale with blue indicating low power and red denoting high power. Three distinct stages of EEG power were detected following cardiac arrest: CAS1, CAS2, and CAS3. The absolute power of eight frequency bands from nine rats was compared during waking, anesthesia, and CAS3 states (Bottom). During waking and anesthesia, the mean and SD of power were calculated with 10-min EEG epochs, and taken from the middle of both (waking and anesthesia) 30-min periods. CAS3 values were derived from the peak powers (2-s bin). A significant (P < 0.01) increase of power was detected for low-gamma bands (γ1; 25–55 Hz) over waking and anesthesia states, whereas power of other gamma bands, including medium gamma (γ2; 65–115 Hz), high gamma (γ3; 125–145 Hz), and ultra gamma (γ4; 165–250 Hz), all diminished. Note that the 60-Hz notch and its superharmonics were excluded from the defined bandwidths. Significant increases (P < 0.05) in lower-frequency bands (<25 Hz), including delta (0.1–5 Hz), theta (5–10 Hz), alpha (10–15 Hz), and beta (15–25 Hz), were detectable following anesthesia compared with the waking state. (B) Analogous to A, except with a display of relative power averaged over the six EEG channels during waking (30 min), anesthesia (30 min), and following cardiac arrest (20 min). Because lower-frequency bands decrease in power following cardiac arrest, gamma bands became more dominant. All gamma bands showed significant (P < 0.05) increases in relative power following cardiac arrest compared with waking and anesthesia states, whereas the theta band showed a significant increase over the anesthesia state (P < 0.05) to a level indistinguishable with the waking state (Bottom). Of the analyzed frequency bands, the low-gamma bands showed a dramatic increase in relative power at near-death compared with both the waking state and the anesthetized state (P < 0.0005). Error bar denotes SD (*P < 0.05, **P < 0.01, ***P < 0.001). The vertical axis on the right side of Bottom panels applies only to the gamma bands within the gray shaded areas. These results are not caused by pain associated with the cardiac arrest procedures, because comparable gamma surge was stimulated at near-death by CO2 inhalation in rats (Fig. S3).
Fig. 3.
Fig. 3.
Gamma coherence is markedly elevated after cardiac arrest. (A) Mean coherence values over six EEG channels during waking (30 min), anesthesia (30 min), and following cardiac arrest (20 min) are shown for one representative rat (ID5513). A narrow window of sharply increased coherence occurs across all frequency bands and is clearly detectable immediately following cardiac arrest (Upper); an expanded analysis is shown in Lower. Three distinct cardiac arrest states were detected: CAS1, CAS2, and CAS3. The z axis indicates the degree of coherence, with blue indicating low levels, and red indicating high levels, of coherence. Intense bands at both 60 and 180 Hz, and additional faint bands above 200-Hz ranges, are generated by ambient electromagnetic noise and persist for over 18 h after arrest. A 140-Hz band of uncertain significance appears to exhibit slight variation of frequency values during cardiac arrest. (B) The mean and SD of EEG coherence from six different locations were computed for eight indicated frequency bands during three states (n = 9). Significant (P < 0.01) increases in coherence of several frequency bands were found during CAS3 compared with anesthetized state: theta, γ1, γ2, and γ4; of these, low-gamma (γ1) oscillations displayed a significant (P < 0.001) increase in coherence compared with the waking state; theta coherence also showed a significant (P < 0.05) increase during CAS3 compared with the waking period. Error bar denotes SD (*P < 0.05, ***P < 0.001). These results are not a consequence of pain associated with the cardiac arrest procedures, because a nearly identical surge of gamma coherence was stimulated at near-death by CO2 inhalation in rats (Fig. S4).
Fig. 4.
Fig. 4.
Corticocortical connectivity surges following cardiac arrest. (A) Time course of feedback (red lines) and feedforward (blue lines) connectivity for the indicated frequency bands during waking (30 min), anesthesia (30 min), and following cardiac arrest (10 min). Connectivity between frontal and posterior (parietal and occipital areas) EEG activity was measured in 10-s bins by normalized symbolic transfer entropy (NSTE), a technique based in information theory. The vertical dashed lines denote the onset of anesthesia (A) and cardiac arrest (CA) induction. (B) The average feedback (Upper) and feedforward (Lower) connectivity at six frequency bands during waking, anesthesia, and following cardiac arrest in rats (n = 9). Connectivity index for both theta and gamma waves showed marked increase (P < 0.001) following cardiac arrest compared with both the waking and anesthesia states. Error bar denotes SD (***P < 0.001).
Fig. 5.
Fig. 5.
Gamma power is modulated by theta and alpha phase in the near-death state. (A) Phase-amplitude comodulogram computed for EEG signals from waking (Left), anesthesia (Center), and following cardiac arrest at CAS3 (Right; n = 9). Phase-amplitude coupling was determined by computation of a MI (30), and only MI values significantly elevated above randomly shuffled surrogate data (n = 50 for each EEG data, P < 0.05; adjusted P values) were averaged over all six EEG channels of nine rats. (B) Mean MIs for phases of three slower waves [delta (0.5–5 Hz), theta (5–10 Hz), and alpha (10–15 Hz)] and amplitudes of four faster waves [γ1 (25–55 Hz), γ2 (65–115 Hz), γ3 (125–175 Hz), and γ4 (185–250 Hz)] computed for waking (Left), anesthesia (Center), and CAS3 (Right) states.

Comment in

References

    1. Llinás R, Ribary U. Coherent 40-Hz oscillation characterizes dream state in humans. Proc Natl Acad Sci USA. 1993;90(5):2078–2081. - PMC - PubMed
    1. Strassman RJ, Qualls CR, Uhlenhuth EH, Kellner R. Dose-response study of N,N-dimethyltryptamine in humans. II. Subjective effects and preliminary results of a new rating scale. Arch Gen Psychiatry. 1994;51(2):98–108. - PubMed
    1. Griffiths RR, Richards WA, McCann U, Jesse R (2006) Psilocybin can occasion mystical-type experiences having substantial and sustained personal meaning and spiritual significance. Psychopharmacology 187(3):268–283; discussion 284–292. - PubMed
    1. Lutz A, Greischar LL, Rawlings NB, Ricard M, Davidson RJ. Long-term meditators self-induce high-amplitude gamma synchrony during mental practice. Proc Natl Acad Sci USA. 2004;101(46):16369–16373. - PMC - PubMed
    1. Parnia S, Waller DG, Yeates R, Fenwick P. A qualitative and quantitative study of the incidence, features and aetiology of near death experiences in cardiac arrest survivors. Resuscitation. 2001;48(2):149–156. - PubMed

Publication types