. 2013 Aug 27;110(35):14336-41.
doi: 10.1073/pnas.1221740110. Epub 2013 Aug 12.

CD8 memory T cells have a bioenergetic advantage that underlies their rapid recall ability

Affiliations

CD8 memory T cells have a bioenergetic advantage that underlies their rapid recall ability

Gerritje J W van der Windt et al. Proc Natl Acad Sci U S A. .

Abstract

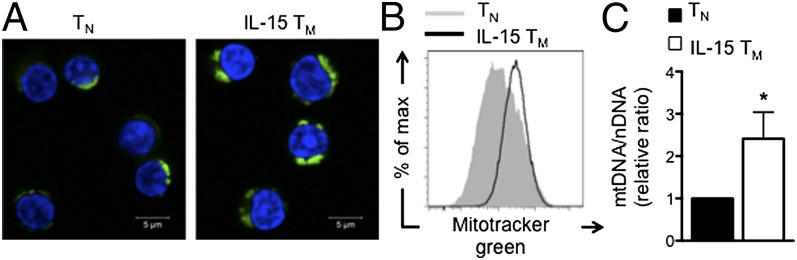
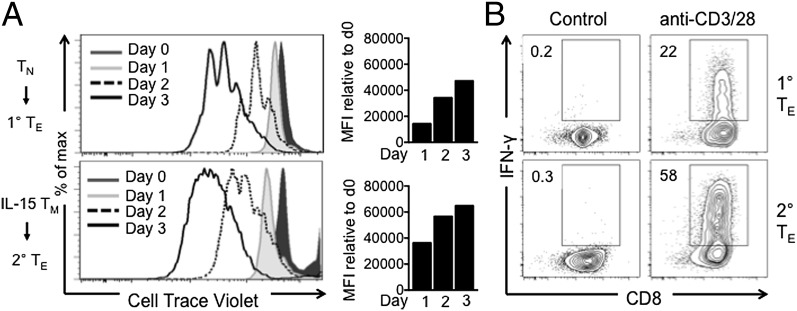
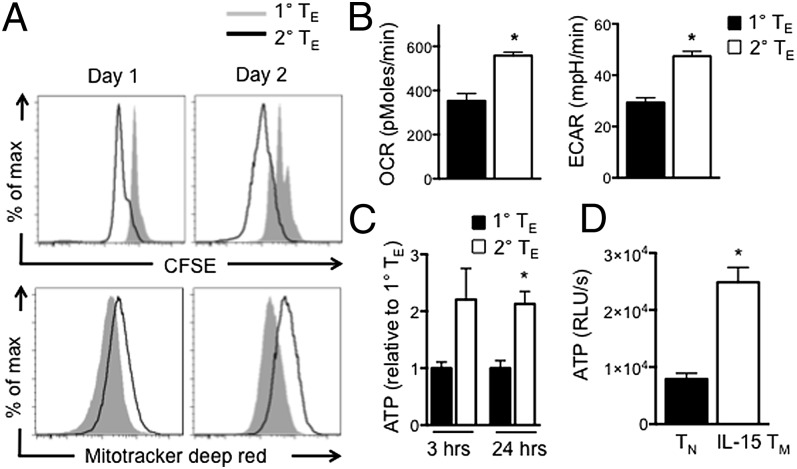
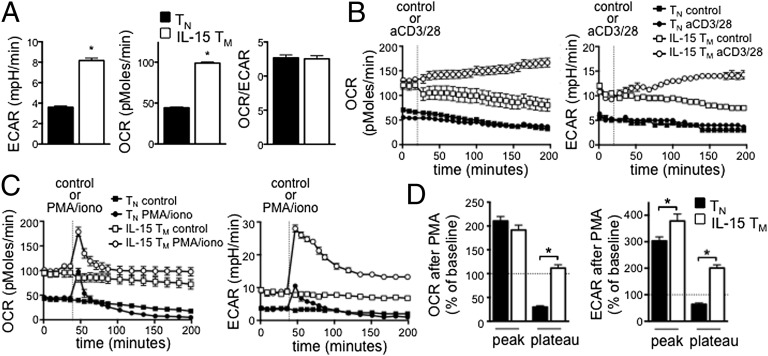
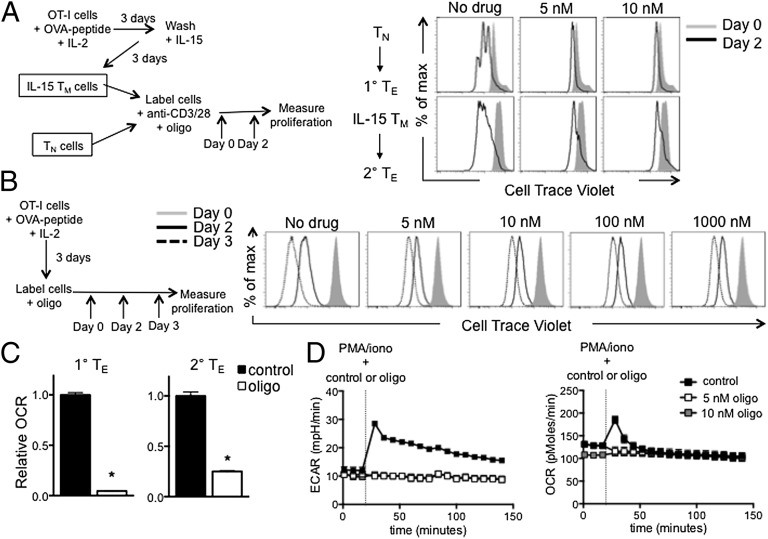
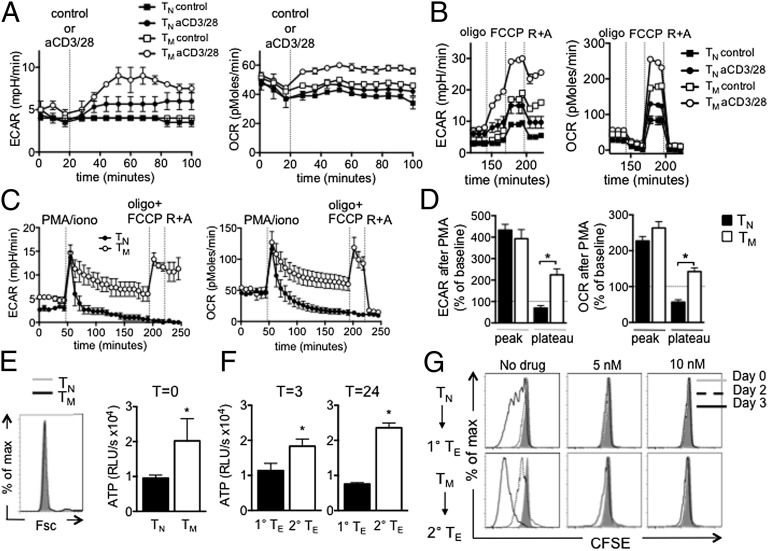
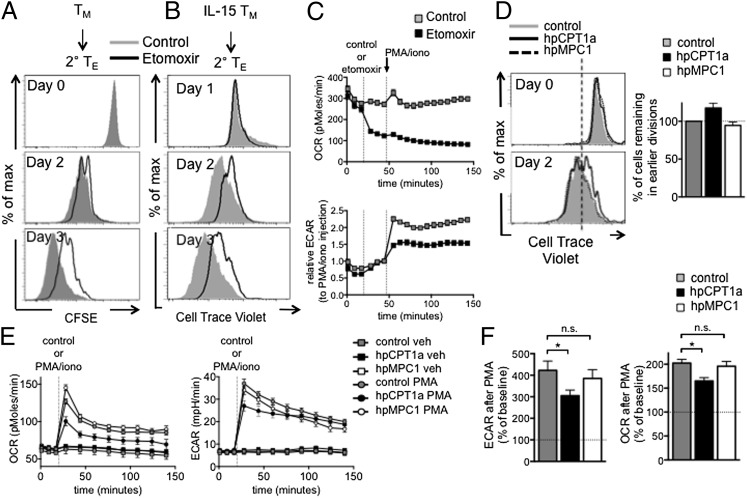
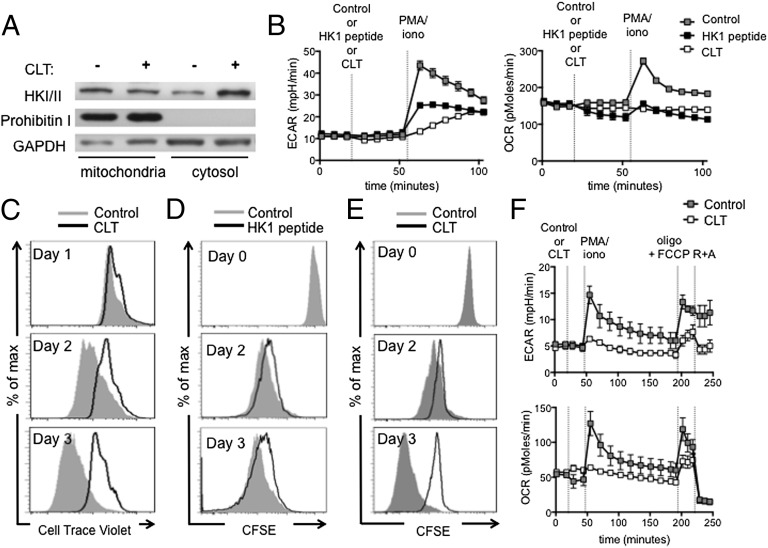
A characteristic of memory T (TM) cells is their ability to mount faster and stronger responses to reinfection than naïve T (TN) cells do in response to an initial infection. However, the mechanisms that allow this rapid recall are not completely understood. We found that CD8 TM cells have more mitochondrial mass than CD8 TN cells and, that upon activation, the resulting secondary effector T (TE) cells proliferate more quickly, produce more cytokines, and maintain greater ATP levels than primary effector T cells. We also found that after activation, TM cells increase oxidative phosphorylation and aerobic glycolysis and sustain this increase to a greater extent than TN cells, suggesting that greater mitochondrial mass in TM cells not only promotes oxidative capacity, but also glycolytic capacity. We show that mitochondrial ATP is essential for the rapid induction of glycolysis in response to activation and the initiation of proliferation of both TN and TM cells. We also found that fatty acid oxidation is needed for TM cells to rapidly respond upon restimulation. Finally, we show that dissociation of the glycolysis enzyme hexokinase from mitochondria impairs proliferation and blocks the rapid induction of glycolysis upon T-cell receptor stimulation in TM cells. Our results demonstrate that greater mitochondrial mass endows TM cells with a bioenergetic advantage that underlies their ability to rapidly recall in response to reinfection.

Keywords: lymphocytes; metabolism.


Conflict of interest statement

The authors declare no conflict of interest.

Figures

Fig. 1.
Fig. 1.
IL-15 TM cells have more mitochondrial mass than TN cells. OT-I cells were activated with OVA peptide for 3 d in IL-2 and cultured in IL-15 for 3–4 d to generate IL-15 TM cells, which were compared with OT-I TN cells. (A) TN and IL-15 TM cells stained with Mitotracker green (green) and DRAQ5 (blue). (B) Mitotracker green staining was quantified by flow cytometry. Data are representative of three experiments. (C) mtDNA/nDNA ratio, mean ± SEM, from six experiments; *P < 0.05.
Fig. 2.
Fig. 2.
Secondary TE cells proliferate faster and make more IFN-γ than primary TE cells. Naïve OT-I and IL-15 TM cells were (re)stimulated with anti-CD3/28 for 3 d. (A) Proliferation by Cell Trace Violet dilution at indicated time points. Bar graphs represent difference in mean fluorescence intensity (MFI) at the indicated time point relative to t = 0. (B) IFN-γ production 2 d after (re)stimulation; representative of ≥2 experiments.
Fig. 3.
Fig. 3.
Enhanced secondary TE cell proliferation is marked by greater metabolic activity and ATP production. Naïve OT-I and IL-15 TM cells were (re)stimulated with anti-CD3/28. (A) Proliferation and Mitotracker deep red staining 1 and 2 d after (re)stimulation. (B) OCR and ECAR in primary and secondary TE cells 2 d after stimulation; mean ± SEM; *P < 0.0001. (C and D) ATP in primary and secondary TE cells 3 and 24 h after (re)stimulation with anti-CD3/28 (C), and in naïve and IL-15 TM cells (D). Data are shown as mean ± SEM; *P < 0.005 (C) and < 0.001 (D); representative of ≥2 experiments.
Fig. 4.
Fig. 4.
IL-15 TM cells have enhanced glycolytic capacity compared with TN cells after activation. (A) Basal ECAR and OCR were measured in OT-I TN and IL-15 TM cells; *P < 0.0001. TN and IL-15 TM cells were stimulated with anti-CD3/28 beads (B) or with PMA/iono (C) and OCR and ECAR measured. Data in AC are from the same experiment and are representative of ≥3 experiments. (D) Compiled and baselined data as shown in C, from two experiments; peak is first measurement after PMA/iono, plateau is at 120 min. *P < 0.0001 (Left), and < 0.05 and < 0.001 (Right); mean ± SEM.
Fig. 5.
Fig. 5.
Mitochondria-derived ATP is required for the initiation of proliferation and facilitates glycolysis in IL-15 TM cells after PMA/iono. (A) OT-I TN and IL-15 TM cells were (re)stimulated with anti-CD3/28 with or without oligo (added at day 0), and proliferation is shown at days 0 and 2; representative of four experiments. (B) OT-I cells were activated with OVA peptide and IL-2 for 3 d, then labeled with Cell Trace Violet and oligo added (day 0). Proliferation was observed at days 0, 2, and 3; representative of two experiments. (C) Relative OCR in primary and secondary TE cells 2 d after anti-CD3/28, ±5 nM oligo; mean ± SEM, representative of two experiments; *P < 0.0001. (D) IL-15 TM cells were restimulated with PMA/iono, with or without oligo, and OCR and ECAR were measured. Data are shown as mean ± SEM, representative of three experiments.
Fig. 6.
Fig. 6.
TM cells have enhanced glycolysis, more ATP, and proliferate faster than TN cells after activation. CD8 TN (CD44lo CD62Lhi) and TM (CD44hi CD62Lhi) cells were isolated from naïve and LmOVA-infected mice. OCR and ECAR in TN and TM cells after stimulation with aCD3/28 coated beads (A), and after subsequent oligo (1 μM), FCCP (1.5 μM), and rotenone (100 nM) plus antimycin A (1 µM) injections (B) (data in A and B are from the same experiment). (C) TN and TM cells were PMA/iono stimulated, exposed to oligo + FCCP, and R+A, and OCR and ECAR measured. TN is the same as Fig. S4, TM is the same as Fig. 8F and Fig. S7. (D) Compiled and baselined data as shown in C, from two experiments; peak is first measurement after PMA/iono, plateau is at 120 min. *P < 0.0005 (Left), and < 0.0001 (Right). Forward scatter and ATP of resting TN and TM cells (E), and ATP in primary and secondary TE cells 3 and 24 h after aCD3/28 (F). (G) TN and TM cells stimulated with aCD3/28 with or without oligo (day 0) and proliferation is shown. TN control is the same as in Figs. S6B and S12B. TM control is the same as Fig. 7A and 8E; mean ± SEM, representative of two (A, B, and E), 3 (C), or one (F and G) experiment(s).
Fig. 7.
Fig. 7.
FAO fuels the OXPHOS needed for rapid recall of TM cells. (A) Proliferation of TM cells from LmOVA-infected mice after anti-CD3/28 ± etomoxir (day 0); control is same as Fig. 6G and 8E. Data are from one experiment. (B) Proliferation of IL-15 TM cells after anti-CD3/28 ± etomoxir; representative of four experiments. (C) OCR and ECAR of IL-15 TM cells after PMA/iono ± etomoxir; mean ± SEM, representative of four experiments. (DF) Proliferation of IL-15 TM cells expressing control (shRNA against luciferase), hpCPT1a (shRNA against CPT1a), or hpMPC1 (shRNA against MPC1) retrovirus after anti-CD3/28 (D); graph shows percent of cells normalized to control cells in gate with fewer divisions (separated by line), generated from two experiments. (E) OCR and ECAR of control, hpCPT1a, and hpMPC1 IL-15 TM cells after PMA/iono. (F) Compiled and baselined data as shown in E, from three experiments; peak is at first measurement after PMA/iono, plateau is at 120 min. n.s., not significant. *P < 0.05; mean ± SEM (E and F) and representative of two (D) or four (E) experiments.
Fig. 8.
Fig. 8.
Dissociation of HK from mitochondria impairs proliferation and the rapid engagement of glycolysis in (IL-15) TM cells after activation. (A) Western blot analysis for HK I and II in IL-15 TM cells incubated ± CLT for 2 h; GAPDH and prohibitin I are loading controls for cytosolic and mitochondrial fractions, respectively; representative of two experiments. (B) OCR and ECAR of IL-15 TM cells stimulated with PMA/iono in the presence of control or HK-1 peptide (10 μM) or CLT (25 μM); mean ± SEM, representative of ≥2 experiments. IL-15 TM cells were stimulated with anti-CD3/28 and proliferation ± CLT; representative of five experiments (C), or with control or HK-1 peptide (10 μM); representative of two experiments, is shown (D). (E and F) TM cells from LmOVA-infected mice. Proliferation after anti-CD3/28 ± CLT; control is same as Fig. 6G and 7A, from one experiment (E); OCR and ECAR after PMA/iono ± CLT and exposed to oligo (1 μM) plus FCCP (1.5 μM), and rotenone (100 nM) plus antimycin A (1 µM); mean ± SEM and representative of two experiments; control is the same as Fig. 6C and Fig. S7 (F).

References

    1. DiSpirito JR, Shen H. Quick to remember, slow to forget: Rapid recall responses of memory CD8+ T cells. Cell Res. 2010;20(1):13–23. - PubMed
    1. Farber DL. Biochemical signaling pathways for memory T cell recall. Semin Immunol. 2009;21(2):84–91. - PMC - PubMed
    1. Veiga-Fernandes H, Walter U, Bourgeois C, McLean A, Rocha B. Response of naïve and memory CD8+ T cells to antigen stimulation in vivo. Nat Immunol. 2000;1(1):47–53. - PubMed
    1. Cho BK, Wang C, Sugawa S, Eisen HN, Chen J. Functional differences between memory and naive CD8 T cells. Proc Natl Acad Sci USA. 1999;96(6):2976–2981. - PMC - PubMed
    1. Grayson JM, Harrington LE, Lanier JG, Wherry EJ, Ahmed R. Differential sensitivity of naive and memory CD8+ T cells to apoptosis in vivo. J Immunol. 2002;169(7):3760–3770. - PubMed

Publication types