. 2013 Sep 10;110(37):E3535-43.
doi: 10.1073/pnas.1312545110. Epub 2013 Aug 12.

An alternative polyadenylation mechanism coopted to the Arabidopsis RPP7 gene through intronic retrotransposon domestication

Affiliations

An alternative polyadenylation mechanism coopted to the Arabidopsis RPP7 gene through intronic retrotransposon domestication

Tokuji Tsuchiya et al. Proc Natl Acad Sci U S A. .

Abstract

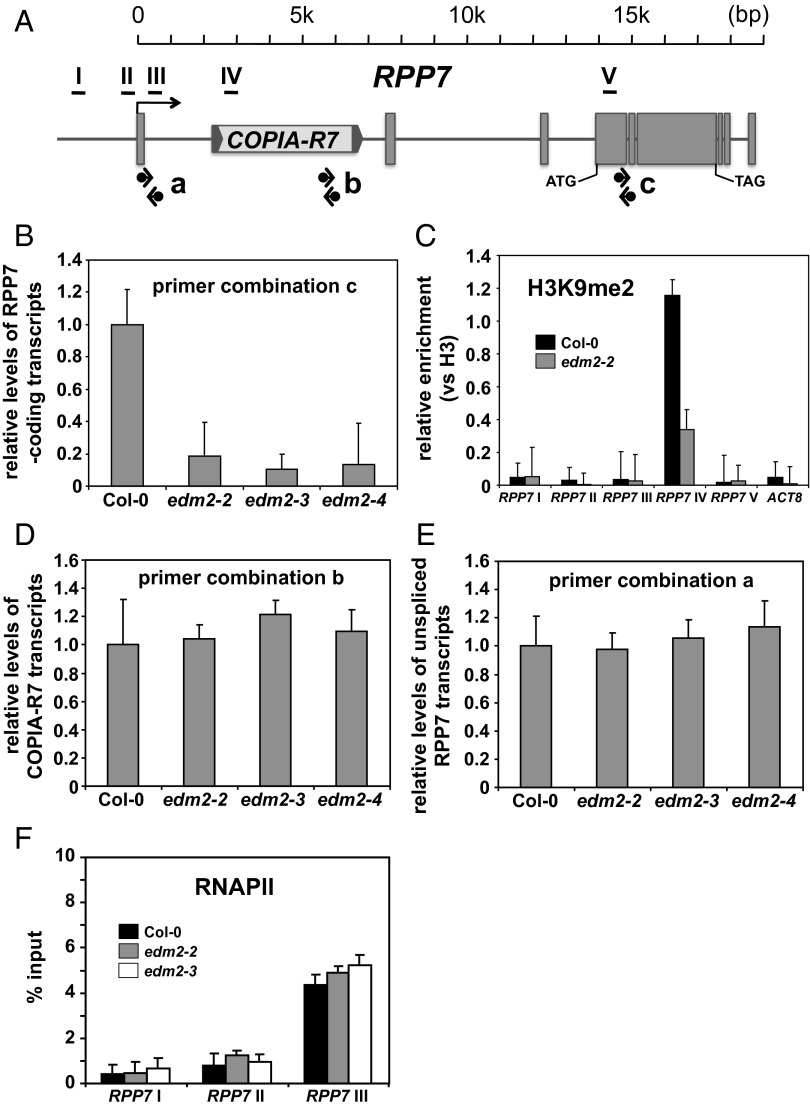
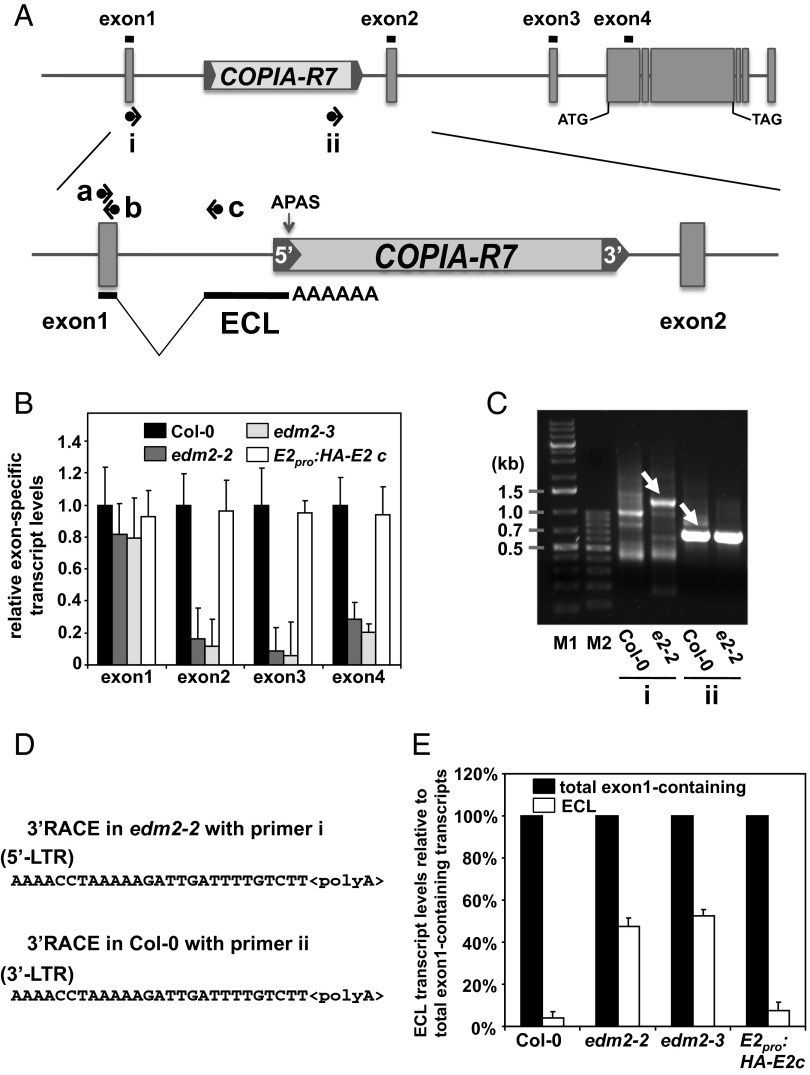
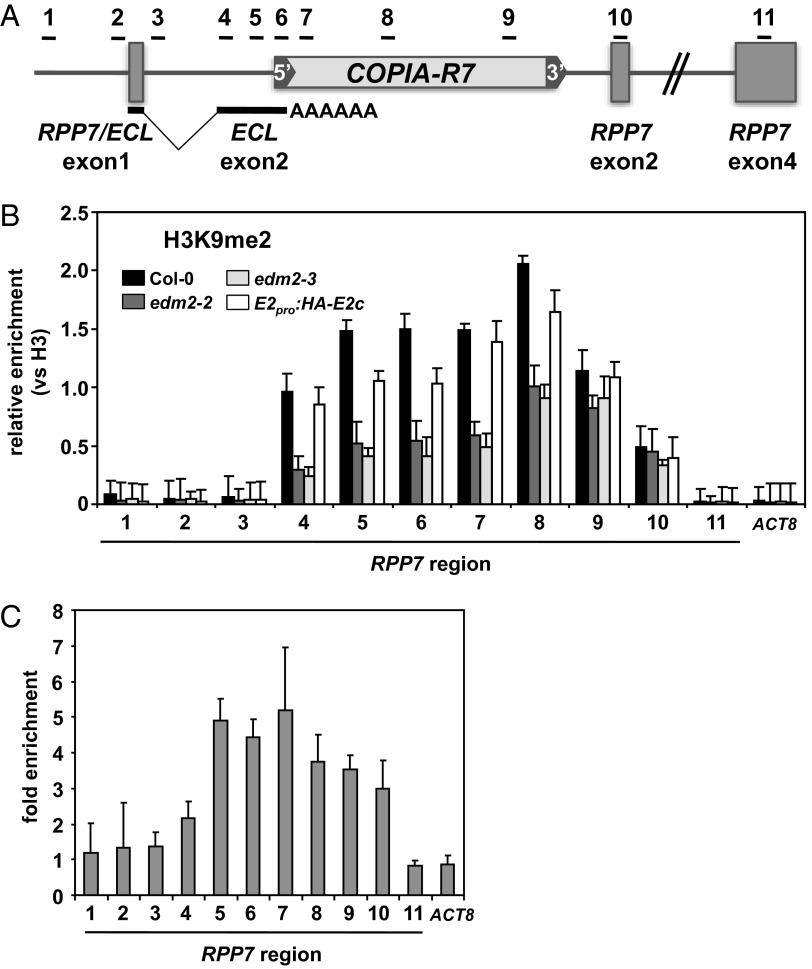
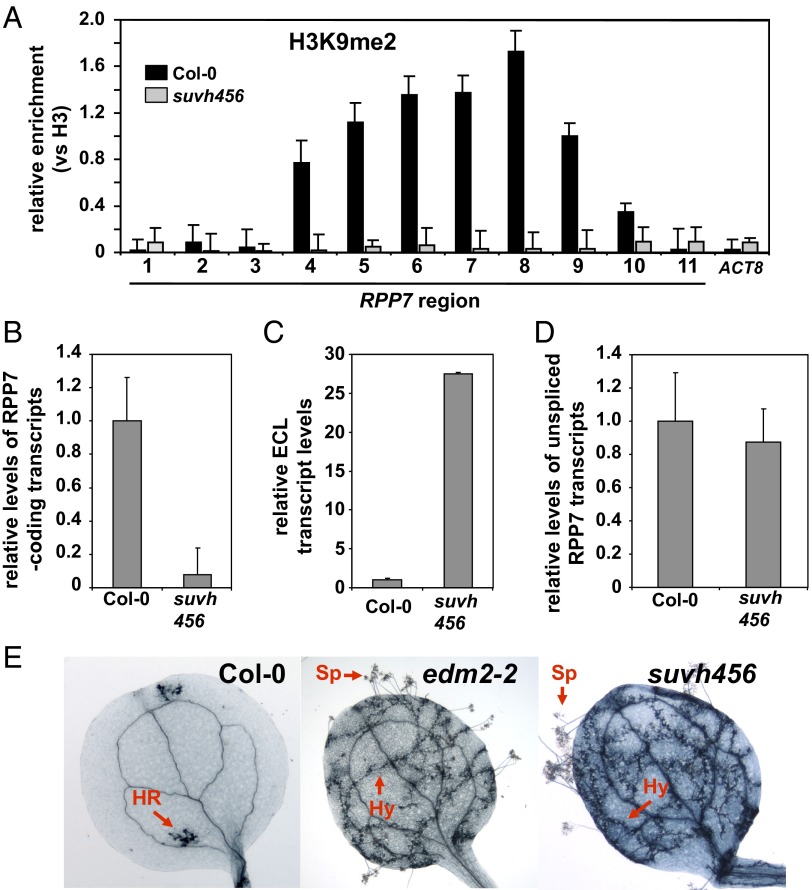
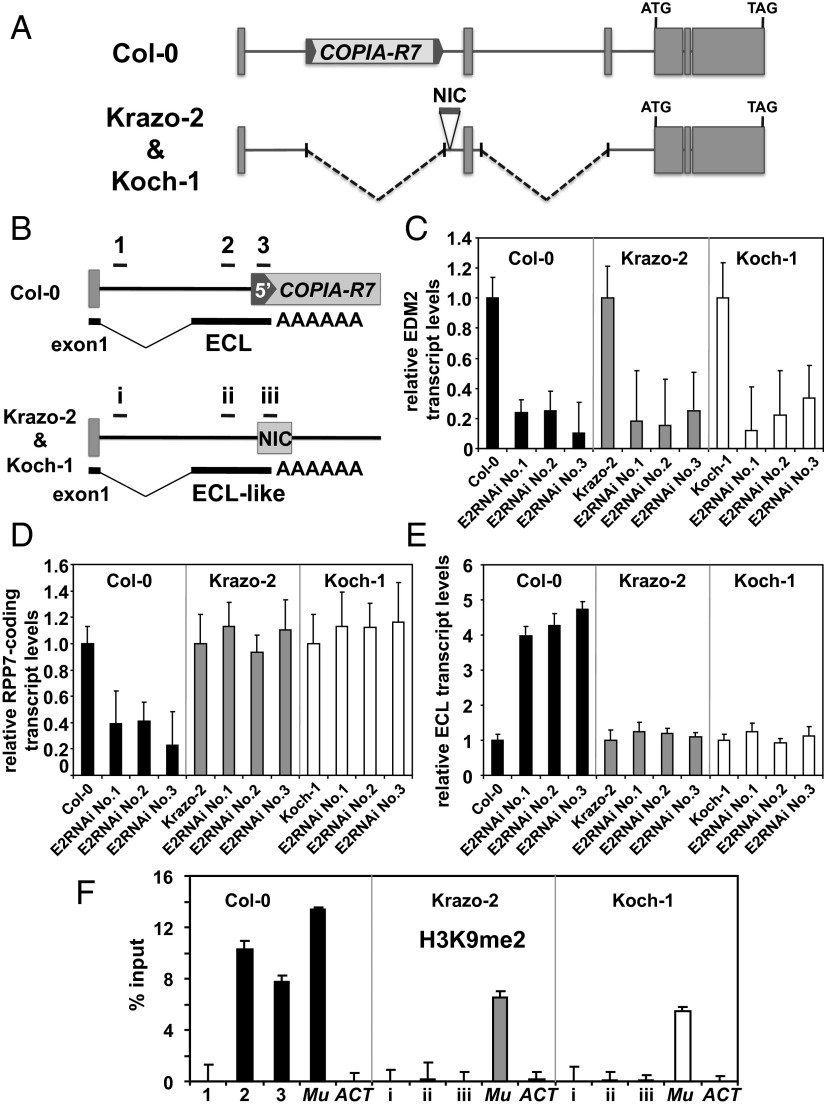
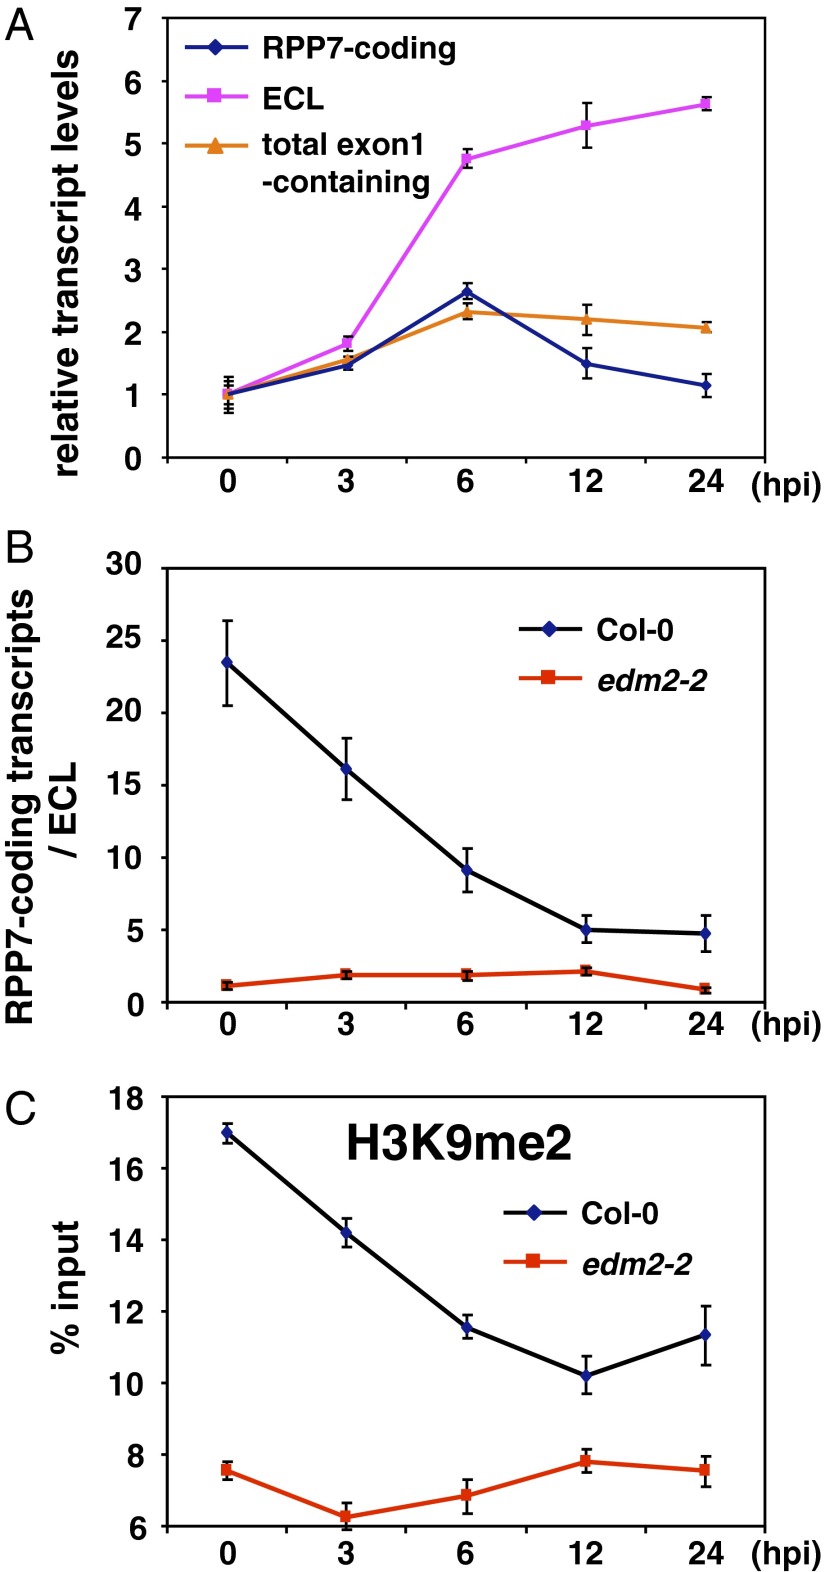
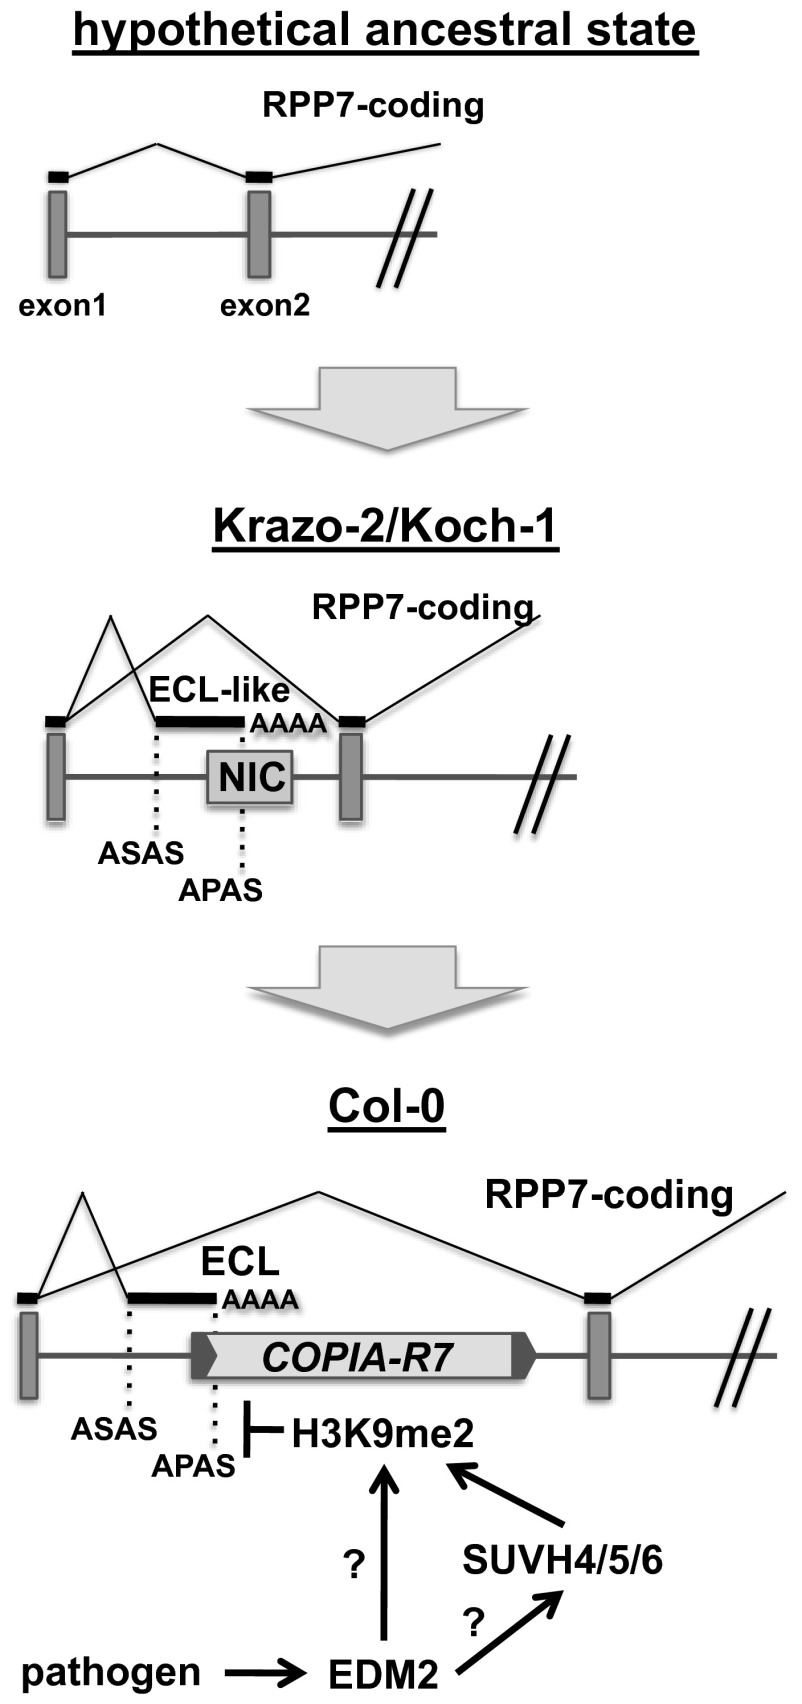
Transposable elements (TEs) can drive evolution by creating genetic and epigenetic variation. Although examples of adaptive TE insertions are accumulating, proof that epigenetic information carried by such "domesticated" TEs has been coopted to control host gene function is still limited. We show that COPIA-R7, a TE inserted into the Arabidopsis thaliana disease resistance gene RPP7 recruited the histone mark H3K9me2 to this locus. H3K9me2 levels at COPIA-R7 affect the choice between two alternative RPP7 polyadenylation sites in the pre-mRNA and, thereby, influence the critical balance between RPP7-coding and non-RPP7-coding transcript isoforms. Function of RPP7 is fully dependent on high levels of H3K9me2 at COPIA-R7. We present a direct in vivo demonstration for cooption of a TE-associated histone mark to the epigenetic control of pre-mRNA processing and establish a unique mechanism for regulation of plant immune surveillance gene expression. Our results functionally link a histone mark to alternative polyadenylation and the balance between distinct transcript isoforms from a single gene.

Keywords: EDM2; Hyaloperonospora arabidopsidis; PHD finger; post translational histone modification.


Conflict of interest statement

The authors declare no conflict of interest.

Figures

Fig. 1.
Fig. 1.
Effects of EDM2 on transcripts and H3K9me2 at the RPP7 locus. (A) Schematic representation of the RPP7 locus in the Arabidopsis Col-0 accession. RPP7 exons are shown as gray-filled boxes. Two LTRs flanking the body of COPIA-R7 are represented as gray-filled arrowheads. Horizontal bars (I, II, III, IV, and V) denote regions analyzed by ChIP shown in B and F. Black arrows indicate positions of PCR primers used for analyses shown in B, D, and E. (B) Levels of RPP7-coding transcripts (spliced mature transcripts) measured by qRT-PCR using primer combination c annealing to sequences in exon4 and exon5. Error bars represent SD for three independent experiments. (C) ChIP-qPCR to measure H3K9me2 levels at RPP7/COPIA-R7. The y axis represents H3K9me2 levels normalized to histone H3 occupancy. ACTIN8 (ACT8) serves as a control locus. Error bars represent SEM for two biological replicates with three technical replicates each. (D) COPIA-R7 transcript levels determined by qRT-PCR with primer combination b annealing to sequences within the transposon. Error bars represent SD for three independent experiments. (E) Levels of nascent (unspliced) RPP7 transcripts determined by qRT-PCR with primer combination a annealing to sequences in exon1 and intron1. Error bars represent SD for three independent experiments. (F) ChIP-qPCR to measure RNAPII occupancy at three RPP7 regions surrounding the transcription start site. The y axis represents RNAPII levels normalized to total input. Error bars represent SEM for two biological replicates with three technical replicates each.
Fig. 2.
Fig. 2.
Effects of EDM2 on the ratio of RPP7 RNA transcript isoforms. (A) Schematic representation of RPP7 with the RNA transcript isoform ECL. Black horizontal lines above each exon represent regions amplified by qRT-PCR in the experiment shown in B. Black horizontal arrows represent PCR primers used for 3′RACE (i and ii) or qRT-PCR (a–c) in C or E, respectively. The alternative polyadenylation site (APAS) preferentially used in edm2 mutants is marked by a vertical arrow. (B) Levels of exon-specific transcripts measured by qRT-PCR. Error bars represent SD for three independent experiments. (C) The 3′RACE analysis of poly(A)-selected total mRNAs extracted from Col-0 or edm2-2 mutant plants with primers i and ii represented in the Upper section of A. The bands marked with white arrows were further analyzed by sequencing. M1, GeneRuler 1 kb Plus DNA ladder (Fermentas). M2, GeneRuler 100 bp DNA ladder (Fermentas). (D) Polyadenylation sites of ECL (Upper) or COPIA-R7 (Lower) revealed by 3′RACE experiments. (E) Ratios of ECL transcripts relative to total exon1-containing transcripts determined by qRT-PCR. Total exon1-containing transcripts were determined using primers a and b (A) whereas ECL transcripts were measured using primers a and c (A). Error bars represent SD for three independent experiments.
Fig. 3.
Fig. 3.
EDM2 is physically associated with H3K9me2-marked chromatin regions at RPP7/COPIA-R7. (A) Schematic representation of the upstream region of the RPP7 locus. Horizontal bars represent areas examined by ChIP-qPCR in B and C. (B) H3K9me2 levels determined by ChIP-qPCR in Col-0, edm2-2, edm2-3, and the E2pro:HA-E2c complementation line. The y axis represents H3K9me2 levels normalized to histone H3 occupancy. ACTIN8 (ACT8) served as a control locus. Error bars represent SEM for two biological replicates with three technical replicates each. (C) Levels of HA-tagged EDM2 (HA-EDM2) at RPP7 in E2pro:HA-E2c plants. ChIP-qPCR was pefromed with an anti-HA tag antibody. ACTIN8 (ACT8) served as a control locus. The y axis represents fold enrichment of signals in the E2pro:HA-E2c line relative to those in Col-0. Error bars represent SEM for two biological replicates with three technical replicates each.
Fig. 4.
Fig. 4.
The Col-0 suvh456 triple mutant phenocopies RPP7-related effects of edm2 mutants. (A) H3K9me2 levels determined by ChIP-qPCR in Col-0, edm2-2, and suvh456. The y axis represents H3K9me2 levels normalized to histone H3 occupancy. ACTIN8 (ACT8) served as a control locus. Error bars represent SEM for two biological replicates with three technical replicates each. (B) Levels of RPP7-coding transcripts (spliced mature transcripts) measured by qRT-PCR using primer combination b (Fig. 1A) located in exon4 and exon5 of RPP7 in Col-0, edm2-2, edm2-3, and suvh456. Error bars represent SD for three independent experiments. (C) Levels of ECL transcripts measured by qRT-PCR using primers a and c (Fig. 2A) in Col-0, edm2-2, edm2-3, and suvh456. Error bars represent SD for three independent experiments. (D) Levels of nascent (unspliced) RPP7 transcripts determined by qRT-PCR with primer combination a (Fig. 1A) annealing to sequences in exon1 and intron1 of RPP7. Error bars represent SD for three independent experiments. (E) Typical trypan blue-stained cotyledons of 2-wk-old Col-0, edm2-2, and suvh456 seedlings 7 d postinfection with 5 × 10⁴ spores of the H. arabidopsidis (Hpa) isolate Hiks1 mL−1. This Hpa isolate is highly specifically recognized by RPP7 (23, 41).Trypan blue stains Hpa structures as well as plant hypersensitive response (HR) sites dark blue. HR, HR site; Hy, Hpa hyphae; Sp, Hpa sporangiophores. HR is a programmed cell death response closely associated with immunity against Hpa whereas Hy and Sp occur when immunity fails and the plant is susceptible to Hpa (23, 30).
Fig. 5.
Fig. 5.
Effects of EDM2 on RPP7 expression in Arabidopsis natural accessions. (A) Schematic representation of the RPP7 locus in Arabidopsis Col-0, Krazo-2, and Koch-1 accessions. RPP7 exons are shown as gray-filled boxes. The genomic DNA sequence block NIC in Krazo-2/Koch-1 is represented as gray-filled horizontal bars. (B) Schematic representation of the upstream region of RPP7 locus with the RNA transcript isoform ECL in Col-0 and Krazo-2/Koch-1. Horizontal bars (1–3 and i–iii) denote regions analyzed by ChIP for H3K9me2 in F. (C) Transcript levels of EDM2 determined by qRT-PCR in Col-0, Krazo-2, Koch-1, and EDM2 silencing lines in the background of each of these three Arabidopsis accessions. Error bars represent SD for three independent experiments. (D) Levels of RPP7-coding transcripts determined by qRT-PCR in Col-0, Krazo-2, Koch-1, and the respective EDM2 silencing lines. Error bars represent SD for three independent experiments. (E) Levels of ECL transcripts determined by qRT-PCR in Col-0, Krazo-2, Koch-1, and the respective EDM2 silencing lines. Error bars represent SD for three independent experiments. (F) ChIP-qPCR to measure H3K9me2 levels at RPP7 in Col-0, Krazo-2, and Koch-1. The y axis represents H3K9me2 levels normalized to input DNA. The ECL regions represented in B were tested. The DNA transposon Mu1 (Mu) and Actin8 (ACT) served as positive and negative controls, respectively. Error bars represent SEM for two biological replicates with three technical replicates each.
Fig. 6.
Fig. 6.
Fine-tuning of RPP7-coding transcript levels in response to HpaHiks1 infection. (A) qRT-PCRs to monitor levels of RPP7-coding, ECL, and total exon1-containing transcripts in Col-0 plants at various time points after infection with HpaHiks1. (B) Ratio between RPP7-coding and ECL transcripts at the time points after infection with HpaHiks1 in Col-0 and edm2-2 plants. (C) Levels of H3K9me2 at region 6 in Fig. 3A at the time points after infection with HpaHiks1 in Col-0 and edm2-2 plants. Error bars represent SD or SEM for transcripts or H3K9me2, respectively, of three qPCR values from one representative of three independent experiments. Independent replications of the time course reproducibly showed the same trend of changes of transcripts and H3K9me2 levels. However, the timing of induction varied depending on the experiment.
Fig. 7.
Fig. 7.
Model for the cooption of H3K9me2-mediated APA regulation to the RPP7 locus through COPIA-R7 domestication. The starting point in the evolution of the RPP7/COPIA-R7 haplotype is a hypothetical ancestral state in a putative common ancestor of Col-0, Krazo2, and Koch1. Here, RPP7 is not subject to sophisticated co- or posttranscriptional expression control. An intermediate example is the state represented in Koch1 and Krazo2, where an alternative polyadenylation mechanism involving an alternative polyadenylation site (APAS) provided by the NIC sequence defines the balance between RPP7-coding and ECL-like transcripts. An advanced state, that likely has evolved from the intermediate state represented in Koch1 and Krazo2, is the situation in Col-0 (and likely most other A. thaliana accessions) where, due to the COPIA-R7 domestication event, an EDM2-controlled and H3K9me2-dependent alternative polyadenylation mechanism allows for dynamic regulation of the RPP7-coding transcript/ECL balance in response to defense-related stimuli. In the absence of functional EDM2 or SUVH4/5/6, the chromatin region of ECL/COPIA-R7 in RPP7 is marked only by low levels of H3K9me2. Under this condition, the promoter-proximal APAS, which is present in 5′-LTR of COPIA-R7, is preferentially used. Enhanced use of this APAS results in enhanced levels of ECL and reduced levels of RPP7-coding transcripts. Function of EDM2 or SUVH4/5/6 counteracts this negative effect on RPP7-coding transcript levels by enhancing H3K9me2 in the ECL/COPIA-R7 region. Increased H3K9me2 levels are possibly associated with changes of the local chromatin structure or altered levels of other epigenetic marks. It is unknown whether EDM2 directly affects H3K9me2 at RPP7/COPIA-R7 or whether it acts via histone methyl transferases, such as SUVH4, -5, and/or -6. ASAS, alternative splicing acceptor site. Dark gray boxes represent exons. Transcript parts retained in the RPP7-coding and ECL–like transcripts are represented by black horizontal lines.

Comment in

References

    1. Rigal M, Mathieu O. A “mille-feuille” of silencing: Epigenetic control of transposable elements. Biochim Biophys Acta. 2011;1809(8):452–458. - PubMed
    1. Jackson JP, Lindroth AM, Cao X, Jacobsen SE. Control of CpNpG DNA methylation by the KRYPTONITE histone H3 methyltransferase. Nature. 2002;416(6880):556–560. - PubMed
    1. Johnson L, Cao X, Jacobsen S. Interplay between two epigenetic marks: DNA methylation and histone H3 lysine 9 methylation. Curr Biol. 2002;12(16):1360–1367. - PubMed
    1. Ebbs ML, Bartee L, Bender J. H3 lysine 9 methylation is maintained on a transcribed inverted repeat by combined action of SUVH6 and SUVH4 methyltransferases. Mol Cell Biol. 2005;25(23):10507–10515. - PMC - PubMed
    1. Ebbs ML, Bender J. Locus-specific control of DNA methylation by the Arabidopsis SUVH5 histone methyltransferase. Plant Cell. 2006;18(5):1166–1176. - PMC - PubMed

Publication types

MeSH terms