Comparative Study
. 2013 Aug 5;8(8):e70630.
doi: 10.1371/journal.pone.0070630. Print 2013.

Transcriptional blood signatures distinguish pulmonary tuberculosis, pulmonary sarcoidosis, pneumonias and lung cancers

Affiliations
Comparative Study

Transcriptional blood signatures distinguish pulmonary tuberculosis, pulmonary sarcoidosis, pneumonias and lung cancers

Chloe I Bloom et al. PLoS One. .

Erratum in

  • PLoS One. 2013;8(8).doi: 10.1371/annotation/7d9ec449-aee0-48fe-8111-0c110850c0c1. Dominique, Valeyre [corrected to Valeyre, Dominique]

Abstract

Rationale: New approaches to define factors underlying the immunopathogenesis of pulmonary diseases including sarcoidosis and tuberculosis are needed to develop new treatments and biomarkers. Comparing the blood transcriptional response of tuberculosis to other similar pulmonary diseases will advance knowledge of disease pathways and help distinguish diseases with similar clinical presentations.

Objectives: To determine the factors underlying the immunopathogenesis of the granulomatous diseases, sarcoidosis and tuberculosis, by comparing the blood transcriptional responses in these and other pulmonary diseases.

Methods: We compared whole blood genome-wide transcriptional profiles in pulmonary sarcoidosis, pulmonary tuberculosis, to community acquired pneumonia and primary lung cancer and healthy controls, before and after treatment, and in purified leucocyte populations.

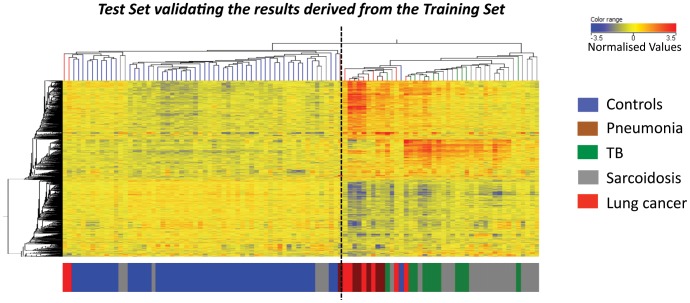
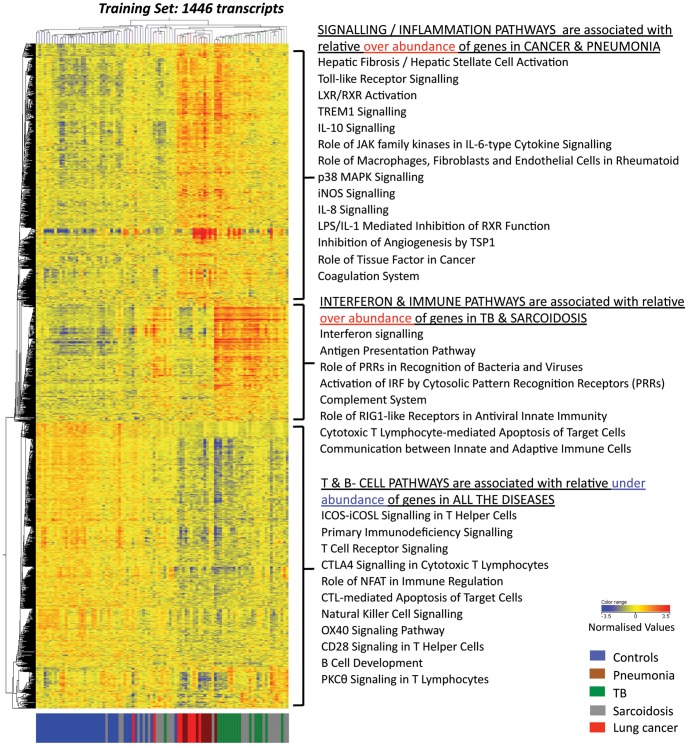
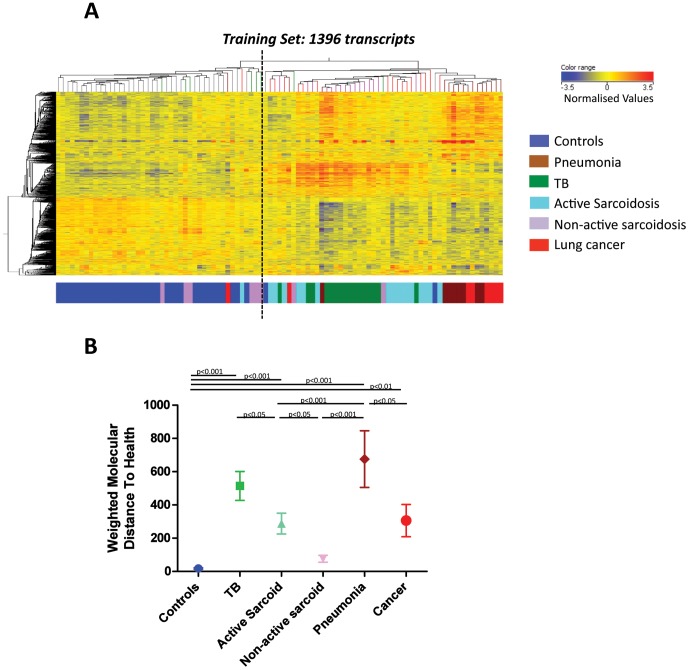
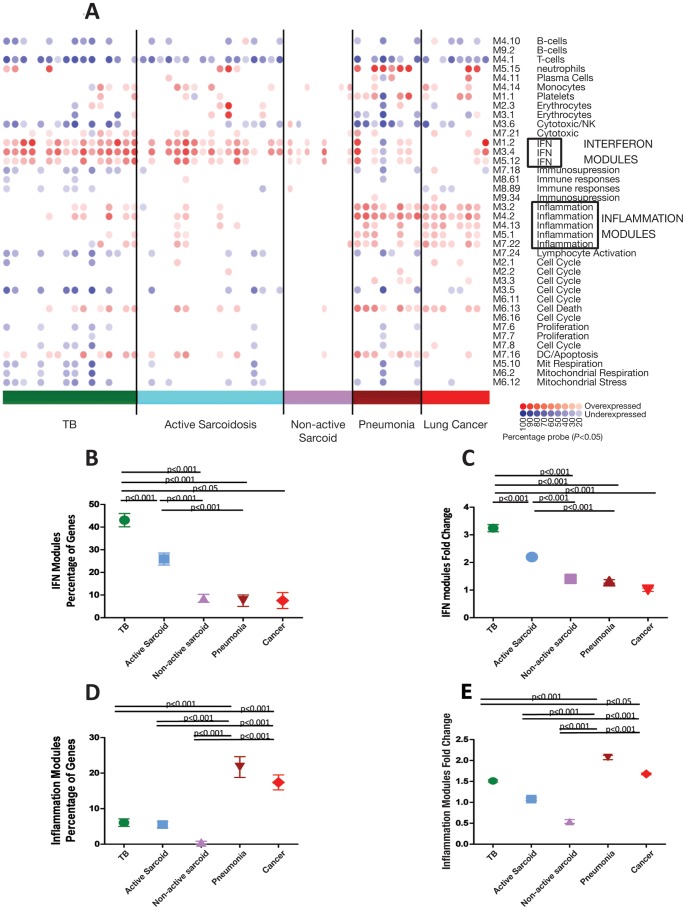
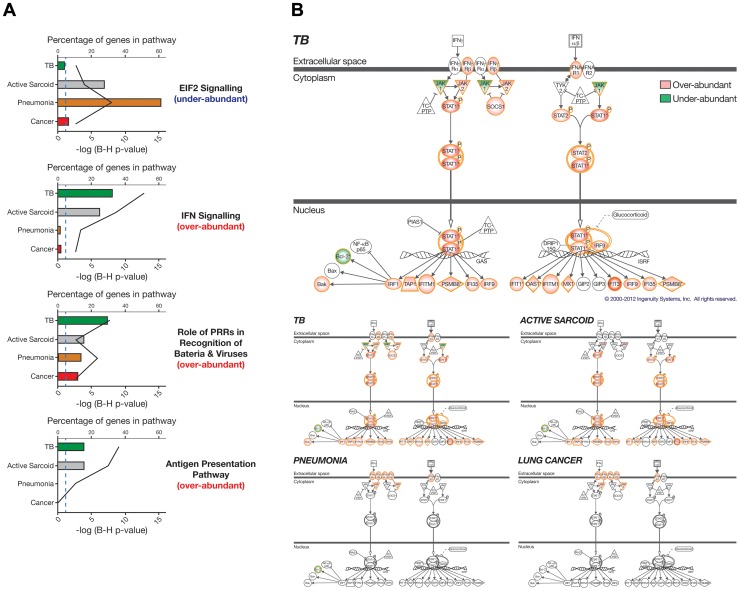
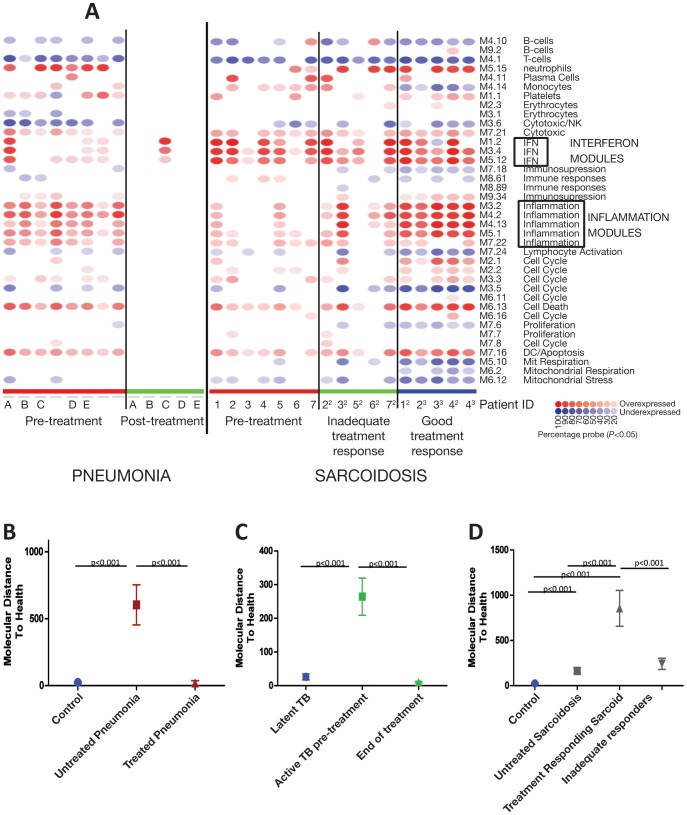
Measurements and main results: An Interferon-inducible neutrophil-driven blood transcriptional signature was present in both sarcoidosis and tuberculosis, with a higher abundance and expression in tuberculosis. Heterogeneity of the sarcoidosis signature correlated significantly with disease activity. Transcriptional profiles in pneumonia and lung cancer revealed an over-abundance of inflammatory transcripts. After successful treatment the transcriptional activity in tuberculosis and pneumonia patients was significantly reduced. However the glucocorticoid-responsive sarcoidosis patients showed a significant increase in transcriptional activity. 144-blood transcripts were able to distinguish tuberculosis from other lung diseases and controls.

Conclusions: Tuberculosis and sarcoidosis revealed similar blood transcriptional profiles, dominated by interferon-inducible transcripts, while pneumonia and lung cancer showed distinct signatures, dominated by inflammatory genes. There were also significant differences between tuberculosis and sarcoidosis in the degree of their transcriptional activity, the heterogeneity of their profiles and their transcriptional response to treatment.


Conflict of interest statement

Competing Interests: Co-author Robert Wilkinson is PLOS ONE Editorial Board member however this does not alter the authors’ adherence to all the PLOS ONE policies on sharing data and materials. Otherwise all other authors have declared that no competing interests exist.

Figures

Figure 1
Figure 1. Pulmonary granulomatous diseases display similar transcriptional signatures that are distinct from pneumonia and lung cancer.
1446-transcripts were differentially expressed in the whole blood of the Training Set healthy controls, pulmonary TB patients, pulmonary sarcoidosis patients, pneumonia patients and lung cancer patients. The clustering of the 1446-transcripts were tested in an independent cohort from which they were not derived from, the Test Set. The heatmap shows the transcripts and Test Set patients’ profiles as organised by the unbiased algorithm of unsupervised hierarchical clustering. A dotted line is added to the heatmap to help visualisation of the main clusters generated by the clustering algorithm. Transcript intensity values are normalised to the median of all transcripts. Red transcripts are relatively over-abundant and blue transcripts under-abundant. The coloured bar at the bottom of the heatmap indicates to which group the profile belongs.
Figure 2
Figure 2. Three dominant clusters of the 1446 differentially expressed transcripts are associated with distinct biological pathways.
Each of the three dominant clusters of transcripts is associated with different study groups in the Training Set. The top transcript cluster is over-abundant in the pneumonia and cancer patients and significantly associated with IPA pathways relating to inflammation (Fisher’s exact with Benjamini Hochberg FDR = 0.05). The middle transcript cluster is over-abundant in the TB and sarcoidosis patients and significantly associated with IFN signalling and other immune response IPA pathways (Fisher’s exact with Benjamini Hochberg FDR = 0.05). The bottom transcript cluster is under-abundant in all the patients and significantly associated with T and B cell IPA pathways (Fisher’s exact Benjamini Hochberg FDR = 0.05).
Figure 3
Figure 3. Active sarcoidosis signatures are similar to TB but distinct from non-sarcoidosis which resembles healthy controls.
1396-transcripts are differentially expressed in the whole blood of the Training Set after applying the analysis across six groups to include the two phenotypes of sarcoidosis patients. (A) The 1396 transcripts and Training Set patients’ profiles are organised by unsupervised hierarchical clustering. A dotted line is added to the heatmap to clarify the main clusters generated by the clustering algorithm. Transcript intensity values are normalised to the median of all transcripts. (B) Molecular distance to health of the 1396 transcripts in the Training and Test sets demonstrates the quantification of transcriptional change relative to the controls. The mean, SEM and p-values are displayed (ANOVA with Tukey’s multiple comparison test).
Figure 4
Figure 4. Modular analysis shows similar pathways associated with TB and sarcoidosis, differing from pneumonia and cancer.
(A) Gene expression levels of all transcripts that were significantly detected compared to background hybridisation (15212 transcripts, p<0.01) were compared in the Training Set between each patient group: TB, active sarcoidosis, non-active sarcoidosis, pneumonia, lung cancer, to the healthy controls. Each module corresponds to a set of co-regulated genes that were assigned biological functions by unbiased literature profiling. A red dot indicates significant over-abundance of transcripts and a blue dot indicates significant under-abundance (p<0.05). The colour intensity correlates with the percentage of genes in that module that are significantly differentially expressed. The modular analysis can also be represented in graphical form as shown in (B)–(E), including both the Training and Test Set samples. The mean, SEM and p-values are displayed (ANOVA with Tukey’s multiple comparison test). (B) The percentage of genes significantly overexpressed in the 3 IFN modules for each disease. (C) The fold change of the expression of the genes present in the IFN modules compared to the controls. (D) The percentage of genes significantly overexpressed in the 5 inflammation modules for each disease. (E) The fold change of the expression of the genes present in the inflammation modules compared to the controls.
Figure 5
Figure 5. Comparison analysis of the diseases compared to matched controls reveals the four most significant pathways.
Differentially expressed genes were derived from the Training Set by comparing each disease to healthy controls matched for ethnicity and gender: TB = 2524, active sarcoidosis = 1391, pneumonia = 2801 and lung cancer = 1626 transcripts (≥1.5 fold change from the mean of the controls, Mann Whitney with Benjamini Hochberg FDR = 0.01). (A) IPA canonical pathways was used to determined the most significant pathways (i-iv) associated with each disease relative to the other diseases (Fisher’s exact with Benjamini Hochberg FDR = 0.05). The bottom x-axis and bars of each graph indicates the log (p-value) and the top x-axis and line indicates the percentage of genes present in the pathway. The genes in the EIF2 signalling pathway are predominately under-abundant genes however the genes in the other three pathways are predominantly over-abundant relative to the controls. Pathways above the blue dotted line are significant (p<0.05). (B) The IFN signalling IPA pathway is overlaid onto each disease group. Coloured genes are differentially expressed in that disease group compared to their matched controls (Fisher’s exact FDR = 0.05). Red genes represent over-abundance and green under-abundance. The pathway for TB is shown enlarged so the detail of the genes can be seen, it is also shown again in a much smaller scale besides the other diseases so that a visual comparison can be more easily made.
Figure 6
Figure 6. Unlike TB and pneumonia, successful treatment of sarcoidosis was associated with increased transcriptional activity.
(A) Modular analysis. Gene expression levels of all transcripts that were significantly detected compared to background hybridisation in at least 10% of samples (p<0.01) were compared between the healthy controls and each of the following the patient groups: pre-treatment pneumonia, post-treatment pneumonia patients and pre-treatment sarcoidosis, inadequate treatment response sarcoidosis and good-treatment response sarcoidosis patients. A red dot indicates significant over-abundance of transcripts and a blue dot indicates under-abundance (p<0.05). The colour intensity correlates to the percentage of genes in that module that are significantly differentially expressed. MDTH demonstrates the quantification of transcriptional change after treatment in the 1446-transcripts relative to controls. The mean, SEM and p-values are displayed (ANOVA with Tukey’s multiple comparison test). (B) Pneumonia patients. (D) Sarcoidosis patients. (C) TB patients from the Bloom et al study carried out in South Africa, the controls in this study were participants with latent TB.
Figure 7
Figure 7. IFN-inducible gene expression is most abundant in the neutrophils in both TB and sarcoidosis.
The expression of IFN-inducible genes were measured in purified leucocyte populations from whole blood. (A) Heatmap shows the expression of IFN-inducible transcripts, from the Berry et al 2010 study, for each disease group normalised to the controls for that cell type. (B) The mean expression fold change in the TB samples of the same IFN-inducible transcripts. (C) The mean expression fold change in the sarcoidosis samples of the same IFN-inducible transcripts. (D) The mean expression fold change in the TB samples of all the genes present in the three IFN modules compared to the controls. (E) The mean expression fold change in the sarcoidosis samples of all the genes present in the three IFN modules compared to the controls. Graphs show mean and SEM.

References

    1. WHO (2010) Global tuberculosis control. World Health Organisation.
    1. Newman LS, Rose CS, Bresnitz EA, Rossman MD, Barnard J, et al. (2004) A case control etiologic study of sarcoidosis: environmental and occupational risk factors. Am J Respir Crit Care Med 170: 1324–1330. - PubMed
    1. Pascual V, Chaussabel D, Banchereau J (2010) A genomic approach to human autoimmune diseases. Annu Rev Immunol 28: 535–571. - PMC - PubMed
    1. Berry MP, Graham CM, McNab FW, Xu Z, Bloch SA, et al. (2010) An interferon-inducible neutrophil-driven blood transcriptional signature in human tuberculosis. Nature 466: 973–977. - PMC - PubMed
    1. Cliff JM, Lee JS, Constantinou N, Cho JE, Clark TG, et al. (2012) Distinct Phases of Blood Gene Expression Pattern Through Tuberculosis Treatment Reflect Modulation of the Humoral Immune Response. J Infect Dis. - PubMed

Publication types

MeSH terms