. 2013 Aug 5;8(8):e72016.
doi: 10.1371/journal.pone.0072016. Print 2013.

Influence of pollen nutrition on honey bee health: do pollen quality and diversity matter?

Affiliations

Influence of pollen nutrition on honey bee health: do pollen quality and diversity matter?

Garance Di Pasquale et al. PLoS One. .

Abstract

Honey bee colonies are highly dependent upon the availability of floral resources from which they get the nutrients (notably pollen) necessary to their development and survival. However, foraging areas are currently affected by the intensification of agriculture and landscape alteration. Bees are therefore confronted to disparities in time and space of floral resource abundance, type and diversity, which might provide inadequate nutrition and endanger colonies. The beneficial influence of pollen availability on bee health is well-established but whether quality and diversity of pollen diets can modify bee health remains largely unknown. We therefore tested the influence of pollen diet quality (different monofloral pollens) and diversity (polyfloral pollen diet) on the physiology of young nurse bees, which have a distinct nutritional physiology (e.g. hypopharyngeal gland development and vitellogenin level), and on the tolerance to the microsporidian parasite Nosemaceranae by measuring bee survival and the activity of different enzymes potentially involved in bee health and defense response (glutathione-S-transferase (detoxification), phenoloxidase (immunity) and alkaline phosphatase (metabolism)). We found that both nurse bee physiology and the tolerance to the parasite were affected by pollen quality. Pollen diet diversity had no effect on the nurse bee physiology and the survival of healthy bees. However, when parasitized, bees fed with the polyfloral blend lived longer than bees fed with monofloral pollens, excepted for the protein-richest monofloral pollen. Furthermore, the survival was positively correlated to alkaline phosphatase activity in healthy bees and to phenoloxydase activities in infected bees. Our results support the idea that both the quality and diversity (in a specific context) of pollen can shape bee physiology and might help to better understand the influence of agriculture and land-use intensification on bee nutrition and health.


Conflict of interest statement

Competing Interests: The authors have declared that no competing interests exist.

Figures

Figure 1
Figure 1. Effects of pollen quality and diversity on nurse physiology.
(A) Size of hypopharyngeal gland acini, (B) vitellogenin and (C) tansferrin expression levels. Box plots are shown for 5 and 10 bees/replicate for the glands and each gene, respectively (n = 14 replicates giving 70 and 140 bees/pollen diet for the glands and each gene, respectively). Different letters indicate significant differences between pollen diets (p < 0.05, Kruskal-Wallis and Dunn’s multiple comparison tests). Boxes show 1st and 3rd interquartile range with line denoting median. Whiskers encompass 90% of the individuals, beyond which each outliers are represented by circles.
Figure 2
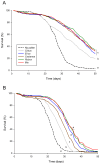
Figure 2. Effects of pollen diet and Nosema ceranae infection on bee survival.
Data show the percentage of survival over 50 days for (A) non-parasitized and (B) Nosema-parasitized bees (9 replicates/pollen diet). Different letters denote significant differences between pollen diets in non-parasitized or Nosema-parasitized bees (p < 0.05, Cox proportional hazards regression model).
Figure 3
Figure 3. Effects of pollen diet and Nosema ceranae infection on glutathione S-transferase.
The enzyme activity was assessed in (A) the guts and (B) the heads of bees. Box plots are shown for 3 pools of 3 bees/replicate (n = 9 replicates giving 81 bees total/pollen diet). Different letters denote significant differences between pollen diets in non-parasitized (white box plots) or Nosema-parasitized bees (grey box plots) (p < 0.05, Kruskal-Wallis and Dunn’s multiple comparison tests) and * indicate significant differences between parasitized and non-parasitized bees for each pollen diet (p < 0.05, Mann-Whitney U tests). Boxes show 1st and 3rd interquartile range with line denoting median. Whiskers encompass 90% of the individuals, beyond which each outliers are represented by circles.
Figure 4
Figure 4. Effect of pollen diet and Nosema ceranae infection on gut alkaline phosphatase.
Box plots are shown for 3 pools of 3 bees/replicate (n = 9 replicates giving 81 bees total/pollen diet). Different letters denote significant differences between pollen diets in non-parasitized (white box plots) or Nosema-parasitized bees (grey box plots) (p < 0.05, Kruskal-Wallis and Dunn’s multiple comparison tests) and * indicate significant differences between parasitized and non-parasitized bees for each pollen diet (p < 0.05, Mann-Whitney U tests). Boxes show 1st and 3rd interquartile range with line denoting median. Whiskers encompass 90% of the individuals, beyond which each outliers are represented by circles.
Figure 5
Figure 5. Effect of pollen diet and Nosema ceranae infection on phenoloxidase.
Box plots are shown for 3 pools of 3 bees/replicate (n = 9 replicates giving 81 bees total/pollen diet). Different letters denote significant differences between pollen diets in non-parasitized (white box plots) or Nosema-parasitized bees (grey box plots) (p < 0.05, Kruskal-Wallis and Dunn’s multiple comparison tests) and * indicate significant differences between parasitized and non-parasitized bees for each pollen diet (p < 0.05, Mann-Whitney U tests). Boxes show 1st and 3rd interquartile range with line denoting median. Whiskers encompass 90% of the individuals, beyond which each outliers are represented by circles.
Figure 6
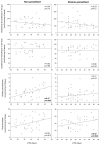
Figure 6. Correlations between LT50 and enzyme activities in non- and Nosema-parasitized bees.
r and p-values are shown. LT50: day on which 50% of the bees had died in each cage.

References

    1. Klein AM, Vaissière BE, Cane JH, Steffan-Dewenter I, Cunningham SA et al. (2007) Importance of pollinators in changing landscapes for world crops. Proc R Soc Lond B 274: 303-313. doi:10.1098/rspb.2006.3721. PubMed: 17164193. - DOI - PMC - PubMed
    1. Gallai N, Salles JM, Settele J, Vaissiere BE (2009) Economic valuation of the vulnerability of world agriculture confronted with pollinator decline. Ecol Econ 68: 810-821. doi:10.1016/j.ecolecon.2008.06.014. - DOI
    1. Morse RA (1991) Honeybees forever. Trends Ecol Evol 6: 337-338. doi:10.1016/0169-5347(91)90043-W. PubMed: 21232501. - DOI - PubMed
    1. Brodschneider R, Crailsheim K (2010) Nutrition and health in honey bees. Apidologie 41: 278-294. doi:10.1051/apido/2010012. - DOI
    1. Keller I, Fluri P, Imdorf A (2005) Pollen nutrition and colony development in honey bees, Part II. Bee World 86: 27-34.

Publication types