. 2014 Jan;20(1-2):115-29.
doi: 10.1089/ten.TEA.2012.0762. Epub 2013 Oct 2.

Balancing the rates of new bone formation and polymer degradation enhances healing of weight-bearing allograft/polyurethane composites in rabbit femoral defects

Affiliations

Balancing the rates of new bone formation and polymer degradation enhances healing of weight-bearing allograft/polyurethane composites in rabbit femoral defects

Jerald E Dumas et al. Tissue Eng Part A. 2014 Jan.

Abstract

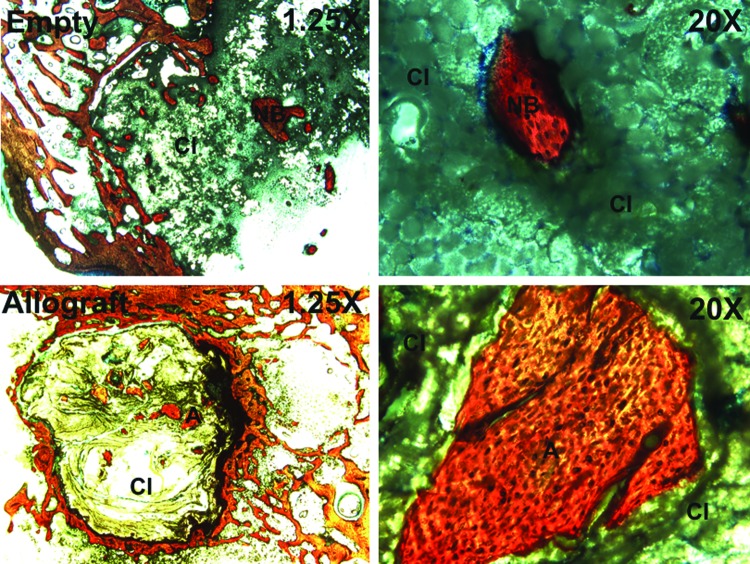
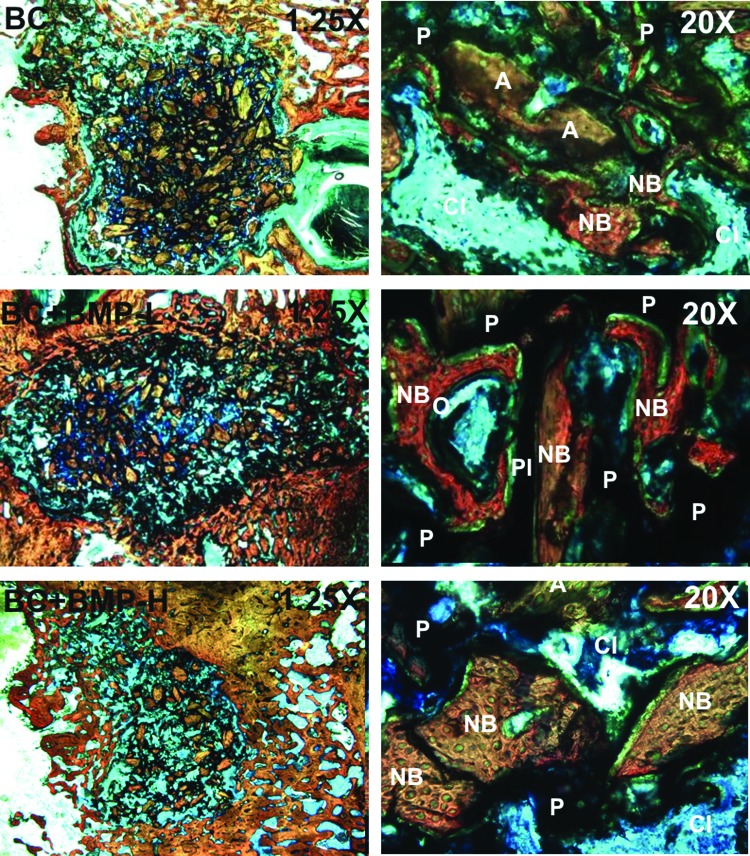
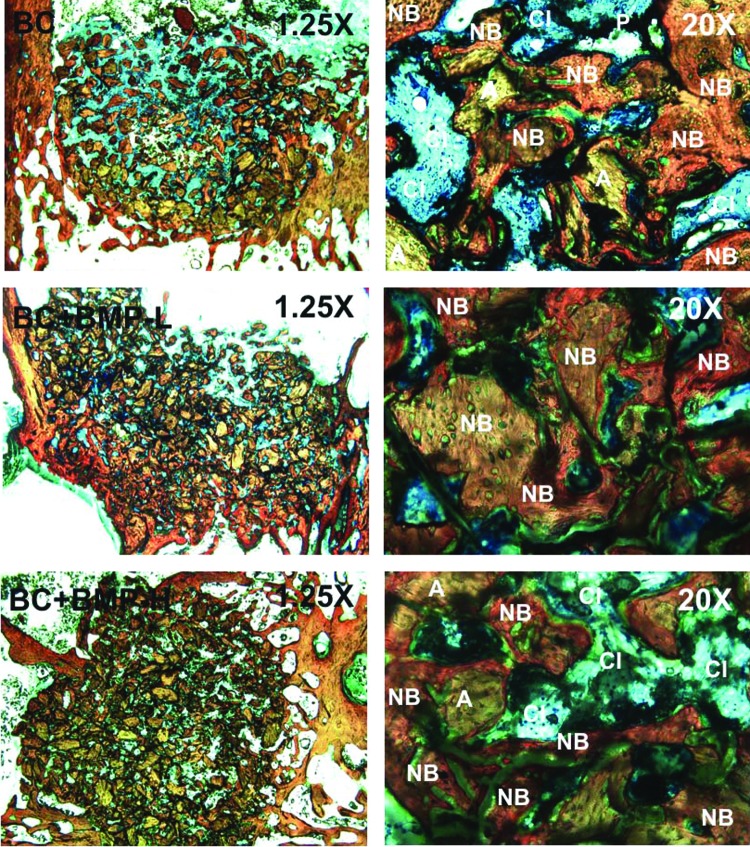
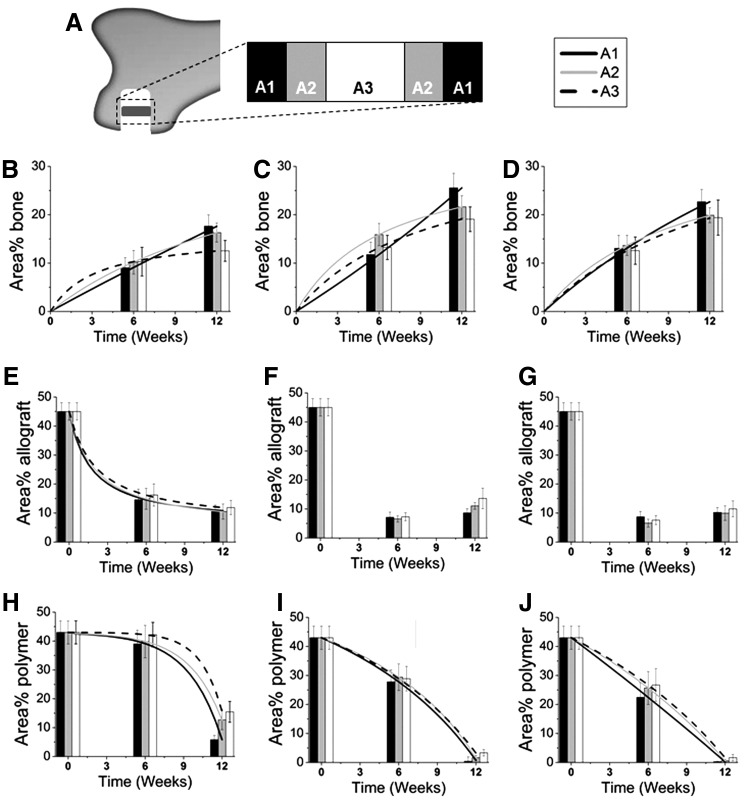
There is a compelling clinical need for bone grafts with initial bone-like mechanical properties that actively remodel for repair of weight-bearing bone defects, such as fractures of the tibial plateau and vertebrae. However, there is a paucity of studies investigating remodeling of weight-bearing bone grafts in preclinical models, and consequently there is limited understanding of the mechanisms by which these grafts remodel in vivo. In this study, we investigated the effects of the rates of new bone formation, matrix resorption, and polymer degradation on healing of settable weight-bearing polyurethane/allograft composites in a rabbit femoral condyle defect model. The grafts induced progressive healing in vivo, as evidenced by an increase in new bone formation, as well as a decrease in residual allograft and polymer from 6 to 12 weeks. However, the mismatch between the rates of autocatalytic polymer degradation and zero-order (independent of time) new bone formation resulted in incomplete healing in the interior of the composite. Augmentation of the grafts with recombinant human bone morphogenetic protein-2 not only increased the rate of new bone formation, but also altered the degradation mechanism of the polymer to approximate a zero-order process. The consequent matching of the rates of new bone formation and polymer degradation resulted in more extensive healing at later time points in all regions of the graft. These observations underscore the importance of balancing the rates of new bone formation and degradation to promote healing of settable weight-bearing bone grafts that maintain bone-like strength, while actively remodeling.


Figures

<b>FIG. 1.</b>
FIG. 1.
Rheological properties of the biocomposite (BC) measured by rheometry. (A) G′ represents the storage modulus and G″ the loss modulus. The G′–G″ crossover point is assumed to be the working time of the BC. (B) Viscosity versus shear rate plot illustrating calculation of the yield stress using the Herschel–Bulkley model.
<b>FIG. 2.</b>
FIG. 2.
Representative stress–strain curves for the BCs and calcium phosphate cement. (A) Compression. (B) Torsion; BMP, bone morphogenetic protein.
<b>FIG. 3.</b>
FIG. 3.
Representative micro-computed tomography (μCT) images of the empty defects and defects filled with the allograft bone particles, BC, BC+BMP-L, and BC+BMP-H at 6 and 12 weeks. Presented in (A) longitudinal sections of the femur and (B) as three-dimensional reconstructions of the cylindrical defect region of interest. BMP, bone morphogenetic protein.
<b>FIG. 4.</b>
FIG. 4.
Radial distribution of morphometric parameters measured by μCT at 6 and 12 weeks. Values of each parameter are compared to those measured for host trabecular bone (dotted line) and the BC controls (0 weeks, dashed line). (A) Representative image highlighting subdivision of the defect into four annular shells each 1-mm thick. Morphometric parameters are plotted versus the mean radial distance Rm [Rm=(Ro+Ri)/2] of each annular region from the center of the defect. Solid lines delimit regions inside the material, while the dashed line delimits the region near the host bone-composite interface. (B) Tissue mineral density (TMD). (C) Bone volume/total volume (BV/TV) at 6 weeks. (D) BV/TV at 12 weeks. (E) Connectivity density (Conn.D.). (F) Trabecular number (Tb.N.). (G) Trabecular thickness (Tb.Th.). (H) Trabecular separation (Tb.Sp).
<b>FIG. 5.</b>
FIG. 5.
Low- (1.25×) and high- (20×) magnification images of histological sections of untreated (empty, top) and allograft-filled defects (bottom) at 6 weeks. CI: cellular infiltration, NB: new bone, A: allograft. Color images available online at www.liebertpub.com/tea
<b>FIG. 6.</b>
FIG. 6.
Low- (1.25×) and high- (20×) magnification images of histological sections of the BC (top), BC+BMP-L (middle), and BC+BMP-H (bottom) treated defects at 6 and 12 weeks. P, residual polymer; O, osteoid. Color images available online at www.liebertpub.com/tea
<b>FIG. 6.</b>
FIG. 6.
Low- (1.25×) and high- (20×) magnification images of histological sections of the BC (top), BC+BMP-L (middle), and BC+BMP-H (bottom) treated defects at 6 and 12 weeks. P, residual polymer; O, osteoid. Color images available online at www.liebertpub.com/tea
<b>FIG. 7.</b>
FIG. 7.
Histomorphometric evaluation of new bone formation. (A) Diagram showing the areas of interest. (B–D) Area% new bone measured for (B) BC, (C) BC+BMP-L, (D) BC+BMP-H groups. Data were fit to the function Area% new bone=at/(1+bt) (line). (E–G) Area% residual allograft measured for (E) BC, (F) BC+BMP-L, (G) BC+BMP-H groups. Data for BC were fit to the function Area% allograft=AA,iat/(1+bt) (line), where AA,i is the initial area% allograft. (H–J) Area% residual polymer measured for (H) BC, (I) BC+BMP-L, (J) BC+BMP-H groups. Data for BC were fit to the function Area% polymer=AP,i−αexp(βt) (line). Data for the BC+BMP groups were fit to the function Area% allograft=AP,iat/(1+bt) (line).
<b>FIG. 8.</b>
FIG. 8.
Analysis of histomorphometric data. The ratio of the rate of new bone formation (rB) to that of polymer degradation (rP) was calculated for each group by differentiating the equations expressing area% new bone and area% polymer as a function of time. Representative images of histological sections with highlighted areas of interest are also shown. (A, B) BC, (C, D) BC+BMP-L, and (E, F) BC+BMP-H. Color images available online at www.liebertpub.com/tea

References

    1. Anderson D.D., Van Hofwegen C., Marsh J.L., and Brown T.D.Is elevated contact stress predictive of post-traumatic osteoarthritis for imprecisely reduced tibial plafond fractures? J Orthop Res 29, 33, 2011. Epub 2010/07/08. - PMC - PubMed
    1. Russell T.A., and Leighton R.K.Comparison of autogenous bone graft and endothermic calcium phosphate cement for defect augmentation in tibial plateau fractures. A multicenter, prospective, randomized study. J Bone Joint Surg Am 90, 2057, 2008. Epub 2008/10/03. - PubMed
    1. Simpson D., and Keating J.F.Outcome of tibial plateau fractures managed with calcium phosphate cement. Injury 35, 913, 2004. Epub 2004/08/11. - PubMed
    1. Hall J.A., Beuerlein M.J., and McKee M.D.Open reduction and internal fixation compared with circular fixator application for bicondylar tibial plateau fractures. Surgical technique. J Bone Joint Surg Am 91 Suppl 2 (Pt 1), 74, 2009. Epub 2009/03/11. - PubMed
    1. Schwartz Z., Goldstein M., Raviv E., Hirsch A., Ranly D.M., and Boyan B.D.Clinical evaluation of demineralized bone allograft in a hyaluronic acid carrier for sinus lift augmentation in humans: a computed tomography and histomorphometric study. Clin Oral Implants Res 18, 204, 2007. Epub 2007/03/14. - PubMed

Publication types

Substances