. 2013 Sep 11;32(18):2477-90.
doi: 10.1038/emboj.2013.183. Epub 2013 Aug 13.

Toll-like receptor-mediated IRE1α activation as a therapeutic target for inflammatory arthritis

Affiliations

Toll-like receptor-mediated IRE1α activation as a therapeutic target for inflammatory arthritis

Quan Qiu et al. EMBO J. .

Abstract

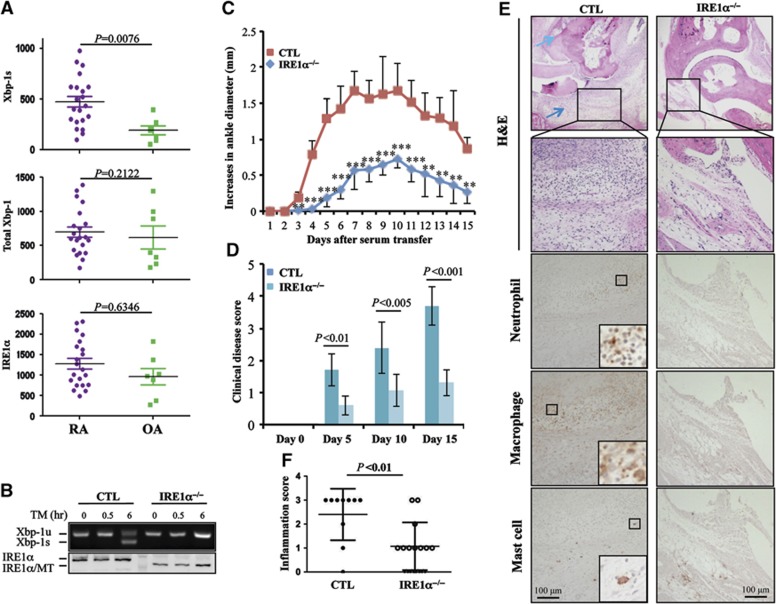
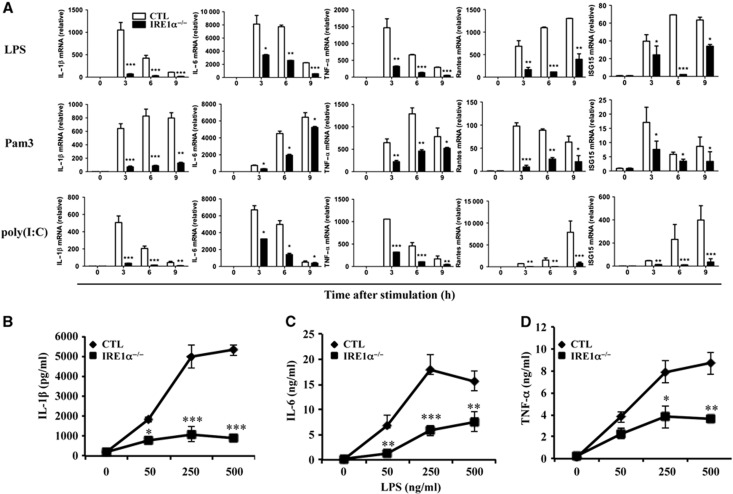
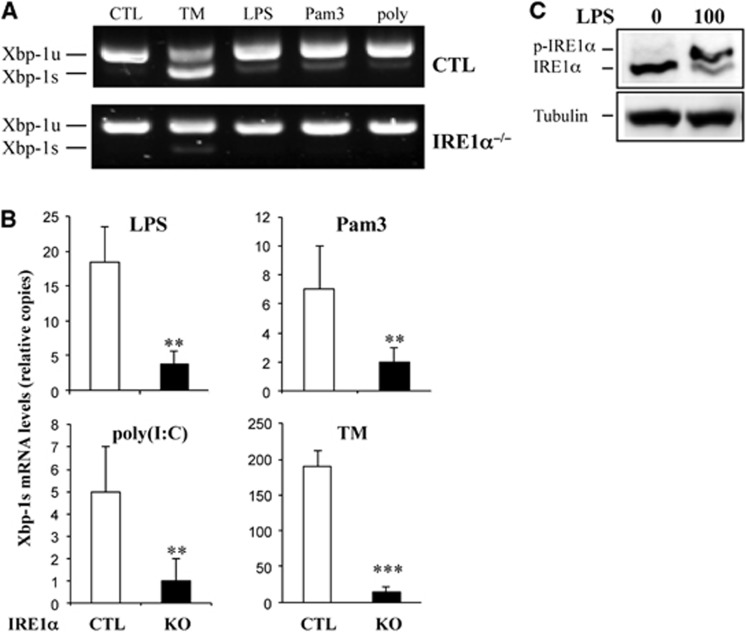
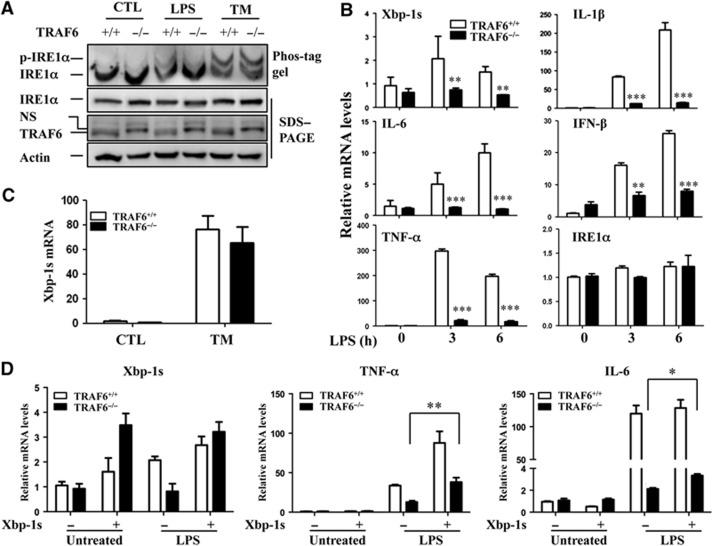
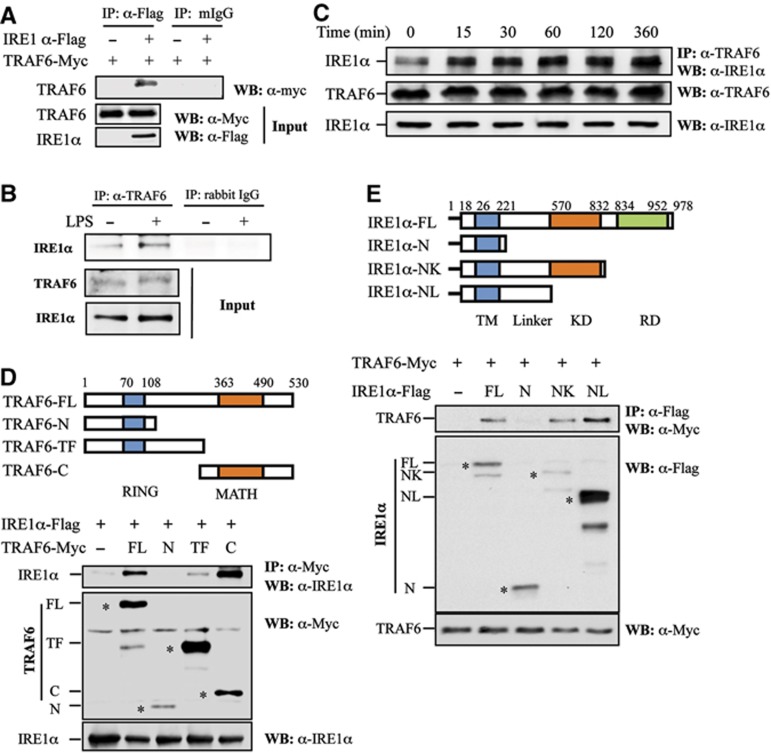
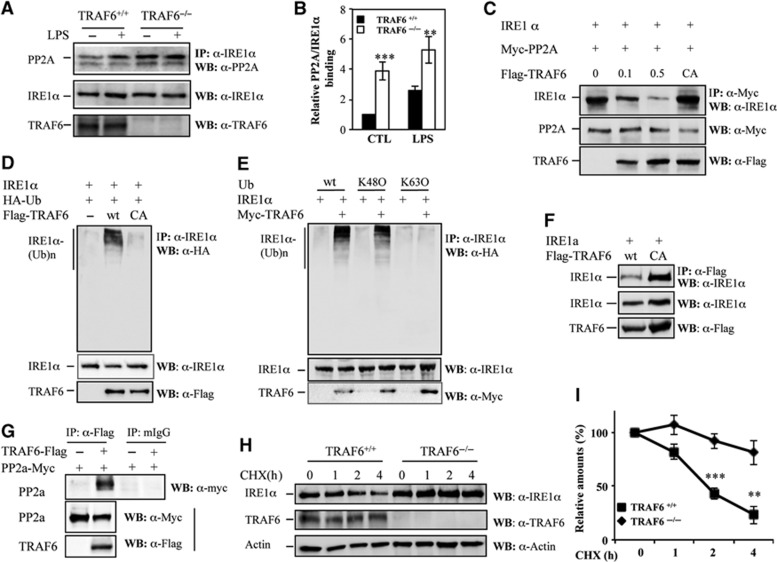
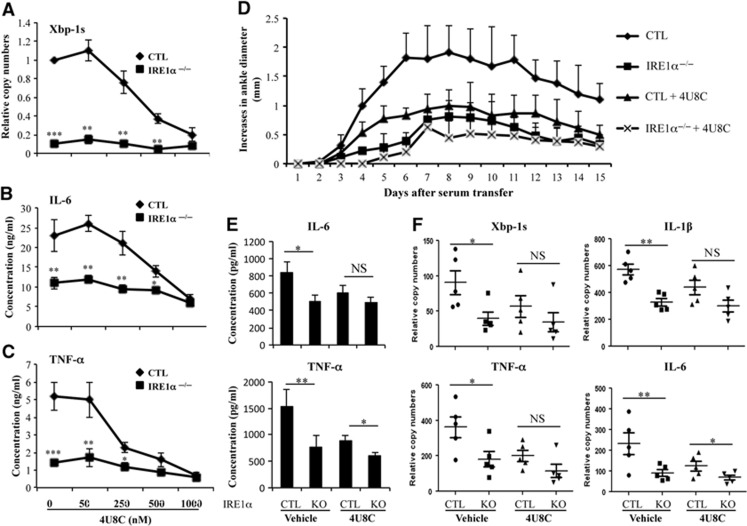
In rheumatoid arthritis (RA), macrophage is one of the major sources of inflammatory mediators. Macrophages produce inflammatory cytokines through toll-like receptor (TLR)-mediated signalling during RA. Herein, we studied macrophages from the synovial fluid of RA patients and observed a significant increase in activation of inositol-requiring enzyme 1α (IRE1α), a primary unfolded protein response (UPR) transducer. Myeloid-specific deletion of the IRE1α gene protected mice from inflammatory arthritis, and treatment with the IRE1α-specific inhibitor 4U8C attenuated joint inflammation in mice. IRE1α was required for optimal production of pro-inflammatory cytokines as evidenced by impaired TLR-induced cytokine production in IRE1α-null macrophages and neutrophils. Further analyses demonstrated that tumour necrosis factor (TNF) receptor-associated factor 6 (TRAF6) plays a key role in TLR-mediated IRE1α activation by catalysing IRE1α ubiquitination and blocking the recruitment of protein phosphatase 2A (PP2A), a phosphatase that inhibits IRE1α phosphorylation. In summary, we discovered a novel regulatory axis through TRAF6-mediated IRE1α ubiquitination in regulating TLR-induced IRE1α activation in pro-inflammatory cytokine production, and demonstrated that IRE1α is a potential therapeutic target for inflammatory arthritis.


Conflict of interest statement

The authors declare that they have no conflict of interest.

Figures

Figure 1
Figure 1
IRE1α activation promotes inflammatory arthritis in humans and mice. (A) Analysis of IRE1α activation in macrophages from patients with RA. Synovial fluids from patients with RA (N=21) or OA (N=7) were cultured in 6-well plates for 2 h. Total RNA from the adherent cells was extracted. The levels of spliced XBP-1 (XBP-1s), total XBP-1, and IRE1α mRNA were determined by quantitative real-time RT–PCR using β-actin as an internal control. Student’s t-test was used for the statistical analysis, and P-values are indicated. (B) Bone marrow-derived macrophages from control and IRE1α conditional knockout mice were stimulated with TM (5 g/ml) for different time intervals. The expression levels of IRE1α protein were determined by western blotting (bottom panel). The mRNA levels of unspliced XBP-1 and spliced XBP-1 were determined by semi-quantitative RT–PCR. (CF) Control (CTL, N=5) and IRE1αflox/floxLysM-Cre+ (IRE1α−/−, N=8) mice were treated with serum from K/BxN mice by intraperitoneal injection (200 μl/mouse). The diameter of the ankle joints was measured daily. (C) The increases in the ankle joint diameters in millimeters and (D) the disease scores (described in Materials and methods) are shown. (E, F) Mice were euthanized at day 15 after anti-GPI treatment, tissue sections of the ankle joints were analysed by H&E staining, and the representative images are shown (top two panels). The light blue arrow indicates cartilage erosion and dark blue arrow shows the immune cell infiltration. The infiltration of neutrophils (third panel), macrophages (fourth panel), and mast cells (bottom panel) was characterized by IHC staining as described in Materials and methods (E). The inflammation of joint sections was scored (F). Student’s t-test was used for the statistical analysis. **P<0.01, ***P<0.005; error bars represent standard deviation (s.d.). Source data for this figure is available on the online supplementary information page.
Figure 2
Figure 2
Loss of IRE1α function impairs inflammatory cytokine production by macrophages. Bone marrow cells from wild-type control and IRE1αf/fLysM-Cre+ mice were isolated and cultured for 6 days following a standard protocol for bone marrow-derived macrophage polarization. (A) Cells were stimulated with or without LPS (100 ng/ml, top panels), Pam3 (100 ng/ml, middle panels), or poly(I:C) (10 g/ml, bottom panels) for 0, 3, 6, or 9 h. Total RNA was extracted from the stimulated cells. The mRNA levels (relative to β-actin) of IL-6, IL-1β, TNF-α, RANTES, and ISG15 were determined by quantitative real-time RT–PCR. Relative fold changes of the mRNA levels were calculated after normalization to the mRNA levels in the wild-type and mutant bone marrow-derived macrophages without stimulation. (BD) Macrophages were stimulated with different doses of LPS for 24 h. The levels of IL-1β (B), IL-6 (C), and TNF-α (D) were analysed by ELISA. Error bars represent data from three independent experiments. Student’s t-test was used for the statistical analysis. *P<0.05, **P<0.01, ***P<0.005; error bars represent standard deviation (s.d.).
Figure 3
Figure 3
TLR signalling-induced XBP-1 mRNA splicing requires IRE1α. (A, B) Control (CTL) and IRE1α-knockout bone marrow-derived macrophages were stimulated with tunicamycin (5 g/ml) or LPS (100 ng/ml), Pam3 (100 ng/ml), or poly(I:C) (10 g/ml) for 6 h. Total RNA was isolated from these stimulated cells, and the levels of XBP-1 mRNA (unspliced: XBP-1u, spliced: XBP-1s) were analysed by semi-quantitative RT–PCR (A) and quantitative real-time RT–PCR (B). (C) RAW264.7 cells were stimulated with LPS (100 ng/ml) for 16 h before IRE1α activation was analysed using the phos-tag gel approach. Student’s t-test was used for the statistical analysis. **P<0.01, ***P<0.005; error bars represent standard deviation (SD). Source data for this figure is available on the online supplementary information page.
Figure 4
Figure 4
TRAF6 is required for TLR-induced IRE1α activation. (A) TRAF6+/+ and TRAF6−/− MEFs were stimulated with LPS (100 ng/ml) or tunicamycin (TM, 5 g/ml) for 16 h. IRE1α phosphorylation was determined by pho-tag gel (top panel). The parallel-prepared samples were subjected to SDS–PAGE and western blot analysis for IRE1α (second panel), TRAF6 (third panel), and β-actin (bottom panel). (B) Total RNA from LPS-treated MEFs was purified, and the levels of XBP-1s, IL-1β, IL-6, and IFN-β were analysed by quantitative real-time RT–PCR. Error bars represent data from a triplicate analysis (mean+s.d.), and representative results from three independent experiments are shown. (C) TRAF6+/+ and TRAF6−/− MEFs were stimulated with tunicamycin (5 g/ml) for 6 h. Levels of spliced XBP-1 mRNA were determined by quantitative real-time RT–PCR. (D) Wild-type and TRAF6-null MEFs were infected with adenovirus expressing spliced XBP-1 protein. Two days after infection, cells were stimulated with or without LPS for an additional 6 h. The levels of XBP-1s, TNF-α, and IL-6 mRNAs were characterized by quantitative real-time RT–PCR. Student’s t-test was used for the statistical analysis. *P<0.05, **P<0.01, ***P<0.005; error bars represent standard deviation (s.d.). Source data for this figure is available on the online supplementary information page.
Figure 5
Figure 5
TRAF6 interacts with IRE1α. (A) Flag-tagged IRE1α and Myc-tagged TRAF6 plasmids were co-transfected into HEK293 cells. IRE1α protein in the lysates of transfected cells was immunoprecipitated with an anti-Flag antibody or with normal mouse IgG (mIgG) as a control. The bound TRAF6 was determined by western blotting using an anti-Myc antibody (top panel). The expression levels of TRAF6 and IRE1α in whole cell lysates were confirmed by western blot analysis using anti-Myc (middle panel) and anti-Flag (bottom panel) antibodies, respectively. (B) Mouse primary macrophages derived from bone marrow cells were stimulated with or without LPS (1 g/ml) for 16 h. The interaction between TRAF6 and IRE1α was analysed by western blotting. (C) The interaction between TRAF6 and IRE1α in RAW cells stimulated with LPS (1 g/ml) under a time course was determined by co-immunoprecipitation and western blot analysis. (D) Schematic representation of TRAF6 and its truncated mutants. TRAF6 carries an N-terminal RING finger domain and a C-terminal MATH domain (top panel). FL: full-length structure, N: N-terminal RING finger domain, TF: trans-membrane domain, C: C-terminal MATH domain. IRE1α was co-transfected with TRAF6 or its mutants into HEK293 cells. The interactions between IRE1 and TRAF6 or its mutants were determined as described in (A). The expression of the full-length and truncated TRAF6 protein was indicated by the symbol ‘*’. (E) Schematic representation of IRE1α and its truncated mutants. IRE1α contains an N-terminal trans-membrane (TM) domain, kinase domain (KD), and a C-terminal RNase domain (RD) (top panel). FL: full length, N: N-terminal trans-membrane domain, NK: N-terminus and the kinase domain, NL: N-terminal linker domain. TRAF6 was co-transfected with IRE1α or its mutants into HEK293 cells. The interactions between TRAF6 and IRE1α or its mutants were determined as described in (A). The expression of the full-length and truncated IRE1α protein was indicated by the symbol ‘*’. Source data for this figure is available on the online supplementary information page.
Figure 6
Figure 6
TRAF6 catalyses IRE1α ubiquitination to suppress IRE1α interaction with PP2A. (A) TRAF6+/+ and TRAF6−/− MEFs were treated with 500 ng/ml LPS for 30 min. The interaction between IRE1α and PP2A was determined by co-immunoprecipitation using an anti-IRE1α antibody and western blotting using an anti-PP2A antibody (top panel). The expression levels of IRE1α (middle panel) and TRAF6 (bottom panel) were determined by western blot analysis. (B) The intensities of IRE1α bands that interacted with PP2A were quantified. The relative band intensities are shown. (C) HEK293 cells were transfected with IRE1α (1 g), Myc-PP2A (1 g), and different amounts of Flag-TRAF6 (0, 0.1, and 0.5 g) or its CA mutant (1 g) plasmids. The interaction between IRE1α and PP2A was determined by co-immunoprecipitation and western blot analysis as described in (A). (D) IRE1α, TRAF6, and HA-Ubiquitin expression plasmids were co-transfected into HEK293 cells as indicated. IRE1α ubiquitination was determined by immunoprecipitation using the anti-IRE1α antibody and western blotting using the anti-HA antibody (top panel). The expression level of IRE1α and TRAF6 in whole cell lysates was confirmed (middle and bottom panels). (E) Expression plasmids of IRE1α, TRAF6, and each HA-ubiquitin were co-transfected into HEK293 cells. IRE1α ubiquitination was examined as described in (D). (F) The interactions between IRE1α and TRAF6 or its C70A mutant were determined by co-immunoprecipitation and western blot analysis. (G) Flag-tagged TRAF6 and Myc-tagged PP2a plasmids were co-transfected into HEK293 cells. TRAF6 protein in the lysates of transfected cells was immunoprecipitated with anti-Flag antibody or normal mouse IgG as a control; the bound PP2a was determined by western blotting with anti-Myc Abs (top panel). The expression levels of PP2a and TRAF6 in whole cell lysates were confirmed by western blotting with anti-Myc antibody (middle panel) and anti-Flag antibody (bottom panel), respectively. (H) TRAF6+/+ and TRAF6−/− MEFs were treated with 100 μg/ml cycloheximide (CHX) for the indicated time intervals. The protein levels of IRE1α (top panel) and β-actin (bottom panel) in the lysates of treated cells were examined by western blot analysis. (I) The band densities of western blot analysis were quantified, and the relative levels were calculated. Error bars represent data from three independent experiments (mean±s.d.), **P<0.01, ***P<0.005. Source data for this figure is available on the online supplementary information page.
Figure 7
Figure 7
IRE1α inhibitor suppresses inflammatory cytokine production and protects mice from inflammatory arthritis. (A) Bone marrow-derived macrophages were stimulated with 200 ng/ml LPS in the presence of the IRE1α inhibitor 4U8C (concentrations 0–1000, nM) for 24 h. Total RNA from the stimulated cells was isolated, and the levels of spliced XBP-1 mRNA were analysed by quantitative real-time RT–PCR. (B, C) The levels of IL-6 (B) and TNF-α (C) in the supernatants of stimulated cells in (A) were determined by ELISA. Error bars represent data from three independent experiments (mean+s.d.). (D) Inflammatory arthritis was induced in IRE1α−/− and control (CTL) mice by intraperitoneal injection of 200 μl K/BxN serum at day 0. Mice were treated daily with 4U8C at 10 mg/kg/day from day 1. The diameters of their ankle joints were measured daily. Error bars represent data from five mice per group (mean+s.d.). (E) Sera from mice in (D) were collected at day 15. The levels of IL-6 (top panel) and TNF-α (bottom panel) were examined by ELISA. (F) The mice in (D) were euthanized, their ankle joints were collected and homogenized, and total RNA was isolated. The levels of XBP-1s, IL-1β, IL-6, and TNF-α mRNAs were determined by quantitative real-time RT–PCR. Student’s t-test was used for the statistical analysis. *P<0.05, **P<0.01, ***P<0.005. NS, non-significant; error bars represent the standard deviation (s.d.).

References

    1. Asea A, Rehli M, Kabingu E, Boch JA, Bare O, Auron PE, Stevenson MA, Calderwood SK (2002) Novel signal transduction pathway utilized by extracellular HSP70: role of toll-like receptor (TLR) 2 and TLR4. J Biol Chem 277: 15028–15034 - PubMed
    1. Brenner DA, O'Hara M, Angel P, Chojkier M, Karin M (1989) Prolonged activation of jun and collagenase genes by tumour necrosis factor-alpha. Nature 337: 661–663 - PubMed
    1. Bruhns P, Samuelsson A, Pollard JW, Ravetch JV (2003) Colony-stimulating factor-1-dependent macrophages are responsible for IVIG protection in antibody-induced autoimmune disease. Immunity 18: 573–581 - PubMed
    1. Calfon M, Zeng H, Urano F, Till JH, Hubbard SR, Harding HP, Clark SG, Ron D (2002) IRE1 couples endoplasmic reticulum load to secretory capacity by processing the XBP-1 mRNA. Nature 415: 92–96 - PubMed
    1. Cao W, Manicassamy S, Tang H, Kasturi SP, Pirani A, Murthy N, Pulendran B (2008) Toll-like receptor-mediated induction of type I interferon in plasmacytoid dendritic cells requires the rapamycin-sensitive PI(3)K-mTOR-p70S6K pathway. Nat Immunol 9: 1157–1164 - PMC - PubMed

Publication types

MeSH terms