

The complementary roles of dynamic contrast-enhanced MRI and 18F-fluorodeoxyglucose PET/CT for imaging of carotid atherosclerosis
- PMID: 23942908
- PMCID: PMC3823642
- DOI: 10.1007/s00259-013-2518-4
The complementary roles of dynamic contrast-enhanced MRI and 18F-fluorodeoxyglucose PET/CT for imaging of carotid atherosclerosis
Abstract
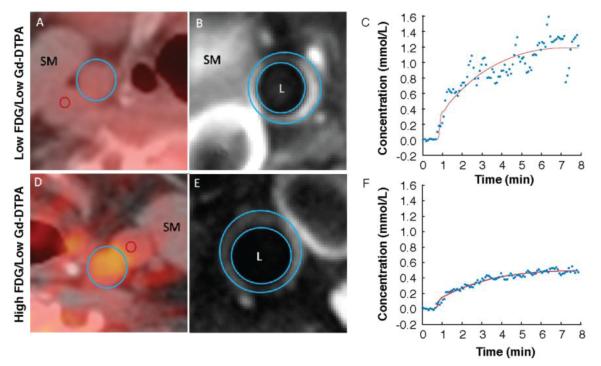
Purpose: Inflammation and neovascularization in vulnerable atherosclerotic plaques are key features for severe clinical events. Dynamic contrast-enhanced (DCE) MRI and FDG PET are two noninvasive imaging techniques capable of quantifying plaque neovascularization and inflammatory infiltrate, respectively. However, their mutual role in defining plaque vulnerability and their possible overlap has not been thoroughly investigated. We studied the relationship between DCE-MRI and (18)F-FDG PET data from the carotid arteries of 40 subjects with coronary heart disease (CHD) or CHD risk equivalent, as a substudy of the dal-PLAQUE trial (NCT00655473).
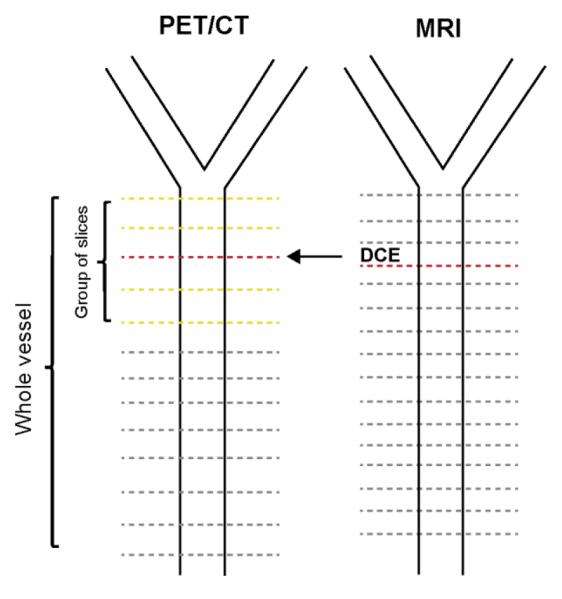
Methods: The dal-PLAQUE trial was a multicenter study that evaluated dalcetrapib, a cholesteryl ester transfer protein modulator. Subjects underwent anatomical MRI, DCE-MRI and (18)F-FDG PET. Only baseline imaging and biomarker data (before randomization) from dal-PLAQUE were used as part of this substudy. Our primary goal was to evaluate the relationship between DCE-MRI and (18)F-FDG PET data. As secondary endpoints, we evaluated the relationship between (a) PET data and whole-vessel anatomical MRI data, and (b) DCE-MRI and matching anatomical MRI data. All correlations were estimated using a mixed linear model.
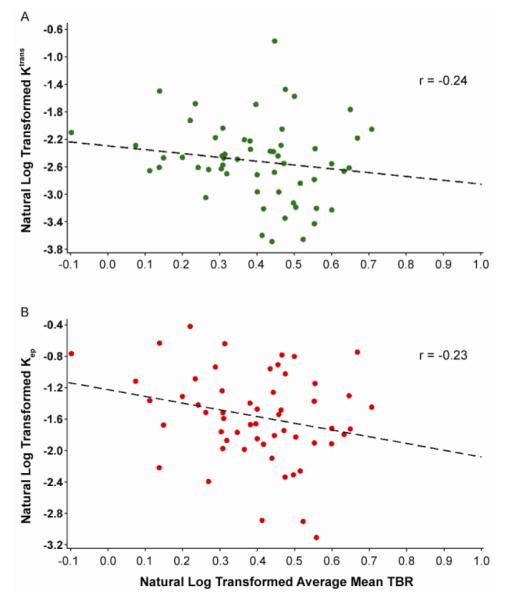
Results: We found a significant inverse relationship between several perfusion indices by DCE-MRI and (18)F-FDG uptake by PET. Regarding our secondary endpoints, there was a significant relationship between plaque burden measured by anatomical MRI with several perfusion indices by DCE-MRI and (18)F-FDG uptake by PET. No relationship was found between plaque composition by anatomical MRI and DCE-MRI or (18)F-FDG PET metrics.
Conclusion: In this study we observed a significant, weak inverse relationship between inflammation measured as (18)F-FDG uptake by PET and plaque perfusion by DCE-MRI. Our findings suggest that there may be a complex relationship between plaque inflammation and microvascularization during the different stages of plaque development. (18)F-FDG PET and DCE-MRI may have complementary roles in future clinical practice in identifying subjects at high risk of cardiovascular events.
Figures
References
-
- Virmani R, Burke AP, Farb A, Kolodgie FD. Pathology of the vulnerable plaque. J Am Coll Cardiol. 2006;47(suppl):C13–C18. - PubMed
-
- Fuster V, Fayad ZA, Moreno PR, Poon M, Corti R, Badimon JJ. Atherothrombosis and high-risk plaque: Part II: approaches by noninvasive computed tomographic/magnetic resonance imaging. J Am Coll Cardiol. 2005;46:1209–1218. - PubMed
-
- Rudd JH, Warburton EA, Fryer TD, et al. Imaging atherosclerotic plaque inflammation with [18F]-fluorodeoxyglucose positron emission tomography. Circulation. 2002;105:2708–2711. - PubMed
-
- Tawakol A, Migrino RQ, Bashian GG, et al. In vivo 18F-fluorodeoxyglucose positron emission tomography imaging provides a noninvasive measure of carotid plaque inflammation in patients. J Am Coll Cardiol. 2006;48:1818–1824. - PubMed
-
- Rudd JH, Myers KS, Bansilal S, et al. (18)Fluorodeoxyglucose positron emission tomography imaging of atherosclerotic plaque inflammation is highly reproducible: implications for atherosclerosis therapy trials. J Am Coll Cardiol. 2007;50:892–896. - PubMed
Publication types
MeSH terms
Substances
Associated data
Grants and funding
LinkOut - more resources
Full Text Sources
Other Literature Sources
Medical
Research Materials
