

Approach to cerebrospinal fluid (CSF) biomarker discovery and evaluation in HIV infection
- PMID: 23943280
- PMCID: PMC3889225
- DOI: 10.1007/s11481-013-9491-3
Approach to cerebrospinal fluid (CSF) biomarker discovery and evaluation in HIV infection
Abstract
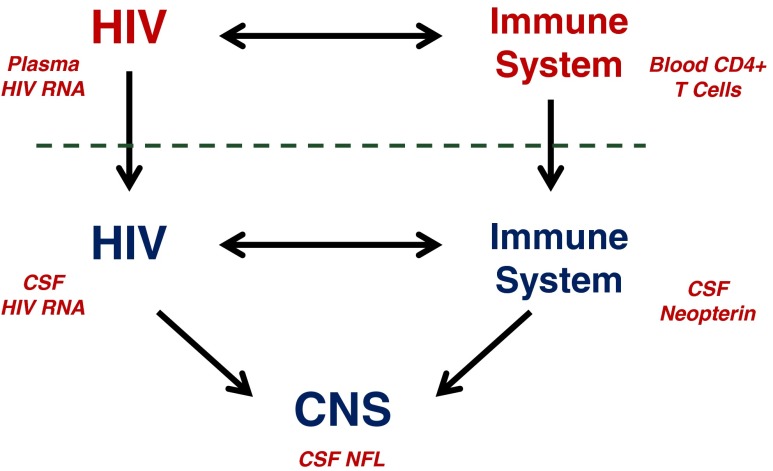
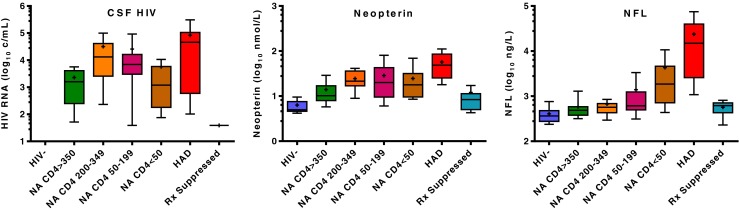
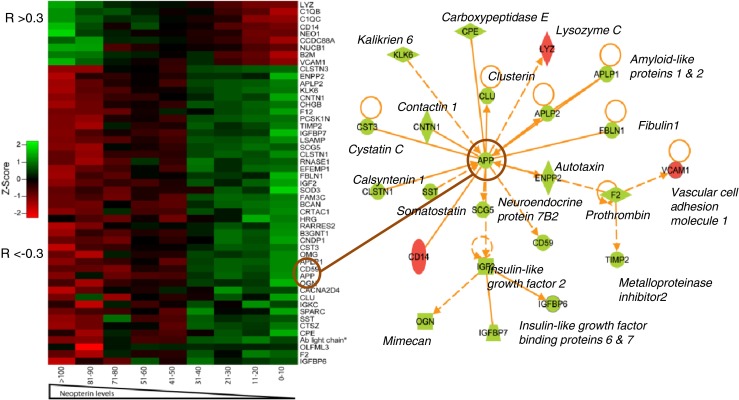
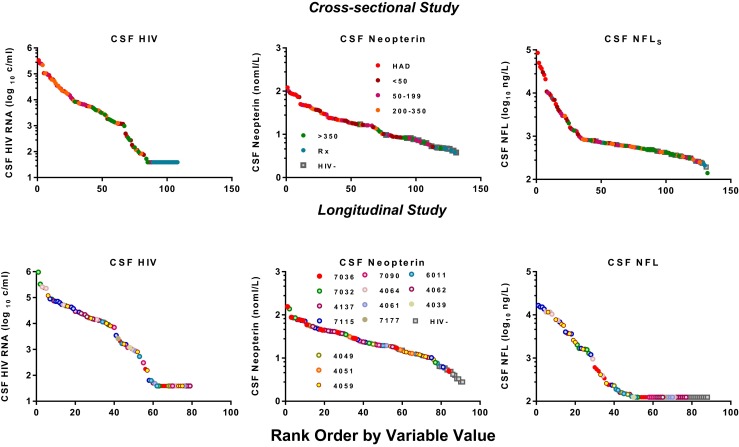
Central nervous system (CNS) infection is a nearly universal facet of systemic HIV infection that varies in character and neurological consequences. While clinical staging and neuropsychological test performance have been helpful in evaluating patients, cerebrospinal fluid (CSF) biomarkers present a valuable and objective approach to more accurate diagnosis, assessment of treatment effects and understanding of evolving pathobiology. We review some lessons from our recent experience with CSF biomarker studies. We have used two approaches to biomarker analysis: targeted, hypothesis-driven and non-targeted exploratory discovery methods. We illustrate the first with data from a cross-sectional study of defined subject groups across the spectrum of systemic and CNS disease progression and the second with a longitudinal study of the CSF proteome in subjects initiating antiretroviral treatment. Both approaches can be useful and, indeed, complementary. The first is helpful in assessing known or hypothesized biomarkers while the second can identify novel biomarkers and point to broad interactions in pathogenesis. Common to both is the need for well-defined samples and subjects that span a spectrum of biological activity and biomarker concentrations. Previously-defined guide biomarkers of CNS infection, inflammation and neural injury are useful in categorizing samples for analysis and providing critical biological context for biomarker discovery studies. CSF biomarkers represent an underutilized but valuable approach to understanding the interactions of HIV and the CNS and to more objective diagnosis and assessment of disease activity. Both hypothesis-based and discovery methods can be useful in advancing the definition and use of these biomarkers.
Figures
Similar articles
-
Cerebrospinal fluid (CSF) neuronal biomarkers across the spectrum of HIV infection: hierarchy of injury and detection.PLoS One. 2014 Dec 26;9(12):e116081. doi: 10.1371/journal.pone.0116081. eCollection 2014. PLoS One. 2014. PMID: 25541953 Free PMC article.
-
Amyloid and tau cerebrospinal fluid biomarkers in HIV infection.BMC Neurol. 2009 Dec 22;9:63. doi: 10.1186/1471-2377-9-63. BMC Neurol. 2009. PMID: 20028512 Free PMC article.
-
Changes in cerebrospinal fluid proteins across the spectrum of untreated and treated chronic HIV-1 infection.PLoS Pathog. 2024 Sep 24;20(9):e1012470. doi: 10.1371/journal.ppat.1012470. eCollection 2024 Sep. PLoS Pathog. 2024. PMID: 39316609 Free PMC article.
-
Cerebrospinal Fluid Concentrations of the Synaptic Marker Neurogranin in Neuro-HIV and Other Neurological Disorders.Curr HIV/AIDS Rep. 2019 Feb;16(1):76-81. doi: 10.1007/s11904-019-00420-1. Curr HIV/AIDS Rep. 2019. PMID: 30649659 Free PMC article. Review.
-
Plasma neuronal exosomes serve as biomarkers of cognitive impairment in HIV infection and Alzheimer's disease.J Neurovirol. 2019 Oct;25(5):702-709. doi: 10.1007/s13365-018-0695-4. Epub 2019 Jan 4. J Neurovirol. 2019. PMID: 30610738 Free PMC article. Review.
Cited by
-
Cerebrospinal fluid (CSF) neuronal biomarkers across the spectrum of HIV infection: hierarchy of injury and detection.PLoS One. 2014 Dec 26;9(12):e116081. doi: 10.1371/journal.pone.0116081. eCollection 2014. PLoS One. 2014. PMID: 25541953 Free PMC article.
-
Neurologic Complications in Treated HIV-1 Infection.Curr Neurol Neurosci Rep. 2016 Jul;16(7):62. doi: 10.1007/s11910-016-0666-1. Curr Neurol Neurosci Rep. 2016. PMID: 27170369 Review.
-
Neurocognitive Complications of Pediatric HIV Infections.Curr Top Behav Neurosci. 2021;50:147-174. doi: 10.1007/7854_2019_102. Curr Top Behav Neurosci. 2021. PMID: 31522375
-
Identification of putative biomarkers for HIV-associated neurocognitive impairment in the CSF of HIV-infected patients under cART therapy determined by mass spectrometry.J Neurovirol. 2014 Oct;20(5):457-65. doi: 10.1007/s13365-014-0263-5. Epub 2014 Jul 24. J Neurovirol. 2014. PMID: 25056907 Free PMC article.
-
Pathomechanisms of HIV-Associated Cerebral Small Vessel Disease: A Comprehensive Clinical and Neuroimaging Protocol and Analysis Pipeline.Front Neurol. 2020 Dec 15;11:595463. doi: 10.3389/fneur.2020.595463. eCollection 2020. Front Neurol. 2020. PMID: 33384655 Free PMC article.
References
-
- (1991) Nomenclature and research case definitions for neurologic manifestations of human immunodeficiency virus-type 1 (HIV-1) infection. Report of a Working Group of the American Academy of Neurology AIDS Task Force. Neurology 41:778–785 - PubMed
Publication types
MeSH terms
Substances
Grants and funding
LinkOut - more resources
Full Text Sources
Other Literature Sources
