. 2013 Aug 13;6(288):ra69.
doi: 10.1126/scisignal.2004075.

A computational model predicts that Gβγ acts at a cleft between channel subunits to activate GIRK1 channels

Affiliations

A computational model predicts that Gβγ acts at a cleft between channel subunits to activate GIRK1 channels

Rahul Mahajan et al. Sci Signal. .

Abstract

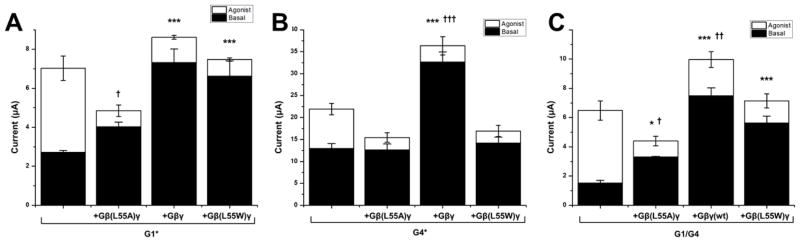
The atrial G protein (heterotrimeric guanine nucleotide-binding protein)-regulated inwardly rectifying K(+) (GIRK1 and GIRK4) heterotetrameric channels underlie the acetylcholine-induced K(+) current responsible for vagal inhibition of heart rate and are activated by the G protein βγ subunits (Gβγ). We used a multistage protein-protein docking approach with data from published structures of GIRK1 and Gβγ to generate an experimentally testable interaction model of Gβγ docked onto the cytosolic domains of the GIRK1 homotetramer. The model suggested a mechanism by which Gβγ promotes the open state of a specific cytosolic gate in the channel, the G loop gate. The predicted structure showed that the Gβ subunit interacts with the channel near the site of action for ethanol and stabilizes an intersubunit cleft formed by two loops (LM and DE) of adjacent channel subunits. Using a heterologous expression system, we disrupted the predicted GIRK1- and Gβγ-interacting residues by mutation of one protein and then rescued the regulatory activity by mutating reciprocal residues in the other protein. Disulfide cross-linking of channels and Gβγ with cysteine mutations at the predicted interacting residues yielded activated channels. The mechanism of Gβγ-induced activation of GIRK4 was distinct from GIRK1 homotetramers. However, GIRK1-GIRK4 heterotetrameric channels activated by Gβγ displayed responses indicating that the GIRK1 subunit dominated the response pattern. This work demonstrated that combining computational with experimental approaches is an effective method for elucidating interactions within protein complexes that otherwise might be challenging to decipher.


Conflict of interest statement

Competing interests: The authors have no competing financial interests to declare.

Figures

Fig 1
Fig 1. Selection of a best-scoring computational model of Gβγ docked onto GIRK1
(A) Summary of the docking protocol used to predict the GIRK1 channel-Gβγ binding mode. Individual steps are organized into phases of a generalized approach to multistage protein-protein docking as outlined by Vajda and Kozakov (25). (B) Cartoon representation of the channel structure. Two adjacent channel subunits are highlighted in cyan and magenta. Yellow dots represent the centers of mass of individual retained poses of Gβγ at the end of the rigid docking by ZDock phase (54,000 poses). (C) Centers of mass of poses retained after filtering by membrane distance restraints (~5000 poses). (D) Centers of mass of the 30 clusters of poses representing the centers of the 30 largest clusters obtained from Cluspro. The pose that was refined to yield the final model is highlighted in blue. Green highlights the pose representing the center of the largest cluster. (E) Scoring of RosettaDock refined models of the channel and Gβγ using a composite score. Scores are plotted versus interface root mean square deviation (RMSD) from the lowest-scoring model. There are 1000 points representing refined models for each of the 30 initial starting orientations obtained from clustering. Lower values represent more favorable scoring. Refined RosettaDock models from the starting orientation that yielded the final model are highlighted in blue. Refined models from the starting orientation representing the largest cluster are highlighted in green. Interface RMSD is calculated as follows: residues of Gβγ in the best scoring model containing at least 1 atom within 10Å of the channel are identified as reference. For each of the other poses, the positions of these same residues are identified within each of the other poses and RMSD is calculated compared to the reference.
Fig 2
Fig 2. A computational docking strategy predicts an energetically favorable complex between Gβγ and channel
(A) Surface representations of the channel (left) and Gβγ (right) are colored by residue hydrophobicity (44): Yellow is most hydrophobic, blue is least hydrophobic. Interface regions found in the best scoring model are outlined in magenta. (B) Cartoon illustration showing overall orientation of Gβγ docked to the channel. Gβ is yellow (ribbon), Gγ is orange (ribbon), two adjacent subunits of the homotetrameric channel are highlighted in cyan and magenta (cartoons). Interface residues of the channel subunits within 5Å of Gβ are depicted as spheres. (C) Close-up views depicting cartoon backbone and stick sidechain representations of interface residues (5Å cutoff) of the channel (left) and Gβγ (right). In C, red = acidic, blue = basic, green = polar, white = non-polar.
Fig 3
Fig 3. Gβγ interactions predicted to open DE-LM cleft sterically or through electrostatic repulsion increase channel activity
(A) Cartoon illustration of predicted functionally important residue interactions. Two adjacent subunits of the channel are highlighted in cyan and magenta. Gβ is yellow. Gβ Leu55 is seen inserting in a cleft between GIRK1 LM loop residue Leu333 and DE loop residue Phe243 of adjacent channel subunits. GIRK1 residues Glu334 and Glu335 are also seen near Gβ Leu55 and Lys89. Residue numbers are shaded as gray, hydrophobic; blue, positively charged; red, negatively charged. (B) Overlapped representative traces depicting currents at -80 mV measured by two-electrode voltage clamp in Xenopus laevis oocytes expressing either GIRK1* (G1*) or GIRK1* and Gβ1γ2. LK, Low potassium solution; HK, High potassium solution; Ba2+, High potassium solution containing 3 mM BaCl2. Ba2+is an inhibitor of GIRK channel activity. (C) The effect of side chain volume substitutions at G1* Phe243 on stimulation of G1* current by wild-type Gβγ. (D) The effect of side chain volume substitutions at G1*Leu333 on stimulation of G1* current by wild-type Gβγ. (E) The effect of side chain volume substitutions at Gβ Leu55 on stimulation of G1* channel current by Gβγ. † indicates estimated p-value < 0.05 by non-overlap of 90% confidence interval with that of Gβ(L55F)γ. (F) The effect of combining mutations that alter side chain volume in G1* and Gβγ. (Left) The effect of Gβ(L55C)γ mutation on G1* channels versus G1*L333W mutant channels. (Right) The ability of G1*(F243C) mutant channel to be activated by wild-type versus Gβ(L55W)γ. (G) The effect of neutralizing negatively charged LM loop channel residues. The effect of G1*E334Q and G1*E335Q on the ability of wild-type Gβγ (Left) or Gβ(L55E)γ (Right) to stimulate channel activity. In (C–G), each of the indicated channels or channel mutants was expressed alone or coexpressed with Gβγ and the fold change between the two groups (n=6–10 oocytes/group, repeated in two batches of oocytes) was calculated for each mutant. Fold-activation of control G1* channels by wild-type G βγ w as normalized t o 1 . Results are summarized in bar graphs (mean ± SEM). (** indicates estimated p-value < 0.01 by non-overlap of 95% confidence interval with that of wild-type; * indicates estimated p-value < 0.05 by non-overlap of 90% confidence interval with that of wild-type; see Materials and Methods for details).
Fig 4
Fig 4. Disulfide cross-linking of Gβγ to the channel stimulates channel activity
(A–B) Representative two-electrode voltage clamp traces showing the effect of H2O2 on G1* and cysteine mutants [G1(L333C) or Gβ(L55C)γ] expressed in Xenopus oocytes. Abbreviations: LK, Low potassium Solution; HK, High potassium solution; Ba2+, High potassium solution containing 3 mM BaCl2. (C) Summary data showing % change in current due to H2O2 perfusion (mean ± SEM; n=5–9, repeated in at least two separate oocyte batches). All other groups were significantly less different than controls except the final which indicates the G1*L333C+Gβ(L55C)γ combination. (p<0.0001 by one way ANOVA and Dunnett’s post hoc test) (D) SDS PAGE analysis with Coomassie Brilliant Blue staining. Wild-type Gβγ or the L55C mutant was mixed with equal concentration of cysteine-less GIRK1 cytoplasmic domain (G1CP) containing the single cysteine mutation L333C [G1CP (L333C)] as indicated. Crosslinking was induced by treatment with increasing concentration of hydrogen peroxide up to 10 mM for 2.5 minutes. A representative image is shown from five individual experiments.
Fig 5
Fig 5. A salt-bridge interaction that allows Gβγ to stabilize the open DE-LM cleft increases channel activity
(A) The effect of combining charge-reversing mutations at the predicted salt-bridge residues G1* Glu334 and Gβ Lys89. (Left) The ability of Gβ(K89E)γ versus wild-type Gβγ to stimulate G1* channels. (Right) The ability of Gβ(K89E)γ versus wild-type Gβγ to stimulate G1*E334K channels. (** indicates estimated p-value < 0.01 by non-overlap of 95% confidence interval with that of wild-type; * indicates estimated p-value < 0.05 by non-overlap of 90% confidence interval with that of wild-type; see methods section). (B) Overlapped representative traces depicting currents at −80 mV measured by two-electrode voltage clamp in Xenopus laevis oocytes. G1* ± Gβγ is co-expressed with mGluR2 receptors to monitor agonist-induced currents. (C) The effect of combining charge-reversing mutations at the predicted salt-bridge residues G1* Glu334 and Gβ Lys89 on basal and agonist-induced currents. (Left) The effect of co-expressed wild-type Gβγ versus Gβ(K89E)γ on basal and agonist induced activity of G1*. (Right) The effect of co-expressed wild-type Gβγ versus Gβ(K89E)γ on basal and agonist induced activity of G1*E334K. (Bar graphs are mean ± SEM of n=7–10, repeated in at least two separate oocyte batches; * indicates p<0.05, ** indicates p<0.001, *** indicates p<0.0001 for comparison of basal current to channel alone. † indicates p<0.05, †† indicates p<0.001, ††† indicates p<0.0001 for comparison of total maximal current to channel alone. Comparisons by one way ANOVA with Dunnet's post-hoc test).
Fig 6
Fig 6. The G1 response to Gβγ dominates over the G4 response in the heteromeric channel
(A) The effect of side chain volume substitutions in coexpressed Gβγ at position Leu55 on basal and agonist-induced currents of G1*. (B) The effect of side chain volume substitutions in coexpressed Gβγ at position Leu55 on basal and agonist-induced currents of G4*. (C) The effect of side chain volume substitutions in coexpressed Gβγ at position Leu55 on basal and agonist-induced currents of wild-type heteromeric G1/G4 channels. (All bar graphs are mean ± SEM of n=6–8, repeated in at least two separate oocyte batches; * indicates p<0.05, ** indicates p<0.001, *** indicates p<0.0001 for comparison of basal current to channel alone. † indicates p<0.05, †† indicates p<0.001, ††† indicates p<0.0001 for comparison of total maximal current to channel alone. Comparisons by one way ANOVA with Dunnet's post-hoc test).
Fig 7
Fig 7. Various modulators stabilize the intracellular domain in the “open” G-loop conformation
(A) Rearrangements of intracellular interactions grossly visible in comparison of the “closed” (left) and “open” (right) structures of the GIRK1 chimera. Some residues of the linker regions connecting the N- and C- termini to the transmembrane regions have been modeled in these structures. (B) Summary of the major results of Meng et al. (24) and their extension to include the DE loop and DE-LM loop cleft. Transitioning from the closed to open, the secondary structure elements switch their close interactions from adjacent elements on one side to the elements on the other side. PIP2 stabilizes the conformation by direct interactions with the CD loop and N-terminus. We propose that Gβγ works through a similar mechanism by stabilizing the same global conformation but by direct interactions with a different part of the channel. The proposed site of action at the DE-LM loop cleft is shared with the site of ethanol (EtOH) action. Pink and yellow highlight the alternating secondary structure elements involved in gating. The DE loop and the N-terminus would be from one subunit and all other elements would be from the other.

References

    1. Trautwein W, Dudel J. Zum mechanismus der membranwirkung des acetylcholin an der herzmuskelfaser. Pflügers Archiv European Journal of Physiology. 1958;266:324–334. - PubMed
    1. Logothetis DE, Kurachi Y, Galper J, Neer EJ, Clapham DE. The beta gamma subunits of GTP-binding proteins activate the muscarinic K+ channel in heart. Nature. 1987;325:321–326. - PubMed
    1. Cabrera-Vera TM, Vanhauwe J, Thomas TO, Medkova M, Preininger A, Mazzoni MR, Hamm HE. Insights into G Protein Structure, Function, and Regulation. Endocrine Reviews. 2003;24:765–781. - PubMed
    1. Gaudet R, Bohm A, Sigler PB. Crystal structure at 2.4 angstroms resolution of the complex of transducin betagamma and its regulator, phosducin. Cell. 1996;87:577–588. - PubMed
    1. Tesmer JJG, Tesmer VM, Lodowski DT, Steinhagen H, Huber J. Structure of human G protein-coupled receptor kinase 2 in complex with the kinase inhibitor balanol. J Med Chem. 2010;53:1867–1870. - PMC - PubMed

Publication types

MeSH terms

Substances

LinkOut - more resources