. 2013 Sep 27;288(39):28230-42.
doi: 10.1074/jbc.M113.468603. Epub 2013 Aug 13.

Coordinate functional regulation between microsomal prostaglandin E synthase-1 (mPGES-1) and peroxisome proliferator-activated receptor γ (PPARγ) in the conversion of white-to-brown adipocytes

Affiliations

Coordinate functional regulation between microsomal prostaglandin E synthase-1 (mPGES-1) and peroxisome proliferator-activated receptor γ (PPARγ) in the conversion of white-to-brown adipocytes

Verónica García-Alonso et al. J Biol Chem. .

Abstract

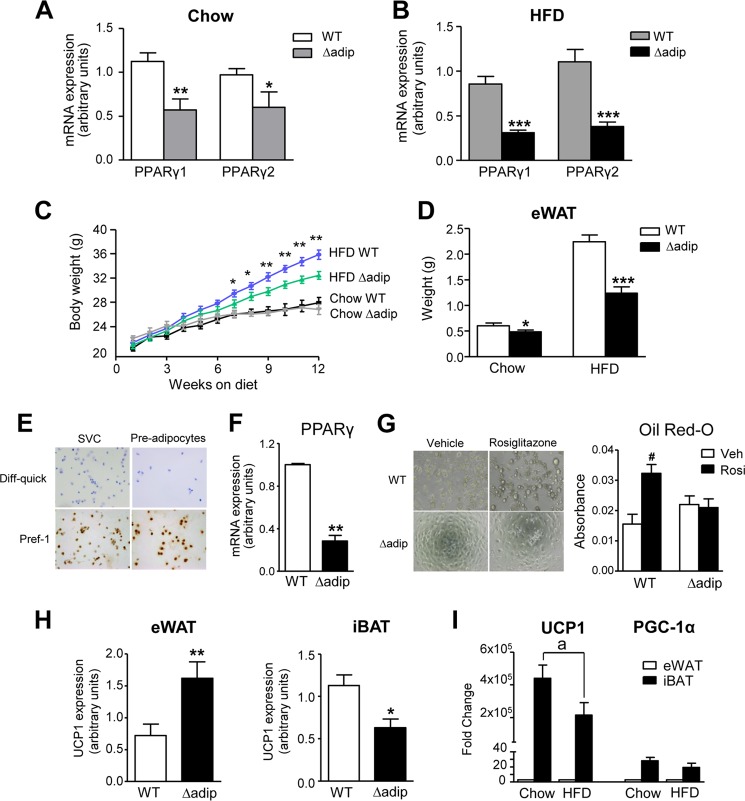
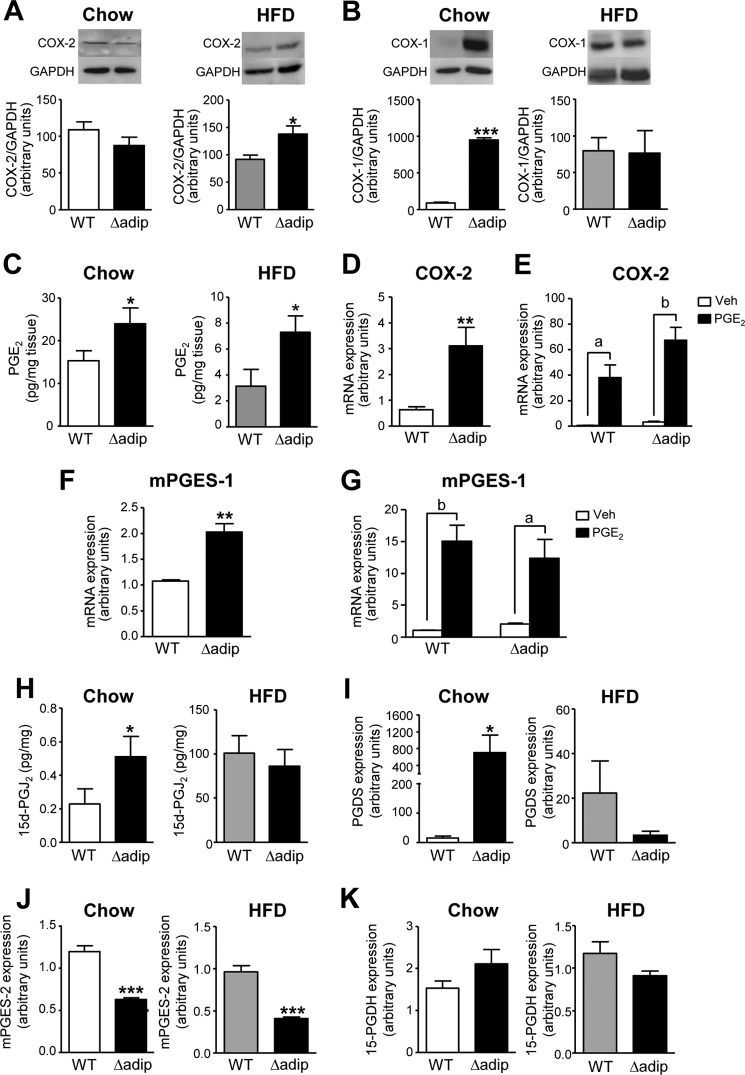
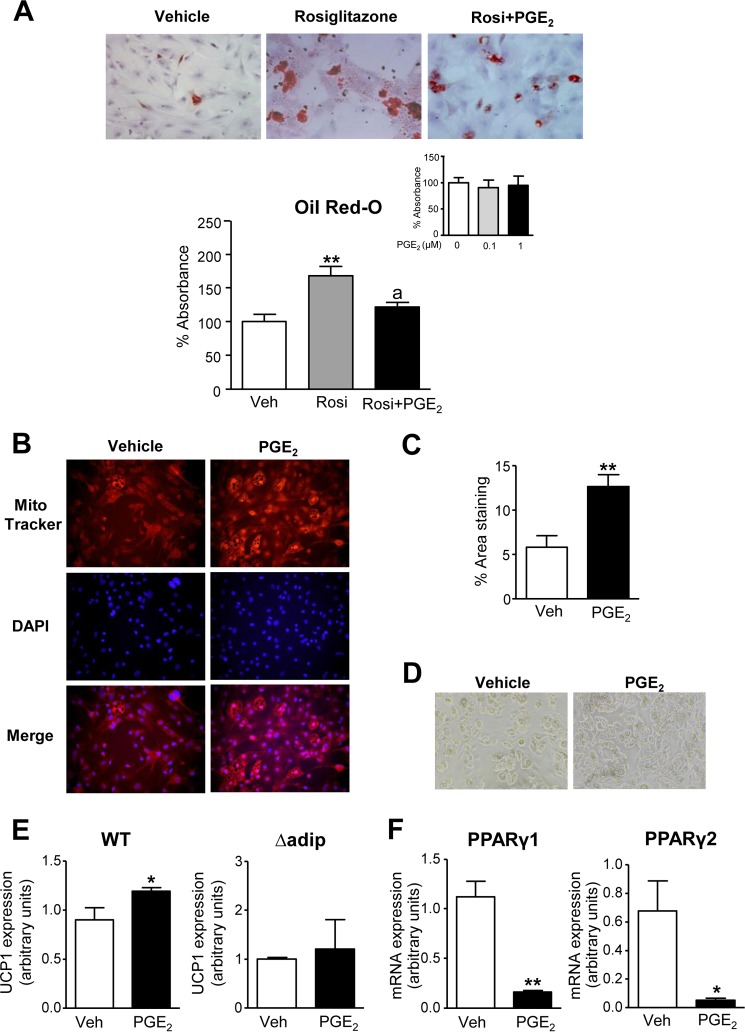
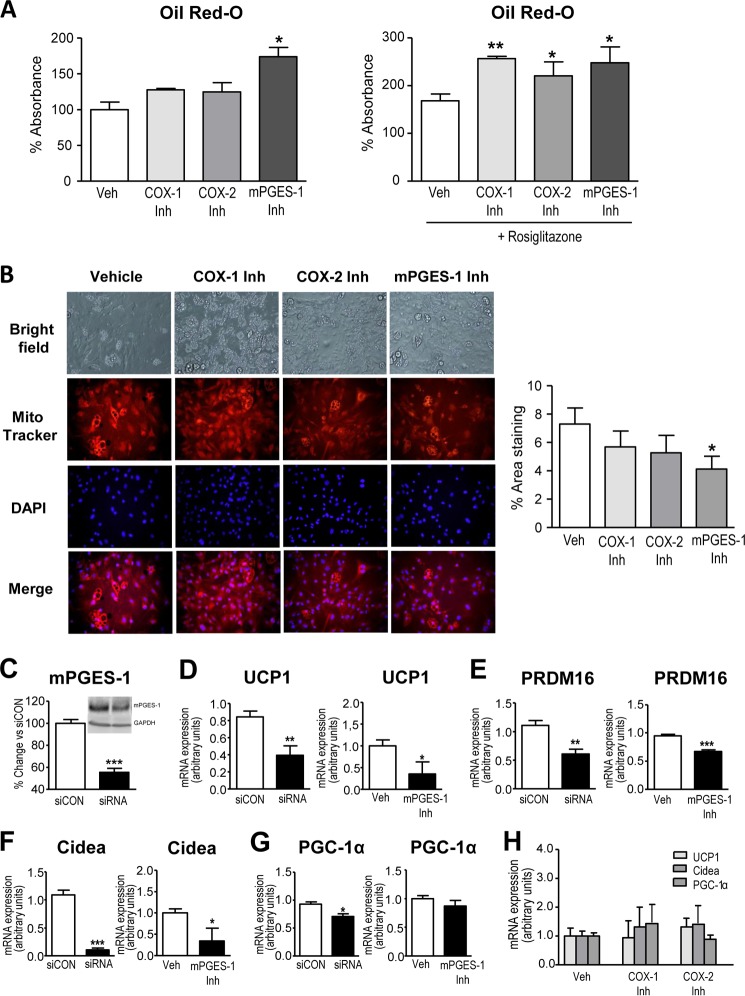
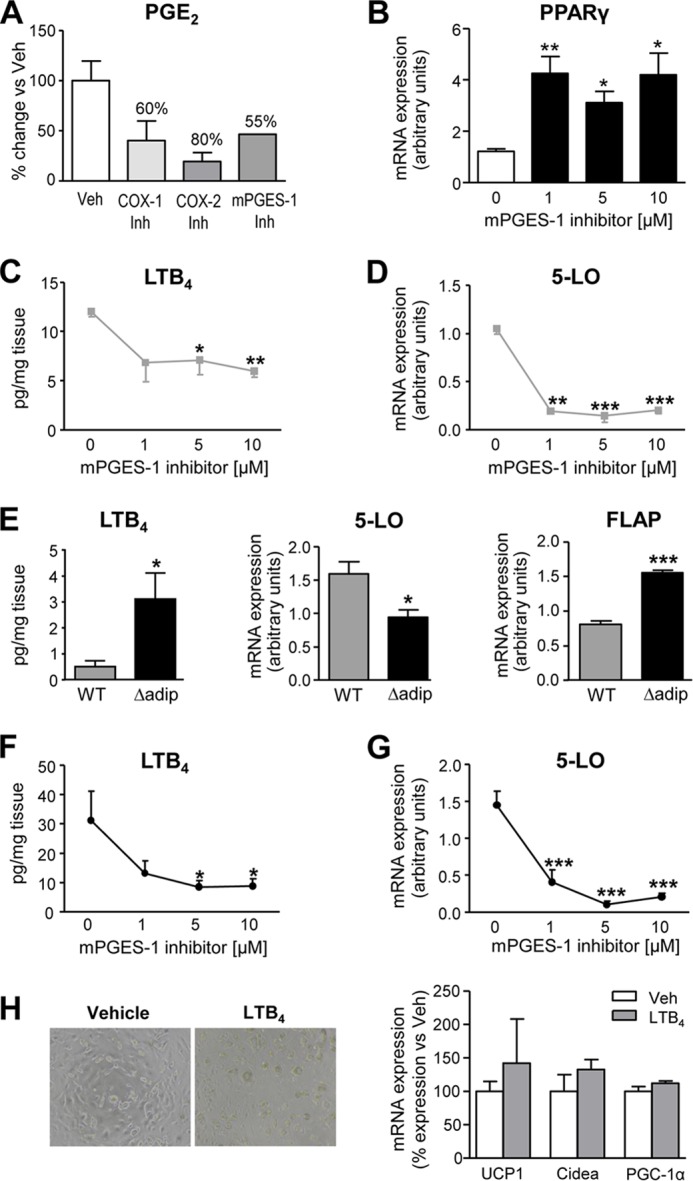
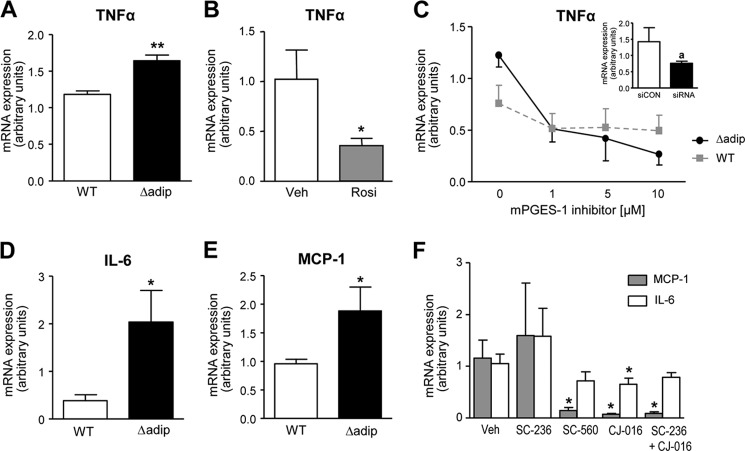
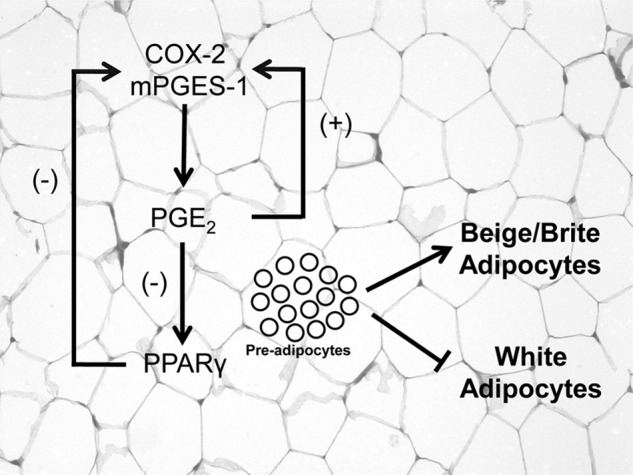
Peroxisome proliferator-activated receptor γ (PPARγ) is a ligand-activated nuclear receptor and a master regulator of adipogenesis. Microsomal prostaglandin E (PGE) synthase-1 (mPGES-1) is an inducible enzyme that couples with cyclooxygenase-2 for the biosynthesis of PGE2. In this study we demonstrate the existence of a coordinate functional interaction between PPARγ and mPGES-1 in controlling the process of pre-adipocyte differentiation in white adipose tissue (WAT). Adipocyte-specific PPARγ knock-out mice carrying an aP2 promoter-driven Cre recombinase transgene showed a blunted response to the adipogenic effects of a high fat diet. Pre-adipocytes from these knock-out mice showed loss of PPARγ and were resistant to rosiglitazone-induced WAT differentiation. In parallel, WAT from these mice showed increased expression of uncoupling protein 1, a mitochondrial enzyme that dissipates chemical energy as heat. Adipose tissue from mice lacking PPARγ also showed mPGES-1 up-regulation and increased PGE2 levels. In turn, PGE2 suppressed PPARγ expression and blocked rosiglitazone-induced pre-adipocyte differentiation toward white adipocytes while directly elevating uncoupling protein 1 expression and pre-adipocyte differentiation into mature beige/brite adipocytes. Consistently, pharmacological mPGES-1 inhibition directed pre-adipocyte differentiation toward white adipocytes while suppressing differentiation into beige/brite adipocytes. This browning effect was reproduced in knockdown experiments using a siRNA directed against mPGES-1. The effects of PGE2 on pre-adipocyte differentiation were not seen in mice lacking PPARγ in adipose tissue and were not mirrored by other eicosanoids (i.e. leukotriene B4). Taken together, these findings identify PGE2 as a key regulator of white-to-brown adipogenesis and suggest the existence of a coordinate regulation of adipogenesis between PPARγ and mPGES-1.

Keywords: Adipose Tissue; Beige Adipocytes; Cyclooxygenase (COX) Pathway; Eicosanoid; Metabolic Diseases; PPARγ; Pre-adipocytes; Prostaglandins; mPGES-1.


Figures

FIGURE 1.
FIGURE 1.
Effects of targeted deletion of PPARγ in adipocytes. A, adipose mRNA expression for PPARγ isoforms 1 and 2 assessed by real-time PCR in WT (n = 10) and aP2-Cre driven PPARγ KO (Δadip) (n = 9) mice under chow conditions. B, expression for PPARγ isoforms 1 and 2 in eWAT from WT (n = 6) and Δadip (n = 6) mice after 12 weeks of HFD (60% kcal from fat) feeding. C, body weight in WT (n = 5) and Δadip (n = 4) mice receiving a chow diet and in WT (n = 13) and Δadip (n = 11) mice during the obesity-induced model of HFD feeding for 12 weeks. D, eWAT weight in WT (n = 18) and Δadip (n = 15) mice under Chow and HFD conditions. E, representative photomicrographs of SVC fraction and pre-adipocyte cultures stained with Diff-quick or immunostained with Pref-1 specific antibody (×200 magnification). F, PPARγ expression in pre-adipocytes from WT (n = 3) and Δadip (n = 3) mice. G, representative bright field images of pre-adipocytes from WT and Δadip mice incubated with rosiglitazone (Rosi, 1 μm) or vehicle (Veh). Absorbance values from Oil Red-O staining of rosiglitazone-induced pre-adipocyte differentiation toward white adipocytes are shown on the right. H, mitochondrial UCP1 expression in eWAT and iBAT from WT (n = 17) and Δadip (n = 11) mice. I, UCP1 and PGC-1α expression (fold change versus eWAT for each condition and gene studied) in eWAT and iBAT from WT mice under Chow and HFD conditions. Results are expressed as the mean ± S.E. *, p < 0.05; **, p < 0.01; ***, p < 0.001 versus WT mice. #, p < 0.05 versus Veh. a, p < 0.05 versus chow.
FIGURE 2.
FIGURE 2.
COX-2 and mPGES-1 up-regulation and increased adipose PGE2 levels in aP2-Cre driven PPARγ KO (Δadip) mice. A, adipose tissue protein expression for COX-2 in WT (n = 8) and Δadip (n = 8) mice under Chow and HFD conditions. B, adipose tissue protein expression for COX-1 in WT (n = 9) and Δadip (n = 7) mice under chow and HFD conditions. C, PGE2 levels in adipose tissue from WT (n = 6) and Δadip (n = 6) mice under chow and HFD conditions. D, expression of COX-2 in fat explants from WT and Δadip mice incubated ex vivo. E, expression of COX-2 in WT and Δadip fat explants incubated with vehicle (Veh, 0.04% ethanol) and PGE2 (1 μm) for 12 h. F, expression of mPGES-1 in fat explants from WT and Δadip mice incubated ex vivo. G, expression of mPGES-1 in WT and Δadip fat explants incubated with vehicle (Veh, 0.04% ethanol) and PGE2 (1 μm) for 12 h. H, levels of 15d-PGJ2 in adipose tissue from WT (n = 6) and Δadip (n = 6) mice under chow and HFD conditions. I, expression of prostaglandin D synthase (PGDS) in these mice. J, adipose tissue mPGES-2 expression. K, adipose tissue 15-prostaglandin dehydrogenase (15-PGDH) expression. Results are expressed as mean ± S.E. *, p < 0.05; **, p < 0.01; ***, p < 0.001 versus WT mice. a, p < 0.05; b, p < 0.01 versus vehicle.
FIGURE 3.
FIGURE 3.
Effects of PGE2 on pre-adipocyte differentiation. A, Oil Red-O staining of primary eWAT pre-adipocytes at day 12 of differentiation incubated with rosiglitazone (Rosi, 1 μm) in the absence or presence of PGE2 (0.1 μm) for 72 h. The bottom graph shows the quantification of the Oil Red-O content. Inset, pre-adipocytes incubated with increasing concentrations of PGE2 in the absence of rosiglitazone. B, pre-adipocytes from eWAT induced to brown differentiation in the absence or presence of PGE2 (0.1 μm) for 72 h. Cells were labeled with Mito Tracker and co-stained with DAPI to identify nuclei (middle panel) (×200 magnification). C, morphometric quantification of the area stained with MitoTracker. D, corresponding bright-field images (×200 magnification). E, UCP1 expression in pre-adipocytes from WT (n = 4) and aP2-Cre driven PPARγ KO (Δadip) mice incubated with PGE2 (1 μm) or vehicle (Veh). F, mRNA expression for PPARγ isoforms 1 and 2 assessed by real-time PCR in fat eWAT explants from WT mice incubated with PGE2 (1 μm) or vehicle for 12 h. Results are expressed as the mean ± S.E. *, p < 0.05; **, p < 0.001 versus vehicle. a, p < 0.05 versus rosiglitazone.
FIGURE 4.
FIGURE 4.
Effects of PGE2 inhibition on pre-adipocyte differentiation. A, quantification of Oil Red-O staining of primary eWAT pre-adipocytes at day 12 of differentiation incubated with 3 μm selective COX-1 (SC-560), COX-2 (SC-58635), and mPGES-1 (benzo[g]indol-3-carboxylate) inhibitors (Inh) for 72 h in the absence or presence of rosiglitazone (1 μm). Veh, vehicle. B, representative microphotographs of pre-adipocytes from eWAT induced to brown differentiation in the absence or presence of COX-1, COX-2, or mPGES-1 inhibitors at 3 μm. Cells were labeled with MitoTracker and co-stained with DAPI to identify nuclei (×200 magnification). The morphometric assessment of the area stained with MitoTracker is shown on the right. C, mRNA expression for mPGES-1 48 h after transfection of 3T3-L1 cells with a mPGES-1 siRNA or an universal scrambled negative control (siCON). Inset, protein levels for mPGES-1 and GAPDH as measured by Western blot. D, UCP1 expression in 3T3-L1 cells transfected with mPGES-1 siRNA and siCON or incubated with the selective mPGES-1 inhibitor benzo[g]indol-3-carboxylate (3 μm). E, expression of PRDM16 in 3T3-L1 after genetic or pharmacological inhibition of mPGES-1. F, changes in Cidea expression in these experiments. G, PGC-1α expression. H, UCP1, Cidea, and PGC-1α expression in primary pre-adipocytes incubated with vehicle (0.04% ethanol) or selective COX-1 (SC-560) and COX-2 (SC-58635) inhibitors (3 μm). Results are expressed as the mean ± S.E. of three individual experiments in duplicate. *, p < 0.05; **, p < 0.01; ***, p < 0.001 versus vehicle or siCON.
FIGURE 5.
FIGURE 5.
Lack of effect of the 5-LO product LTB4 on pre-adipocyte differentiation. A, percent (%) inhibition of PGE2 synthesis as determined by enzyme immunoassay (EIA) in WT fat explant supernatants incubated ex vivo at 5 μm concentration with selective COX-1 (SC-560), COX-2 (SC-58635), and mPGES-1 (benzo[g]indol-3-carboxylate) inhibitors (Inh). Veh, vehicle. B, mRNA expression for PPARγ assessed by real-time PCR in fat eWAT explants from WT mice incubated with increasing concentrations of the mPGES-1 inhibitor for 12 h. C, effects of the mPGES-1 inhibitor on LTB4 production by eWAT explants from WT mice. D, effects of the mPGES-1 inhibitor on eWAT 5-LO expression. E, LTB4 levels and 5-LO and 5-LO-activating protein (FLAP) expression in eWAT from WT (n = 10) and aP2-Cre driven PPARγ KO (Δadip) (n = 9) mice under HFD conditions. F and G, effects of increasing concentrations of the mPGES-1 inhibitor on LTB4 production and 5-LO expression in eWAT explants from Δadip mice. H, representative bright-field images and UCP1, Cidea, and PGC-1α expression in primary eWAT pre-adipocytes incubated with LTB4 (0.1 μm) or vehicle for 48 h. Data are expressed as the mean ± S.E. *, p < 0.05; **, p < 0.01; ***, p < 0.001 with respect to vehicle or WT mice.
FIGURE 6.
FIGURE 6.
Modulation of pro-inflammatory adipokines by PPARγ and mPGES-1. A, TNFα expression in eWAT explants from WT (n = 6) and aP2-Cre driven PPARγ KO (Δadip) (n = 6) mice. B, TNFα expression in eWAT explants from WT mice incubated in the absence or presence of rosiglitazone (Rosi, 10 μm). Veh, vehicle. C, effects of increasing concentrations of the mPGES-1 inhibitor (benzo[g]indol-3-carboxylate, 3 μm) on TNFα expression in eWAT explants from WT and Δadip mice. Inset, mRNA expression for TNFα 48 h after transfection of 3T3-L1 cells with a mPGES-1 siRNA or an universal scrambled negative control (siCON). D and E, IL-6 and MCP-1 expression in eWAT explants from WT and Δadip mice. F, IL-6 and MCP-1 expression in WT fat explants incubated with vehicle (0.2% DMSO), SC-236 (COX-2 inhibitor), SC-260 (COX-1 inhibitor), CJ-016 (5-LO inhibitor), and a combination of SC-236 and CJ-016. Results are the mean ± S.E. *, p < 0.05; **, p < 0.001 with respect to vehicle or WT mice. a, p < 0.05 versus siCON.
FIGURE 7.
FIGURE 7.
Schematic diagram of the proposed coordinated functional regulation of mPGES-1 and PPARγ in beige/brite adipogenesis. PPARγ deletion in WAT uncovers a negative regulation of COX-2 and mPGES-1 expression by this nuclear receptor. In addition, PGE2 is able to down-regulate PPARγ expression in WAT. Furthermore, in this tissue the interaction between PGE2 and PPARγ has the ability to divert pre-adipocyte differentiation from white into beige/brite adipocytes. Interestingly, PGE2 exerts a PPARγ-independent positive feedback loop with local COX-2 and mPGES-1 expression in adipose tissue.

Similar articles

Cited by

References

    1. Cristancho A. G., Lazar M. A. (2011) Forming functional fat: a growing understanding of adipocyte differentiation. Nat. Rev. Mol. Cell Biol. 12, 722–734 - PMC - PubMed
    1. Rosen E. D., Spiegelman B. M., (2006) Adipocytes as regulators of energy balance and glucose homeostasis. Nature 444, 847–853 - PMC - PubMed
    1. Galic S., Oakhill J. S., Steinberg G. R. (2010) Adipose tissue as an endocrine organ. Mol. Cell. Endocrinol. 316, 129–139 - PubMed
    1. Trayhurn P. (2005) Endocrine and signalling role of adipose tissue. New perspectives on fat. Acta Physiol. Scand. 184, 285–293 - PubMed
    1. Kajimura S., Seale P., Spiegelman B. M. (2010) Transcriptional control of brown fat development. Cell Metab. 11, 257–262 - PMC - PubMed

Publication types

MeSH terms