. 2013 Oct 17;122(16):2864-76.
doi: 10.1182/blood-2012-07-445635. Epub 2013 Aug 13.

BCL-2 inhibition with ABT-737 prolongs survival in an NRAS/BCL-2 mouse model of AML by targeting primitive LSK and progenitor cells

Affiliations

BCL-2 inhibition with ABT-737 prolongs survival in an NRAS/BCL-2 mouse model of AML by targeting primitive LSK and progenitor cells

Stephanie Beurlet et al. Blood. .

Abstract

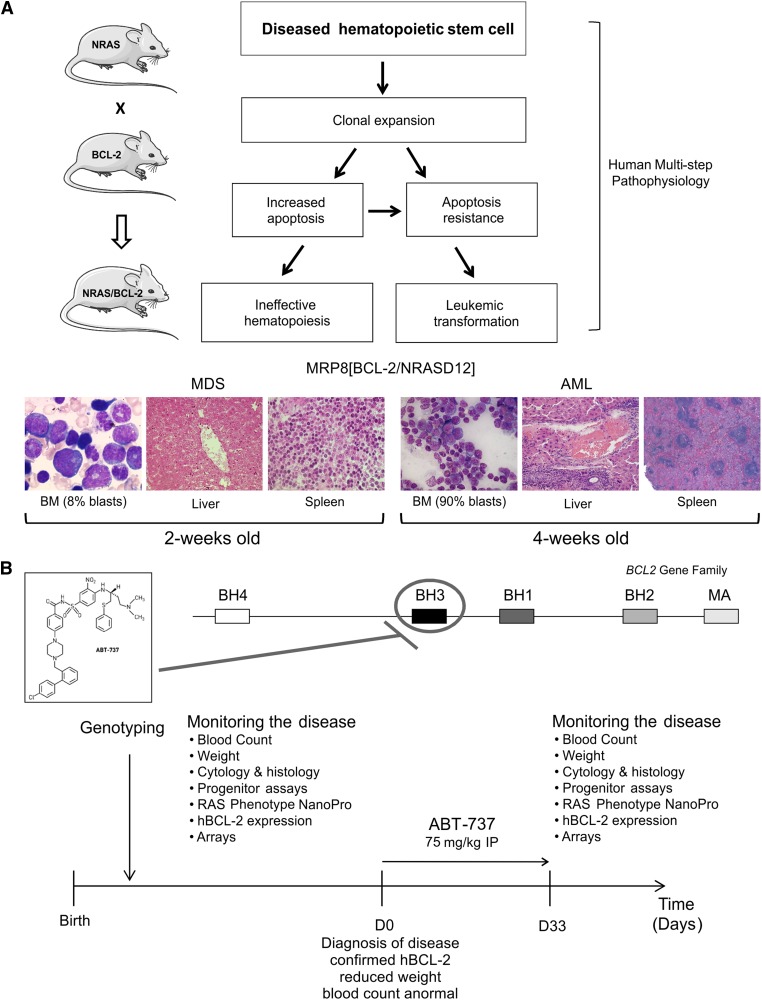
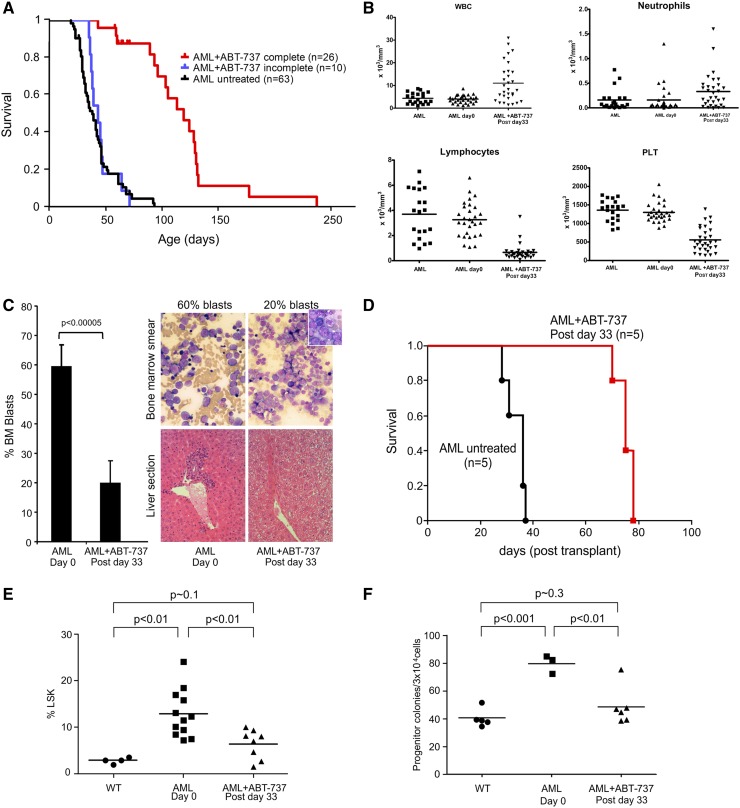
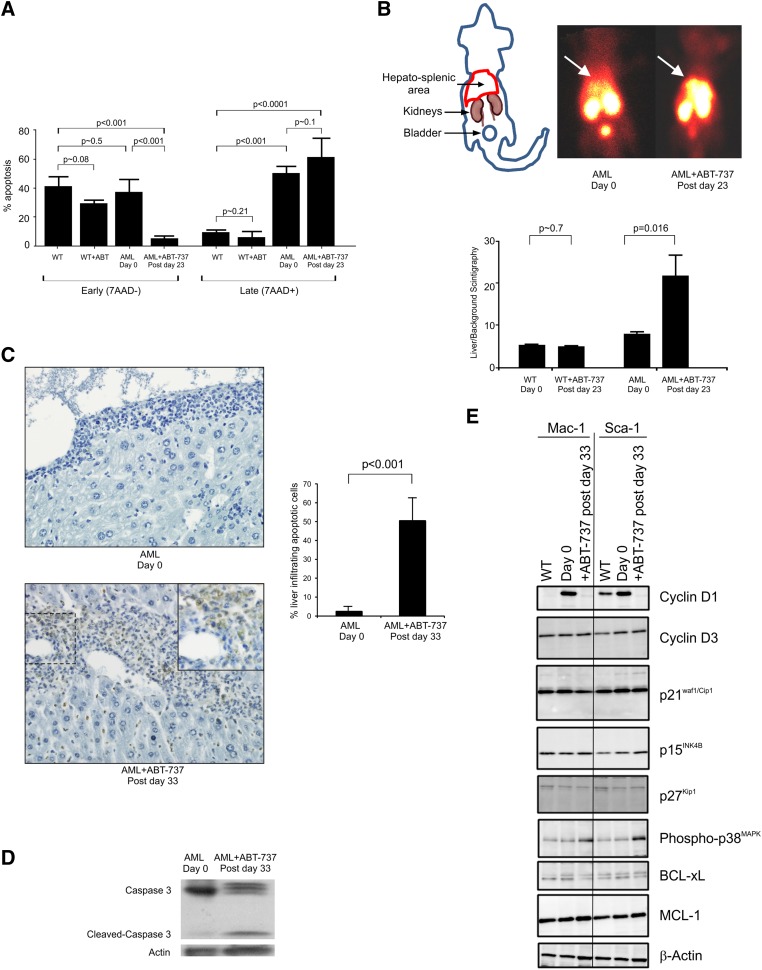
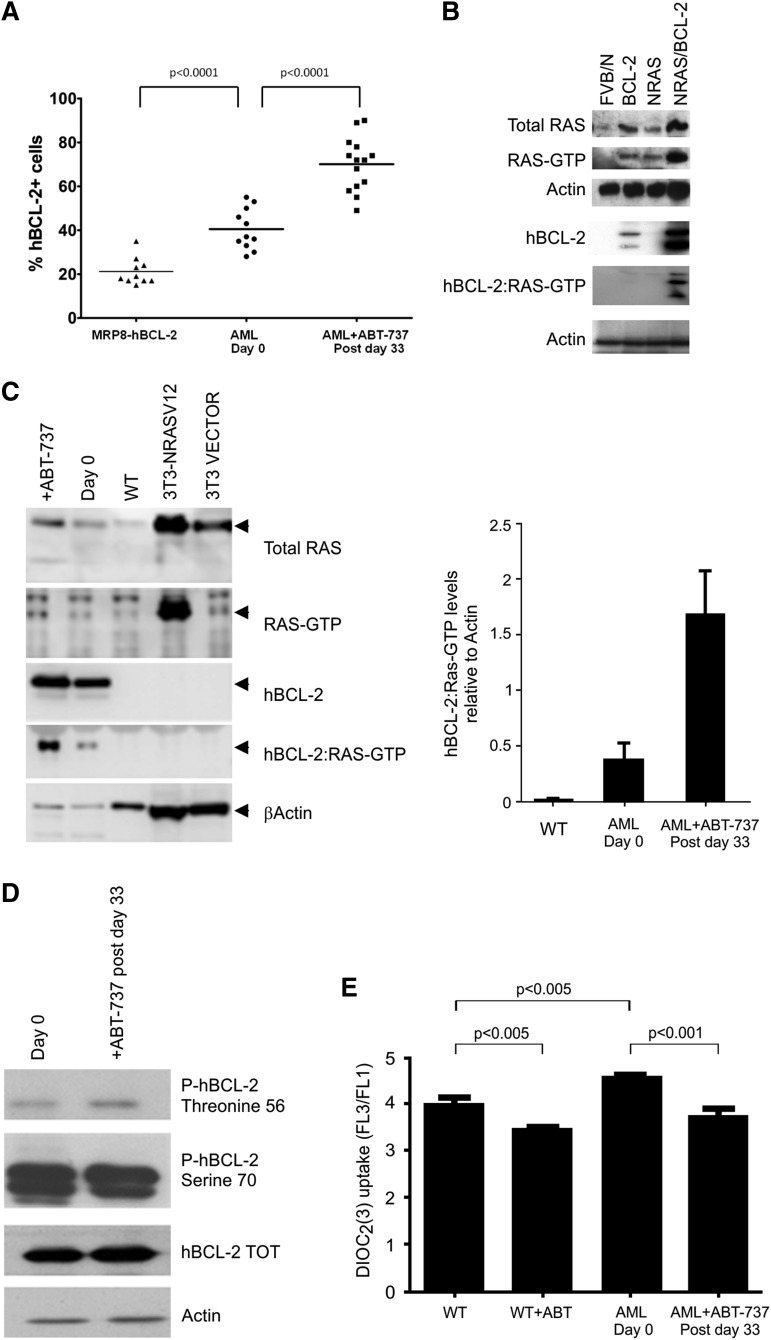
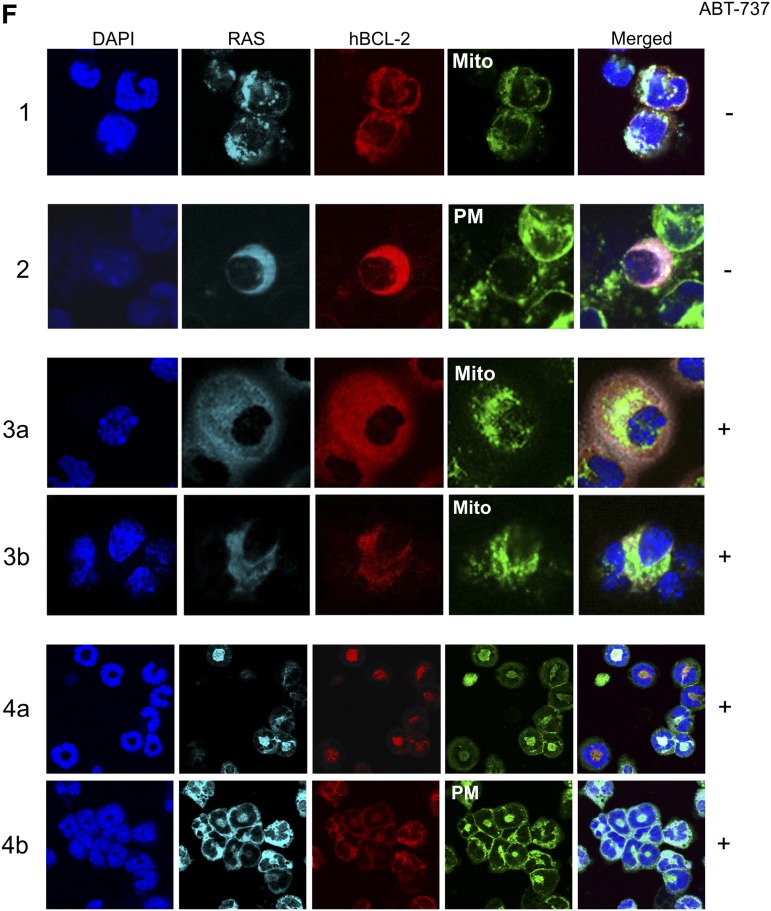
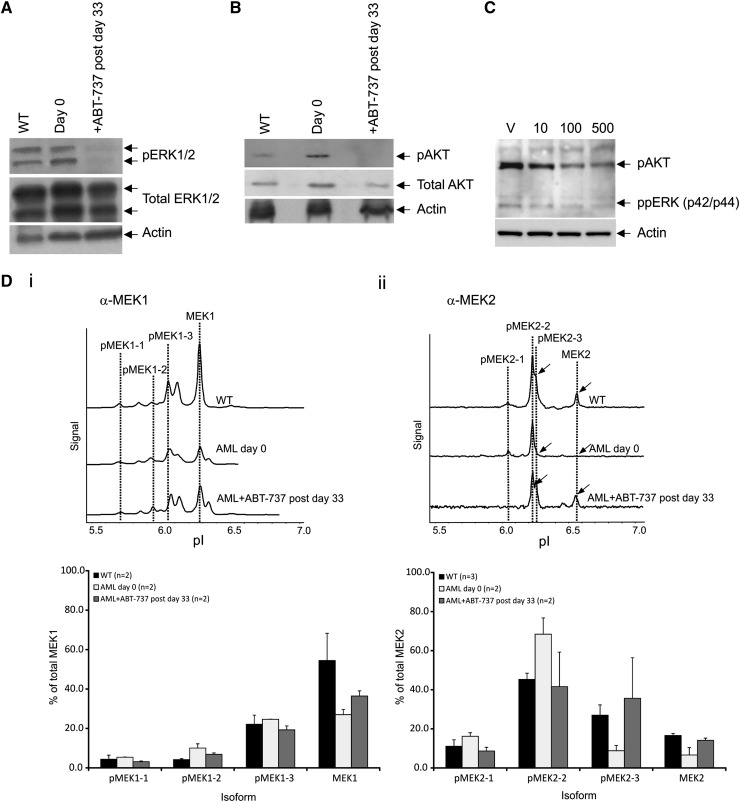
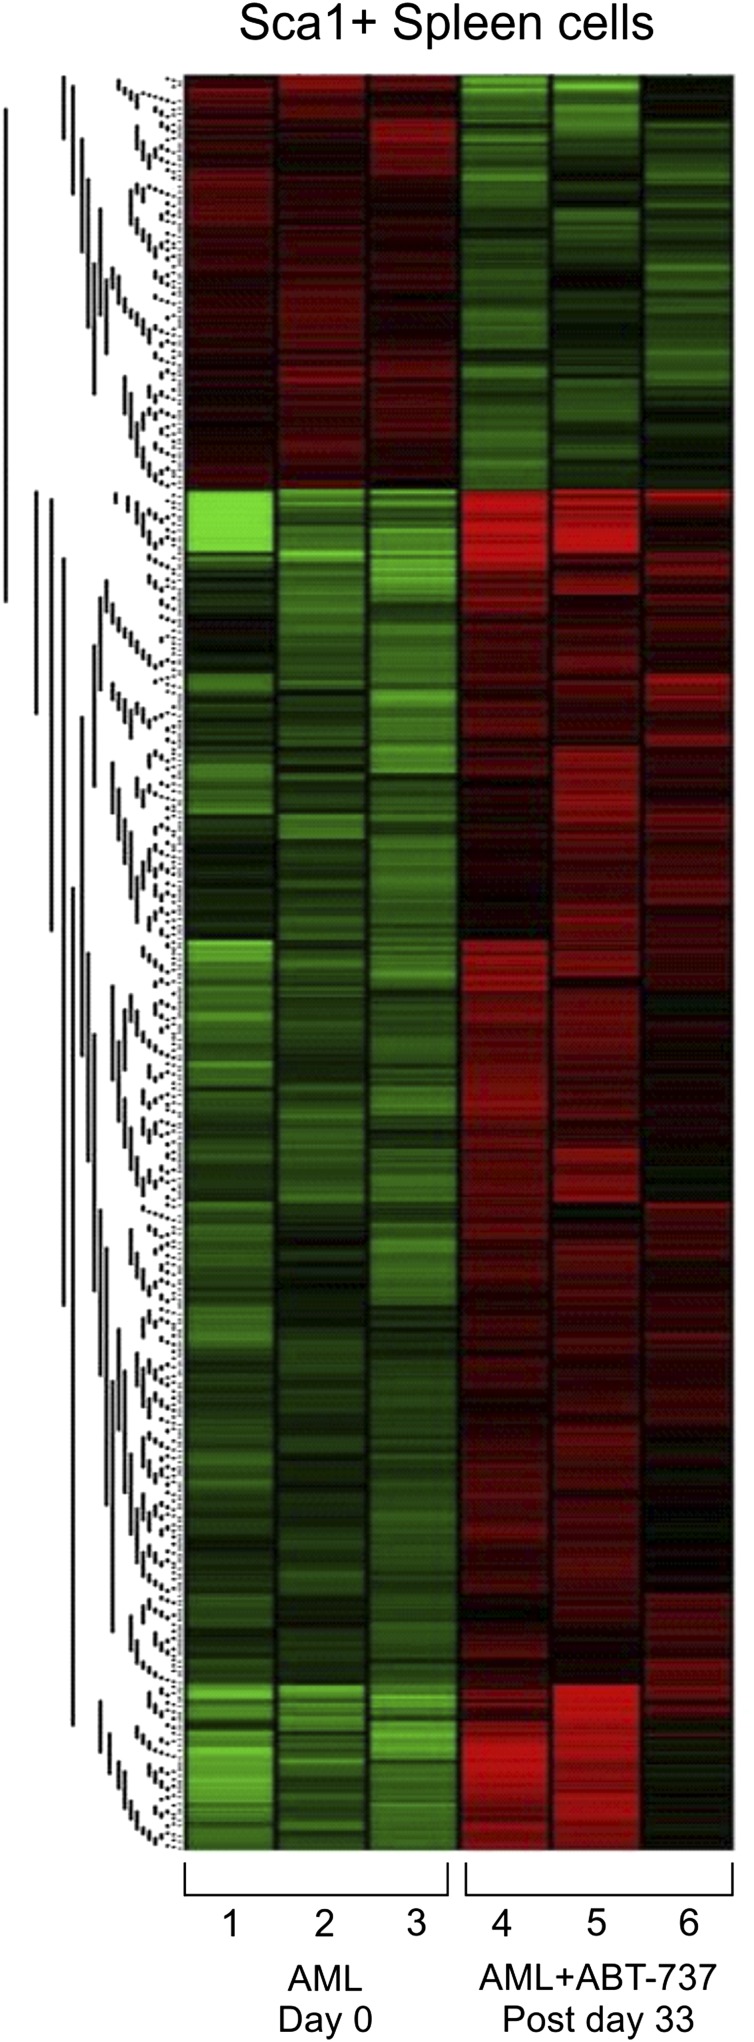
Myelodysplastic syndrome (MDS) transforms into an acute myelogenous leukemia (AML) with associated increased bone marrow (BM) blast infiltration. Using a transgenic mouse model, MRP8[NRASD12/hBCL-2], in which the NRAS:BCL-2 complex at the mitochondria induces MDS progressing to AML with dysplastic features, we studied the therapeutic potential of a BCL-2 homology domain 3 mimetic inhibitor, ABT-737. Treatment significantly extended lifespan, increased survival of lethally irradiated secondary recipients transplanted with cells from treated mice compared with cells from untreated mice, with a reduction of BM blasts, Lin-/Sca-1(+)/c-Kit(+), and progenitor populations by increased apoptosis of infiltrating blasts of diseased mice assessed in vivo by technicium-labeled annexin V single photon emission computed tomography and ex vivo by annexin V/7-amino actinomycin D flow cytometry, terminal deoxynucleotidyltransferase-mediated dUTP nick end labeling, caspase 3 cleavage, and re-localization of the NRAS:BCL-2 complex from mitochondria to plasma membrane. Phosphoprotein analysis showed restoration of wild-type (WT) AKT or protein kinase B, extracellular signal-regulated kinase 1/2 and mitogen-activated protein kinase patterns in spleen cells after treatment, which showed reduced mitochondrial membrane potential. Exon specific gene expression profiling corroborates the reduction of leukemic cells, with an increase in expression of genes coding for stem cell development and maintenance, myeloid differentiation, and apoptosis. Myelodysplastic features persist underscoring targeting of BCL-2-mediated effects on MDS-AML transformation and survival of leukemic cells.


Figures

Figure 1
Figure 1
The model and protocol. (A) Schematic of the multistep process of leukemogenesis and derivation of the animal models of NRASD12 and hBCL-2–mediated MDS and AML. (B) ABT-737 treatment protocol. MA, membrane anchor.
Figure 2
Figure 2
ABT-737 rescues clinical features of AML mice. (A) Kaplan-Meier survival curves showing prolonged survival of AML mice who completed treatment with ABT-737 (n = 26, red line), mice who failed to complete treatment (n = 10, blue line), and untreated mice (n = 63, black line) plotted from date of birth (P < .0001). (B) White blood cell counts (WBC) (pretreatment vs posttreatment, P < .0001), neutrophil counts (pretreatment vs posttreatment, P < .05), lymphocytes (pretreatment vs posttreatment, P < .0001), and platelet counts (PLT) (pretreatment vs posttreatment, P < .0001) are shown (mean ± standard deviation, n = 30 mice in the pretreatment and posttreatment groups; n = 31 in the untreated group). There were no significant differences between untreated and pretreatment AML groups. (C) Percentage AML BM blasts pretreatment and posttreatment after day 33 from start of treatment (n = 6 mice). Giemsa stained BM smears showing decreased marrow blasts after treatment (shown in low power [LP × 50 magnification]) and hematoxylin and eosin stained liver sections with infiltration in the untreated mice and clearance in the treated mice postday 33. Representatives of 3 mice: (D) differential survival of mice transplanted each with 107 spleen cells from AML untreated (black) or treated (red) mice into lethally irradiated FVB/N recipients (n = 5 in each group) (log-rank χ2 = 9.496; P < .005). (E) Significant reduction in the Lin-/Sca-1+/c-Kit+ (LSK) population of untreated (n = 12) and treated (n = 8) (P < .01); untreated mice analyzed compared with WT FVB/N mice (P < .01); treated compared with WT mice (n = 6) (P ∼ .1). (F) ABT-737 targets myeloid progenitors. Dot plots showing numbers of day 7 colony-forming unit–granulocyte macrophage per 3 × 10⁴ cells plated per dish from BMs of diseased untreated and normal mice (P < .001); untreated compared with treated mice were statistically different (P < .01) (mean ± standard deviation of n = 4 mice analyzed postday 33). There was no statistical difference between the WT and post-ABT-737 treatment groups (P ∼ .3).
Figure 3
Figure 3
ABT-737 treatment-induced apoptosis of AML cells in the liver and the spleen of the mice, despite persistence of BCL-2 in the RAS-GTP complex and relocalization of the RAS:BCL-2 complex. (A) Histogram of mean ± standard deviation (SD) showing an increase of late/necrotic apoptotic cells (n = 3). (B) Paired untreated and treated radioisotope heat maps of 99mTc labeled annexin-V, which targets apoptotic cells and is metabolized in the kidney and bladder, shows greater intensity around the location of the liver in the pretreated AML mouse (day 0, n = 6), which is increased after day 23 (postday 23) after 10 injections. Histogram of mean ± SD showing an increase of apoptotic cells in AML mice after treatment (n = 5 mice), whereas WT mice do not show a significant increase in uptake of the label (WT, n = 14 untreated and n = 3 treated). (C) Representative DNA fragmentation as demonstrated by TUNEL-positive myeloid cells is significantly greater (postday 33) in the liver of mice; histogram of untreated and treated AML mice (mean ± SD of n = 4). (D) Representative western blot of spleen cells of AML mice probed with anti-caspase 3 antibody showing untreated (day 0) and caspase 3-mediated cleavage after treatment (postday 33) with reprobing with anti-βactin antibody showing protein loading. Results are representative of 3 mice. (E) Representative western blot of protein lysates from Mac-1+ and Sca-1+ enriched spleen cells of normal WT, AML untreated (day 0), and ABT-737 treated (postday 33) mice immunoprobed with cyclin D1 and D3, p21Waf1/Cip1, p15INK4B, p27Kip1, phospho-p38MAPK, BCL-xL, MCL-1, and β-actin (control for loading) (n = 2 mice).
Figure 4
Figure 4
RAS and BCL-2 status of AML mice. (A) Percentage of peripheral blood BCL-2–positive cells in 4-week-old single transgenic (n = 10), untreated at 4-weeks old (day 0, n = 11), and posttreatment mice (postday 33, n = 14) showing a significant increase in BCL-2–positive cells with disease progression and after treatment (P < .0001). (B) Representative spleen cells from WT FVB/N, single and double MRP8[NRASD12/hBCL-2] AML transgenic mice assessed for total RAS and total BCL-2 expression by western blot analysis. Active RAS-GTP levels were measured via a sensitive RAF1-RBD pull down assay followed by western blot analysis with an anti-RAS antibody. Blots were reprobed with anti β-actin antibody to assess protein loading (n = 3). (C) Double MRP8[NRASD12/hBCL-2] AML untreated (day 0) and treated (+ABT-737) mice assayed (postday 33). Mice were assessed, as in (B). Histograms of RAS-GTP and hBCL-2 normalized to actin show an increase of the hBCL-2:RAS-GTP complex. The relative values were presented as fold increase over control samples as indicated (error bar = SD; n = 3). (D) Western blot analysis showing threonine 56 and serine 70 phosphorylations of hBCL-2 of spleen cells from untreated (day 0) and treated (postday 33), with β-actin showing equal protein loading (n = 2 mice). (E) MMP measurements by DiOC2(3) show a reduction of dye uptake in ABT-737–treated WT and AML mice relative to untreated samples (minimum in each group, n = 3 mice). (F) Confocal microscopy of stained cells of BM showing subcellular localization of RAS:BCL-2 complex from the AML mice shifting from mitochondrial localization (Mito, stained with Tom20+ antibody) in untreated (−) mice to plasma membrane (PM) localization (wheat germ agglutinin (WGA) after treatment (+) on postday 33. Rows 1 and 2 show pretreatment BM samples with RAS and BCL-2 co-localizing with the mitochondria (pale), whereas the pink coloration with the WGA antibody is consistent with co-localizations of RAS and BCL-2 with virtually no plasma membrane staining; rows 3 and 4 are 2 independent mice posttreatment probed with either Tom 20 (rows 3a and 3b) or WGA (rows 4a and 4b) showing the RAS:BCL-2 complex localizing in the plasma membrane with a white color, whereas with the mitochondrial antibody, green patches are visible with pale pink coloration in row 3a consistent with RAS and BCL-2 co-localizing in the absence of mitochondrial staining (in each group, n = 2 mice).
Figure 4
Figure 4
RAS and BCL-2 status of AML mice. (A) Percentage of peripheral blood BCL-2–positive cells in 4-week-old single transgenic (n = 10), untreated at 4-weeks old (day 0, n = 11), and posttreatment mice (postday 33, n = 14) showing a significant increase in BCL-2–positive cells with disease progression and after treatment (P < .0001). (B) Representative spleen cells from WT FVB/N, single and double MRP8[NRASD12/hBCL-2] AML transgenic mice assessed for total RAS and total BCL-2 expression by western blot analysis. Active RAS-GTP levels were measured via a sensitive RAF1-RBD pull down assay followed by western blot analysis with an anti-RAS antibody. Blots were reprobed with anti β-actin antibody to assess protein loading (n = 3). (C) Double MRP8[NRASD12/hBCL-2] AML untreated (day 0) and treated (+ABT-737) mice assayed (postday 33). Mice were assessed, as in (B). Histograms of RAS-GTP and hBCL-2 normalized to actin show an increase of the hBCL-2:RAS-GTP complex. The relative values were presented as fold increase over control samples as indicated (error bar = SD; n = 3). (D) Western blot analysis showing threonine 56 and serine 70 phosphorylations of hBCL-2 of spleen cells from untreated (day 0) and treated (postday 33), with β-actin showing equal protein loading (n = 2 mice). (E) MMP measurements by DiOC2(3) show a reduction of dye uptake in ABT-737–treated WT and AML mice relative to untreated samples (minimum in each group, n = 3 mice). (F) Confocal microscopy of stained cells of BM showing subcellular localization of RAS:BCL-2 complex from the AML mice shifting from mitochondrial localization (Mito, stained with Tom20+ antibody) in untreated (−) mice to plasma membrane (PM) localization (wheat germ agglutinin (WGA) after treatment (+) on postday 33. Rows 1 and 2 show pretreatment BM samples with RAS and BCL-2 co-localizing with the mitochondria (pale), whereas the pink coloration with the WGA antibody is consistent with co-localizations of RAS and BCL-2 with virtually no plasma membrane staining; rows 3 and 4 are 2 independent mice posttreatment probed with either Tom 20 (rows 3a and 3b) or WGA (rows 4a and 4b) showing the RAS:BCL-2 complex localizing in the plasma membrane with a white color, whereas with the mitochondrial antibody, green patches are visible with pale pink coloration in row 3a consistent with RAS and BCL-2 co-localizing in the absence of mitochondrial staining (in each group, n = 2 mice).
Figure 5
Figure 5
Modification of signaling proteins after treatment. Western blot analysis showing dephosphorylation of proteins from spleen cells of (A) ERK1/2 and (B) AKT on day 0 and after ABT-737 treatment (postday 33), and normalized protein loading confirmed by probing for- β-actin (n = 2 mice). (C) Representative western blot analysis showing dephosphorylation of proteins of ppERK and pAKT of spleen cells after culturing (in triplicate) in vitro with vehicle (V), 10, 100, or 500 nM ABT-737 for 24 hours (n = 2 mice). (D) Nanoimmunoassay using the NanoPro (ProteinSimple) isoelectric focusing for detection of MEK signatures. Representative trace of spleen cells of WT FVB/N and AML untreated mice (day 0) and after ABT-737 treatment (postday 33) showing the dephosphorylated isoform pMEK2-3 and restoration of MEK2 expression (arrowed); histogram showing restoration of normal FVB/N signatures of the different isoforms after treatment. Each reaction was done in triplicate. Representative of at least 2 mice (n = 2) in each group.
Figure 6
Figure 6
ABT-737 treatment-induced differential regulation and activation of pathways implicated in cell survival and proliferation assayed by gene expression profiling. Exon specific microarray heat maps of Sca-1+ purified spleen cells from untreated (day 0) and ABT-737 treated (postday 33) of AML mice relative to WT FVB/N. Each row (1-6) represents an independent mouse (n = 3) in each group (GEO accession no. GSE48601).

References

    1. Padua RA, Guinn BA, Al-Sabah AI, et al. RAS, FMS and p53 mutations and poor clinical outcome in myelodysplasias: a 10-year follow-up. Leukemia. 1998;12(6):887–892. - PubMed
    1. Kogan SC, Lagasse E, Atwater S, et al. The PEBP2betaMYH11 fusion created by Inv(16)(p13;q22) in myeloid leukemia impairs neutrophil maturation and contributes to granulocytic dysplasia. Proc Natl Acad Sci USA. 1998;95(20):11863–11868. - PMC - PubMed
    1. Omidvar N, Kogan S, Beurlet S, et al. BCL-2 and mutant NRAS interact physically and functionally in a mouse model of progressive myelodysplasia. Cancer Res. 2007;67(24):11657–11667. - PubMed
    1. Lagasse E, Weissman IL. bcl-2 inhibits apoptosis of neutrophils but not their engulfment by macrophages. J Exp Med. 1994;179(3):1047–1052. - PMC - PubMed
    1. Parker JE, Mufti GJ. The myelodysplastic syndromes: a matter of life or death. Acta Haematol. 2004;111(1-2):78–99. - PubMed

Publication types

MeSH terms