

Viral suppression following switch to second-line antiretroviral therapy: associations with nucleoside reverse transcriptase inhibitor resistance and subtherapeutic drug concentrations prior to switch
- PMID: 23943851
- PMCID: PMC3923537
- DOI: 10.1093/infdis/jit411
Viral suppression following switch to second-line antiretroviral therapy: associations with nucleoside reverse transcriptase inhibitor resistance and subtherapeutic drug concentrations prior to switch
Abstract
Background: High rates of second-line antiretroviral treatment (ART) failure are reported. The association with resistance and nonadherence on switching to second-line ART requires clarification.
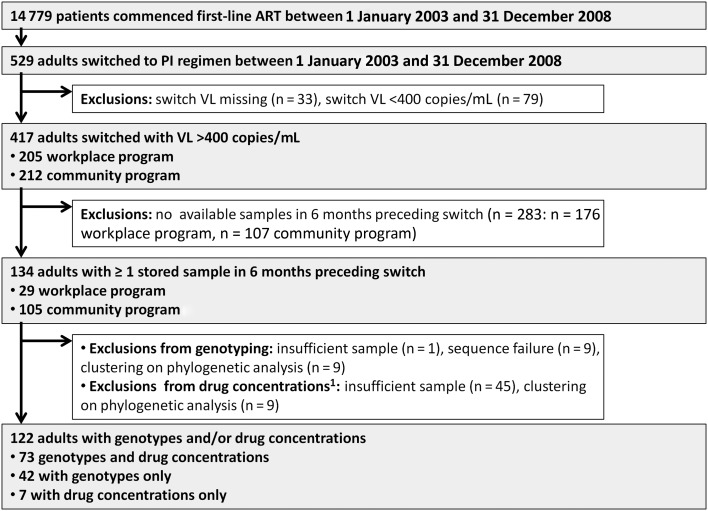
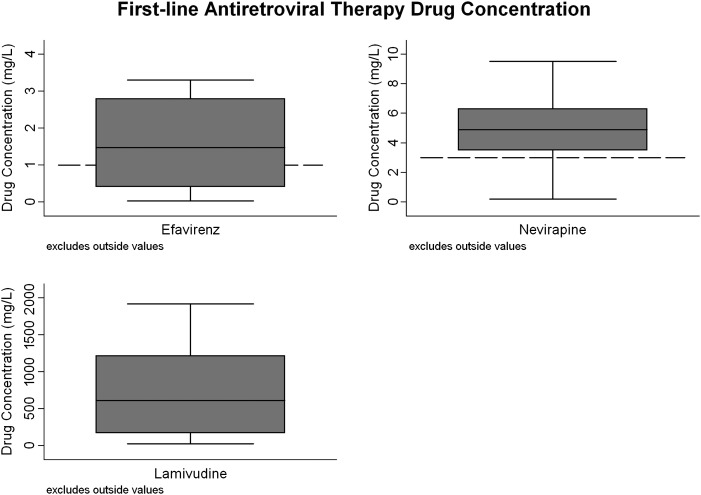
Methods: Using prospectively collected data from patients in South Africa, we constructed a cohort of patients switched to second-line ART (1 January 2003 through 31 December 2008). Genotyping and drug concentrations (lamivudine, nevirapine, and efavirenz) were measured on stored samples preswitch. Their association with viral load (VL) <400 copies/mL by 15 months was assessed using modified Poisson regression.
Results: One hundred twenty-two of 417 patients (49% male; median age, 36 years) had genotyping (n = 115) and/or drug concentrations (n = 80) measured. Median CD4 count and VL at switch were 177 cells/µL (interquartile range [IQR], 77-263) and 4.3 log10 copies/mL (IQR, 3.8-4.7), respectively. Fifty-five percent (n = 44/80) had subtherapeutic drug concentrations preswitch. More patients with therapeutic vs subtherapeutic ART had resistance (n = 73): no major mutations (3% vs 51%), nonnucleoside reverse transcriptase inhibitor (94% vs 44%), M184V/I (94% vs 26%), and ≥ 1 thymidine analogue mutations (47% vs 18%), all P = .01; and nucleoside reverse transcriptase inhibitor (NRTI) cross-resistance mutations (26% vs 13%, P = .23). Following switch, 68% (n = 83/122) achieved VL <400 copies/mL. Absence of NRTI mutations and subtherapeutic ART preswitch were associated with failure to achieve VL <400 copies/mL.
Conclusions: Nonadherence, suggested by subtherapeutic ART with/without major resistance mutations, significantly contributed to failure when switching regimen. Unresolved nonadherence, not NRTI resistance, drives early second-line failure.
Keywords: adherence; resistance; second-line antiretroviral therapy; virological failure.
Figures
References
-
- World Health Organization. Antiretroviral therapy for HIV infection in adults and adolescents: recommendations for a public health approach. http://www.who.int/hiv/pub/arv/adult2010/en. Accessed 15 September 2012. - PubMed
-
- Southern African HIV Clinicians Society. Guidelines for antiretroviral therapy in adults. www.sahivsoc.org. Accessed 15 September 2012. - PMC - PubMed
-
- National Department of Health, South Africa. Clinical guidelines for the management of HIV and AIDS in adults and adolescents. http://www.fidssa.co.za/Guidelines/2010_Adult_ART_Guidelines.pdf. Accessed 15 September 2012.
-
- Ajose O, Mookerjee S, Mills EJ, Boulle A, Ford N. Treatment outcomes of patients on second-line antiretroviral therapy in resource-limited settings: a systematic review and meta-analysis. AIDS. 2012;26:929–38. - PubMed
-
- Fox MP, Ive P, Long L, Maskew M, Sanne I. High rates of survival, immune reconstitution, and virologic suppression on second-line antiretroviral therapy in South Africa. J Acquir Immune Defic Syndr. 2010;53:500–6. - PubMed
Publication types
MeSH terms
Substances
Grants and funding
LinkOut - more resources
Full Text Sources
Other Literature Sources
Medical
Molecular Biology Databases
Research Materials
