. 2013 Oct 15;126(Pt 20):4756-68.
doi: 10.1242/jcs.132969. Epub 2013 Aug 13.

Myosin X and its motorless isoform differentially modulate dendritic spine development by regulating trafficking and retention of vasodilator-stimulated phosphoprotein

Affiliations

Myosin X and its motorless isoform differentially modulate dendritic spine development by regulating trafficking and retention of vasodilator-stimulated phosphoprotein

Wan-Hsin Lin et al. J Cell Sci. .

Abstract

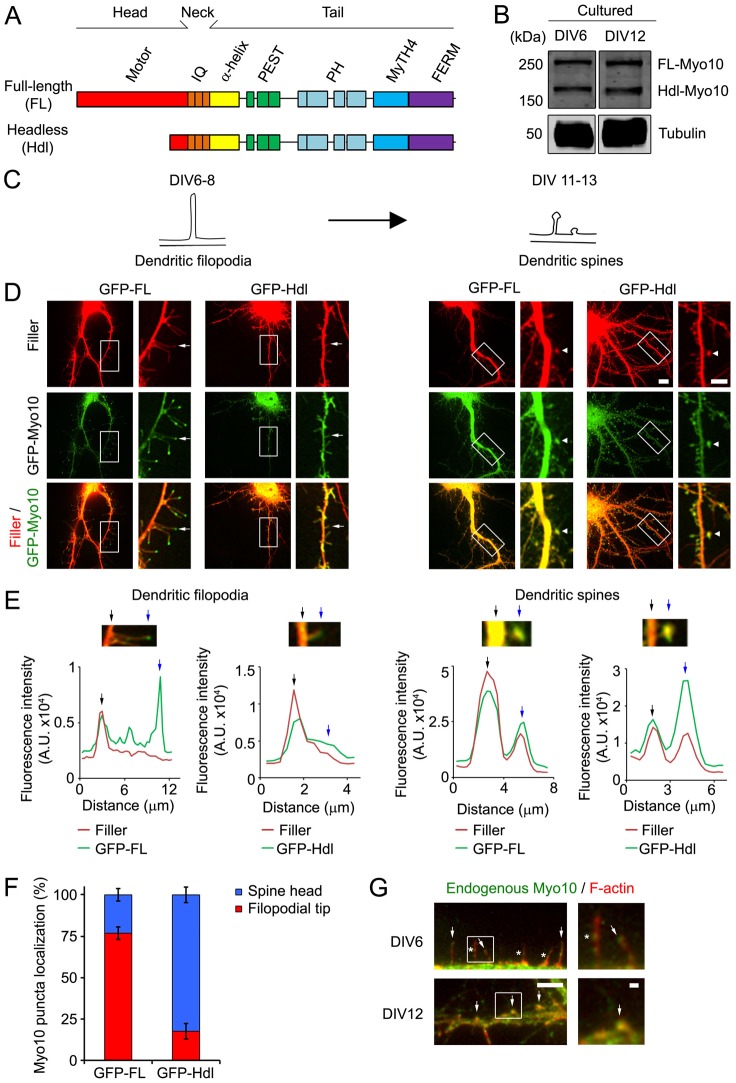
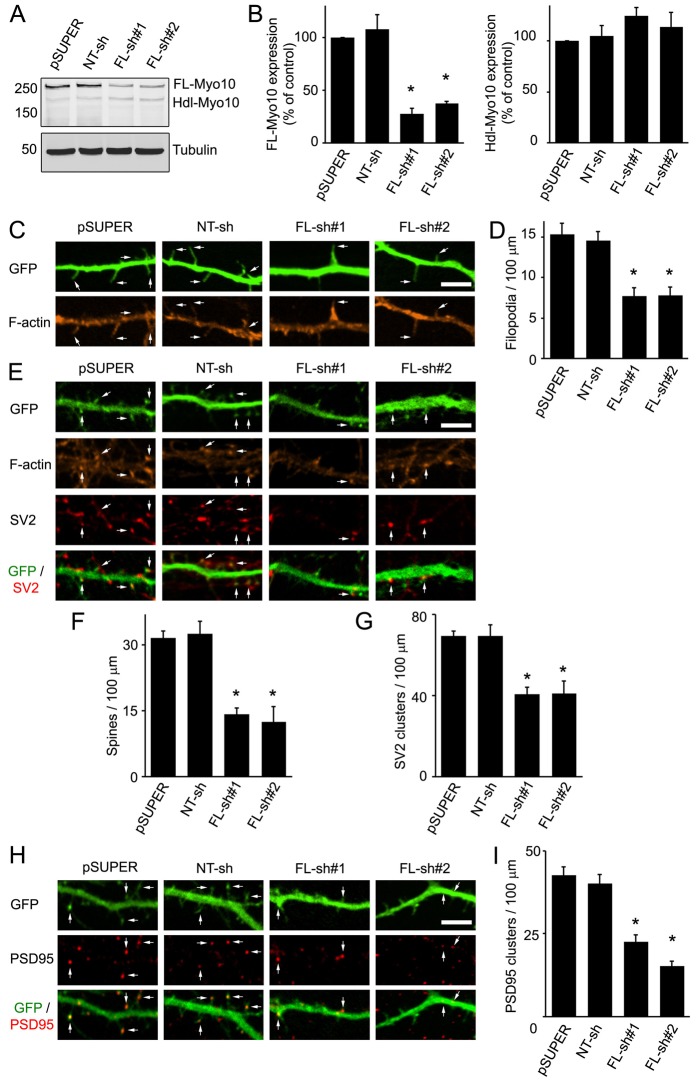
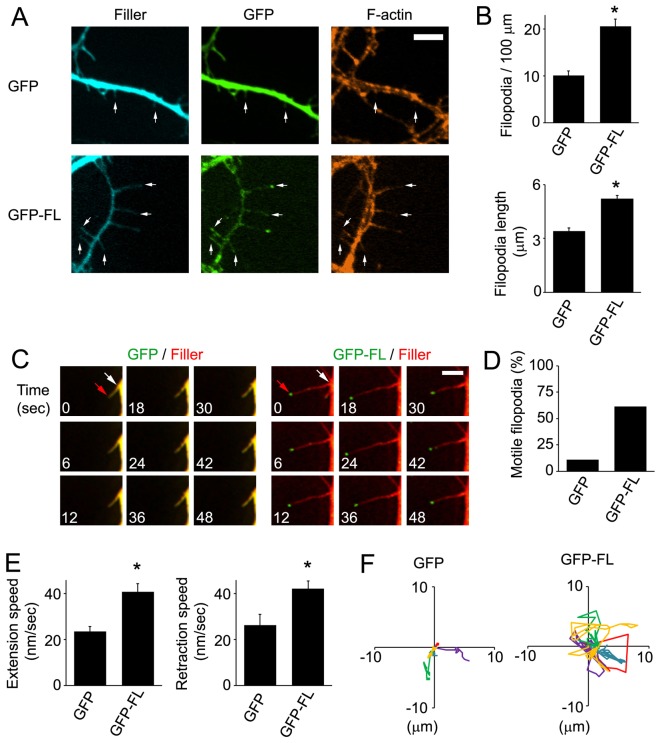
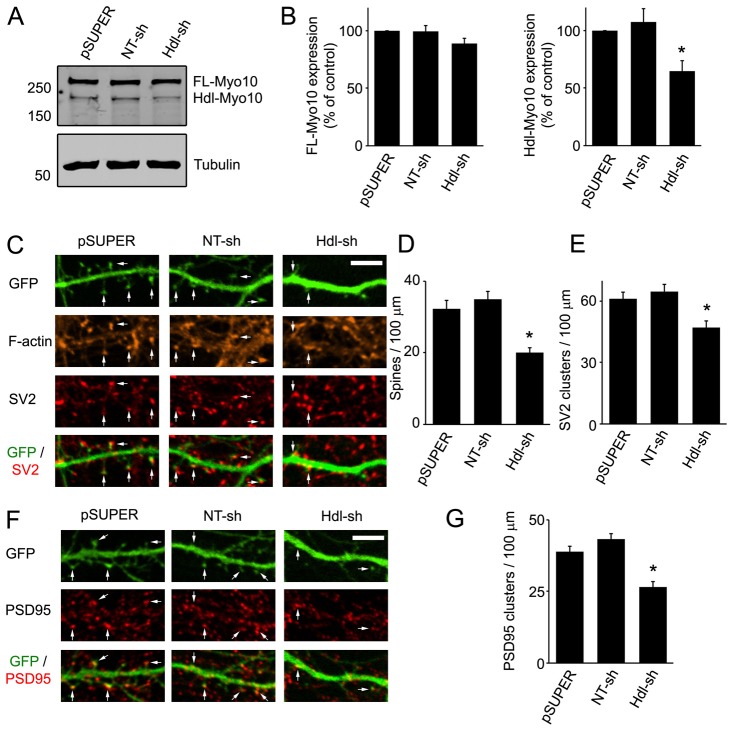
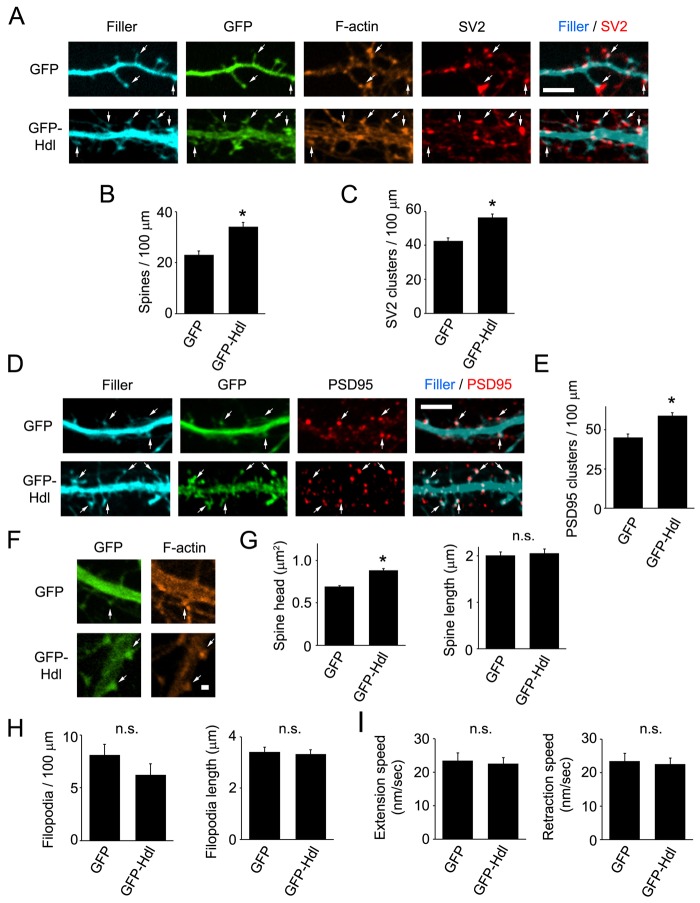
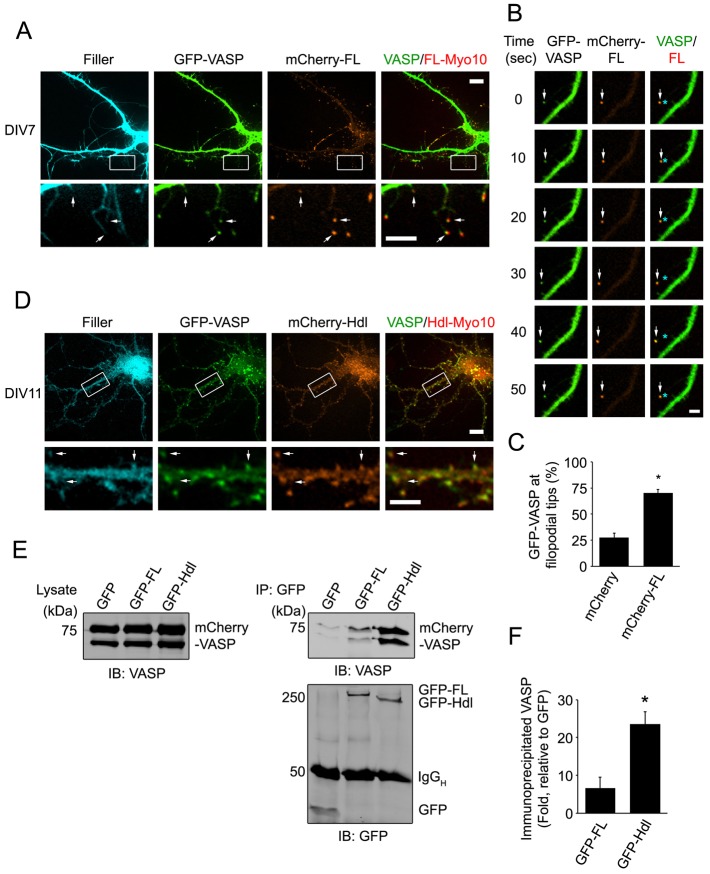
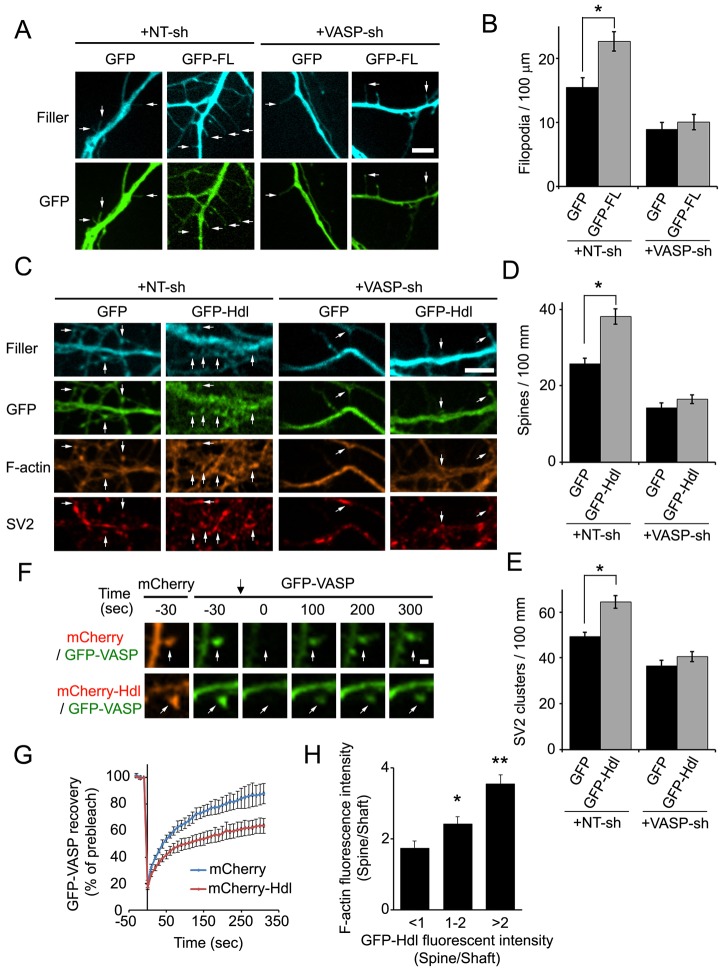
Myosin X (Myo10) is an unconventional myosin with two known isoforms: full-length (FL)-Myo10 that has motor activity, and a recently identified brain-expressed isoform, headless (Hdl)-Myo10, which lacks most of the motor domain. FL-Myo10 is involved in the regulation of filopodia formation in non-neuronal cells; however, the biological function of Hdl-Myo10 remains largely unknown. Here, we show that FL- and Hdl-Myo10 have important, but distinct, roles in the development of dendritic spines and synapses in hippocampal neurons. FL-Myo10 induces formation of dendritic filopodia and modulates filopodia dynamics by trafficking the actin-binding protein vasodilator-stimulated phosphoprotein (VASP) to the tips of filopodia. By contrast, Hdl-Myo10 acts on dendritic spines to enhance spine and synaptic density as well as spine head expansion by increasing the retention of VASP in spines. Thus, this study demonstrates a novel biological function for Hdl-Myo10 and an important new role for both Myo10 isoforms in the development of dendritic spines and synapses.

Keywords: Dendritic spine; Filopodia; Hippocampal neuron; Myosin; Synapse.


Figures

Fig. 1.
Fig. 1.
FL-Myo10 localizes to the tips of dendritic filopodia, whereas Hdl-Myo10 is enriched in spine heads. (A) A schematic illustrating the domains of Myo10 isoforms. (B) Cell lysates from DIV6 and DIV12 cultured hippocampal neurons, which were isolated from E19 rat embryos, were subjected to SDS-PAGE and immunoblotted for Myo10 (upper panels) and α-tubulin (lower panels) as a loading control. (C) A schematic denoting the time-period of spine development used in this study. Dendritic filopodia, which are precursors of dendritic spines, are the prevalent type of protrusions at DIV6–DIV8, whereas dendritic spines are predominant at DIV11–DIV13. Spines comprise a bulbous head that connects either directly to the dendritic shafts (on right) or by means of a thin neck (on left). (D) Neurons were co-transfected at DIV6 with either GFP–FL-Myo10 or GFP–Hdl-Myo10 and a fluorescent filler, mCerulean. Cells were then subjected to live-cell imaging one and six days after transfection to visualize dendritic filopodia and spines, respectively. mCerulean fluorescent filler is false-colored red. Scale bar: 10 µm. Higher magnification images of the boxed regions are shown on the right. Scale bar: 5 µm. Dendritic filopodia (arrows) and spines (arrow heads) are indicated. (E) To illustrate the localization of Myo10 isoforms to the tips of dendritic filopodia and to dendritic spines, linescan analyses were performed. The fluorescence intensities of the fluorescent filler (red) and GFP–Myo10 (green) through the dendrites and along the extended protrusions were graphed as a function of distance. The base (black arrow) and the tip (blue arrow) of dendritic protrusions are indicated. (F) Neurons (DIV5–DIV6) were transfected with GFP–FL-Myo10 and GFP–Hdl-Myo10, and the subcellular localization of the Myo10 isoforms was examined at DIV8. Quantification of the percentage of GFP–FL-Myo10 and GFP–Hdl-Myo10 puncta that localize to the tips of dendritic filopodia and spine heads is shown. Error bars represent the s.e.m. for 26 dendrites from three independent experiments. (G) DIV6 (top panels) and DIV12 (bottom panels) neurons were co-immunostained for endogenous Myo10 (green) and F-actin (red) to visualize dendritic filopodia and spines. Endogenous Myo10 localizes to the tips (arrows, top panels) and shafts (asterisk, top panels) of dendritic filopodia in DIV6 neurons. Myo10 is enriched in spine heads in DIV12 neurons (arrows, bottom panel). Scale bar: 5 µm. Higher magnification images of the boxed regions are shown (right panels). Scale bar: 1 µm.
Fig. 2.
Fig. 2.
Knockdown of FL-Myo10 impedes the formation of dendritic filopodia and subsequently spines and synapses. (A) Rat astrocytes (DIV14–DIV17) were transfected with empty pSUPER vector, a non-targeting shRNA (NT-sh) or FL-Myo10 shRNAs (FL-sh#1, FL-sh#2). Three to five days after transfection, cell lysates were immunoblotted for Myo10 (top panel) and α-tubulin (bottom panel) as a loading control. (B) Quantification of endogenous levels of FL-Myo10 (left panel) and Hdl-Myo10 (right panel) from at least three separate experiments is shown. Error bars represent the s.e.m. (*P<0.0001). (C) Neurons (DIV3–DIV4) were co-transfected with GFP and empty pSUPER vector, NT shRNA or FL-Myo10 shRNAs, fixed and stained for F-actin using Alexa Fluor 546 phalloidin at DIV6–DIV7. Dendritic filopodia, which are thin protrusions without F-actin enrichment to their tips (arrows), are significantly reduced in neurons transfected with FL-Myo10 shRNA. Scale bar: 5 µm. (D) Quantification of the dendritic filopodia density in neurons transfected with the indicated constructs is shown. Error bars represent the s.e.m. for 40–50 dendrites from three separate experiments (*P<0.0001). (E,H) Neurons (DIV3–DIV4) were co-transfected with GFP and empty pSUPER vector, NT shRNA or FL-Myo10 shRNAs, fixed and stained for F-actin and synaptic markers (SV2, PSD95) at DIV11–DIV12. Spines, which exhibit a bulbous, F-actin-enriched head structure and contact SV2 or contain PSD95 clusters, are indicated (arrows). Scale bar: 5 µm. (F,G,I) Quantifications of dendritic spine and synaptic density (SV2 and PSD95 clusters) from neurons transfected with the indicated constructs are shown. Error bars represent the s.e.m. for 40–50 dendrites from at least three separate experiments (*P<0.0001). For panels B,D,F,G,I, asterisks indicate a statistically significant difference compared with pSUPER-transfected cells.
Fig. 3.
Fig. 3.
GFP–FL-Myo10 expression increases the density, length and dynamics of dendritic filopodia. (A) Neurons were co-transfected with either GFP–FL-Myo10 (GFP-FL) or GFP and a fluorescent filler, mCerulean, at DIV5, fixed and stained for F-actin at DIV6–DIV7. Dendritic filopodia are indicated (arrows). Scale bar: 5 µm. (B) Quantifications of the density (top panel) and the length (bottom panel) of dendritic filopodia from neurons transfected with the indicated constructs are shown. Error bars represent the s.e.m. for 40–50 dendrites (top panel) or 100 filopodia (bottom panel) from at least three separate experiments (*P<0.0001). (C–F) Neurons at DIV5 were co-transfected with either GFP–FL-Myo10 or GFP and a fluorescent filler, mCerulean or mCherry, and used for live-cell imaging the next day (DIV6). (C) Images were collected every 3 seconds using a Quorum spinning disk confocal microscope. The montage of images shows the extension and retraction of dendritic filopodia over time. In the first image, the tips (red arrows) and bases (white arrows) of dendritic filopodia are indicated. mCerulean fluorescent filler is false-colored red. Scale bar: 5 µm. (D) The percentage of motile filopodia was quantified from GFP–FL-Myo10- and GFP-expressing neurons. A total of 68–89 protrusions from at least three separate experiments were analyzed. (E) Quantification of speed of extension and retraction during the recording time is shown. Images were collected every 10 seconds for 10 minutes. Error bars represent the s.e.m. for 68–89 protrusions from three separate experiments (*P<0.0001). (F) Rose plots tracking the movement of five dendritic filopodia, in different colors, from neurons expressing GFP–FL-Myo10 and GFP are shown. GFP–FL-Myo10 expression results in vigorous lateral movement of dendritic filopodia.
Fig. 4.
Fig. 4.
Knockdown of Hdl-Myo10 impairs dendritic spine and synapse formation. (A) Rat astrocytes (DIV14–DIV17) were transfected with empty pSUPER vector, a non-targeting shRNA (NT-sh) or Hdl-Myo10 shRNA (Hdl-sh). Four to five days after transfection, cell lysates were immunoblotted for Myo10 (top panel) and α-tubulin (bottom panel) as a loading control. (B) Quantifications of endogenous levels of FL-Myo10 (left panel) and Hdl-Myo10 (right panel) from at least three separate experiments are shown. Error bars represent the s.e.m. (*P<0.0015). (C,F) Neurons (DIV5–DIV6) were co-transfected with GFP and empty pSUPER vector, NT shRNA or Hdl-Myo10 shRNA, fixed and stained for F-actin and synaptic markers (SV2, PSD95) at DIV11–DIV12. Spines are indicated (arrows). Scale bar: 5 µm. (D,E,G) Quantification of dendritic spine and synaptic density (SV2 and PSD95 clusters) from neurons transfected with the indicated constructs is shown. Error bars represent the s.e.m. for 40–50 dendrites from at least three separate experiments (panels D,G, *P<0.0001; panel E, *P<0.003). For panels B,D,E,G, asterisks indicate a statistically significant difference compared with pSUPER-transfected cells.
Fig. 5.
Fig. 5.
Expression of GFP–Hdl-Myo10 enhances dendritic spine and synaptic density and increases spine head size. (A–E) Neurons (DIV5–DIV6) were co-transfected with either GFP–Hdl-Myo10 (GFP-Hdl) or GFP and a fluorescent filler, mCerulean, fixed and stained for F-actin and synaptic markers (SV2, PSD95) at DIV11–DIV12. (A,D) Spine heads have an enrichment of F-actin and colocalize with synaptic proteins (arrows). Scale bar: 5 µm. (B,C,E) Quantifications of the dendritic spine and synaptic density (SV2 and PSD95 clusters) from neurons transfected with GFP–Hdl-Myo10 or GFP are shown. Error bars represent the s.e.m. for 43–45 dendrites from three separate experiments (*P<0.0001). (F) Neurons (DIV5–DIV6) were transfected with GFP–Hdl-Myo10 or GFP, fixed and stained for F-actin at DIV11–DIV12. Scale bar: 1 µm. (G) Quantifications of spine head size and spine length for neurons expressing GFP–Hdl-Myo10 or GFP are shown. Error bars represent the s.e.m. for 200 spines from three separate experiments (*P<0.0001). (H) Neurons at DIV6–DIV7 were co-transfected with a fluorescent filler, mCerulean, and either GFP or GFP–Hdl-Myo10, and dendritic filopodia were analyzed at DIV7–DIV8. Quantifications of the density (left panel) and length (right panel) of dendritic filopodia from neurons expressing GFP or GFP–Hdl-Myo10 (GFP-Hdl) are shown. Error bars represent the s.e.m. for 33–39 dendrites (left panel) and 102–104 dendritic filopodia from three separate experiments. (I) Neurons at DIV5 were co-transfected with a fluorescent filler, mCherry, and either GFP or GFP–Hdl-Myo10 and subjected to live-cell imaging the next day (DIV6). Images were collected every 10 seconds for 10 minutes. Quantifications of the speed of extension and retraction of dendritic filopodia from neurons expressing GFP or GFP–Hdl-Myo10 are shown. A total of 63–89 protrusions from at least three separate experiments were analyzed. Error bars represent the s.e.m. for 63–89 protrusions from three separate experiments. For panels G–I, n.s. denotes the absence of a statistically significant difference.
Fig. 6.
Fig. 6.
VASP colocalizes with both FL-Myo10 and Hdl-Myo10. (A) Neurons were co-transfected with GFP–VASP, mCherry–FL-Myo10 (mCherry-FL) and a fluorescent filler, mCerulean, at DIV6 and then subjected to live-cell imaging at DIV7 (upper panels). Scale bar: 10 µm. Higher-magnification images of the boxed regions are shown (lower panels). Scale bar: 5 µm. GFP–VASP and mCherry–FL-Myo10 puncta at the tips of dendritic filopodia are indicated (arrows). (B) A dendritic filopodium from a neuron transfected with GFP–VASP and mCherry–FL-Myo10 is shown. The mosaic of images shows a GFP–VASP punctum co-trafficking with mCherry–FL-Myo10 (arrows). Asterisks denote the original position of VASP or FL-Myo10 puncta. Scale bar: 1 µm. (C) Neurons were co-transfected with GFP–VASP, a fluorescent filler, mCerulean, and either mCherry or mCherry–FL-Myo10. A quantification of GFP–VASP localization (percentage) to dendritic filopodia tips from neurons expressing mCherry or mCherry–FL-Myo10 is shown. Error bars represent the s.e.m. for 30–36 cells from three separate experiments (*P <0.0001). (D) Neurons were co-transfected with GFP–VASP, mCherry–Hdl-Myo10 (mCherry-Hdl) and a fluorescent filler, mCerulean, at DIV6 and then subjected to live-cell imaging at DIV11 (top panels). Scale bar: 10 µm. Higher magnification images of the boxed regions are shown (lower panels). Scale bar: 5 µm. GFP–VASP and mCherry–Hdl-Myo10 puncta at spine heads are indicated (arrows). (E) HEK-293T cells were co-transfected with mCherry-VASP and either GFP, GFP–FL-Myo10 or GFP–Hdl-Myo10. 24 hours after transfection, cells were treated with cytochalasin D (2 µm) for 1 hour and then lysed. GFP and GFP–Myo10 isoforms were immunoprecipitated from cell lysates and subjected to immunoblot analysis. mCherry–VASP from total lysates (left panel) and immunoprecipitated complexes (upper right panel) were detected using an antibody against VASP. GFP and GFP–Myo10 isoforms from immunoprecipitated complexes were visualized with an antibody against GFP (lower right panel). (F) Quantifications of immunoprecipitated VASP from cells transfected with GFP–FL-Myo10 or GFP–Hdl-Myo10 are shown. Error bars represent the s.e.m. from three separate experiments (*P<0.02).
Fig. 7.
Fig. 7.
FL-Myo10 and Hdl-Myo10 regulate dendritic spine and synapse development through VASP. (A) Neurons were co-transfected with a fluorescent filler, mCerulean, and either GFP or GFP–FL-Myo10 (GFP-FL) and NT shRNA (NT-sh) or VASP shRNA (VASP-sh) at DIV3–DIV4 and fixed at DIV6–DIV7. Dendritic filopodia are indicated (arrows). Scale bar: 5 µm. (B) Quantifications of the density of dendritic filopodia from neurons transfected with the indicated constructs are shown. Error bars represent the s.e.m. for 44–47 dendrites from three separate experiments (*P<0.002). (C) Neurons were co-transfected with vectors fluorescent filler, mCerulean, and either GFP or GFP–Hdl-Myo10 (GFP-Hdl) and either NT shRNA or VASP shRNA at DIV3–DIV4, fixed and stained for F-actin and SV2 at DIV11–DIV12. Dendritic spines are indicated (arrows). Scale bar: 5 µm. (D,E) Quantifications of dendritic spine and synaptic density (SV2 clusters) from neurons transfected with the indicated constructs are shown. Error bars represent the s.e.m. for 44–47 dendrites from three separate experiments (*P<0.0001). (F) Neurons were co-transfected with GFP–VASP and either mCherry–Hdl-Myo10 (mCherry-Hdl) or mCherry at DIV6, and the indicated spines (white arrows) were subjected to FRAP at DIV11. Prebleached and subsequent recovery images are shown. The photobleach point is indicated (black arrow at t = 0). Scale bar: 1 µm. (G) Quantifications of the recovery of GFP–VASP after photobleaching in neurons expressing mCherry or mCherry–Hdl-Myo10 are shown. Error bars represent the s.e.m. from three separate experiments for 40–42 spines. (H) Neurons (DIV5–DIV6) were co-transfected with GFP–Hdl-Myo10 and a fluorescent filler, mCerulean, fixed and stained for F-actin at DIV11–DIV12. The fluorescence intensities of GFP–Hdl-Myo10 (GFP–Hdl) and F-actin were quantified in dendritic spine heads and normalized to neighboring shafts. A total of 81 spines from three separate experiments were analyzed and categorized based on their amount of GFP–Hdl-Myo10. Error bars represent the s.e.m. for 15–35 spines from three separate experiments (*P<0.02, **P<0.0001). Asterisks indicate a statistically significant difference compared with the first category (GFP–Hdl <1).

References

    1. Allison D. W., Gelfand V. I., Spector I., Craig A. M. (1998). Role of actin in anchoring postsynaptic receptors in cultured hippocampal neurons: differential attachment of NMDA versus AMPA receptors. J. Neurosci. 18, 2423–2436 - PMC - PubMed
    1. Almagro S., Durmort C., Chervin-Pétinot A., Heyraud S., Dubois M., Lambert O., Maillefaud C., Hewat E., Schaal J. P., Huber P. et al.(2010). The motor protein myosin-X transports VE-cadherin along filopodia to allow the formation of early endothelial cell-cell contacts. Mol. Cell. Biol. 30, 1703–1717 10.1128/MCB.01226-09 - DOI - PMC - PubMed
    1. Berg J. S., Cheney R. E. (2002). Myosin-X is an unconventional myosin that undergoes intrafilopodial motility. Nat. Cell Biol. 4, 246–250 10.1038/ncb762 - DOI - PubMed
    1. Berg J. S., Derfler B. H., Pennisi C. M., Corey D. P., Cheney R. E. (2000). Myosin-X, a novel myosin with pleckstrin homology domains, associates with regions of dynamic actin. J. Cell Sci. 113, 3439–3451 - PubMed
    1. Bohil A. B., Robertson B. W., Cheney R. E. (2006). Myosin-X is a molecular motor that functions in filopodia formation. Proc. Natl. Acad. Sci. USA 103, 12411–12416 10.1073/pnas.0602443103 - DOI - PMC - PubMed

Publication types

MeSH terms

LinkOut - more resources