. 2013 Sep;123(9):3983-96.
doi: 10.1172/JCI65842. Epub 2013 Aug 15.

Intestinal epithelial vitamin D receptor signaling inhibits experimental colitis

Affiliations

Intestinal epithelial vitamin D receptor signaling inhibits experimental colitis

Weicheng Liu et al. J Clin Invest. 2013 Sep.

Abstract

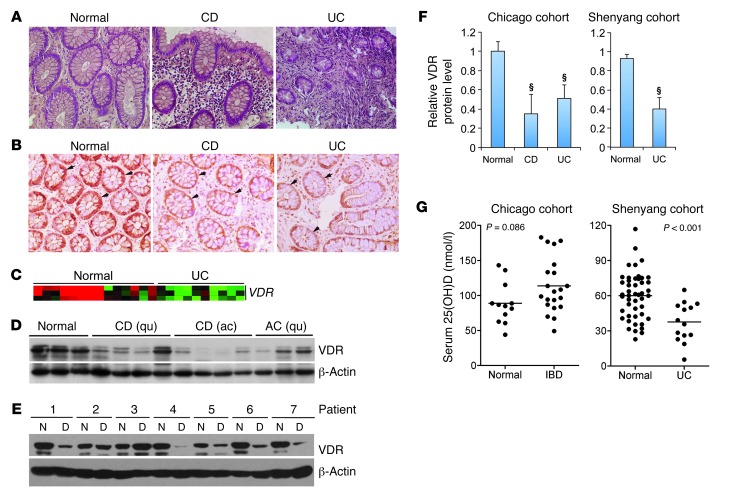
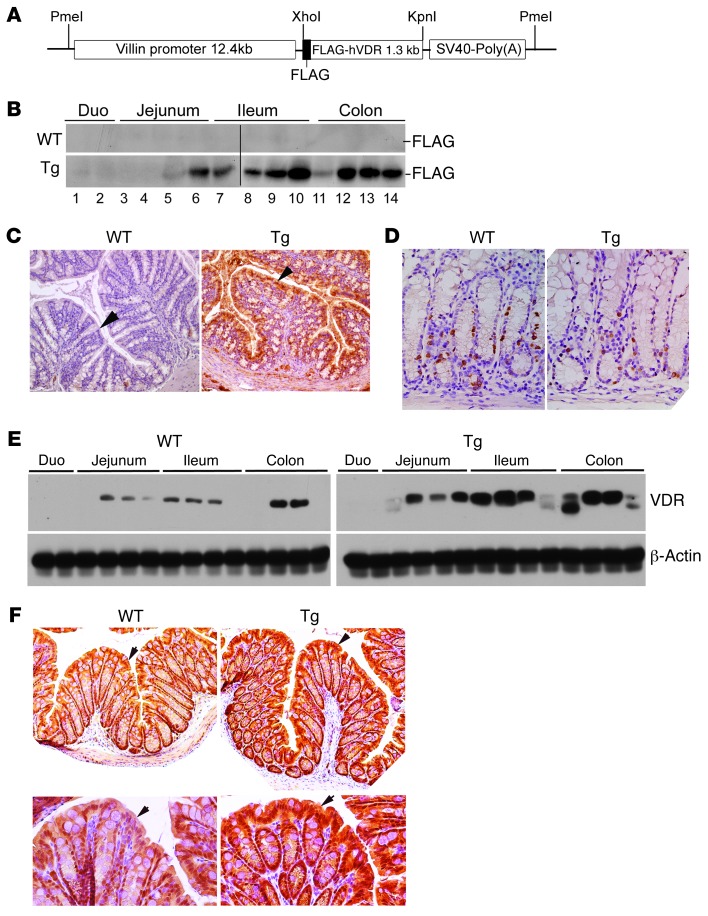
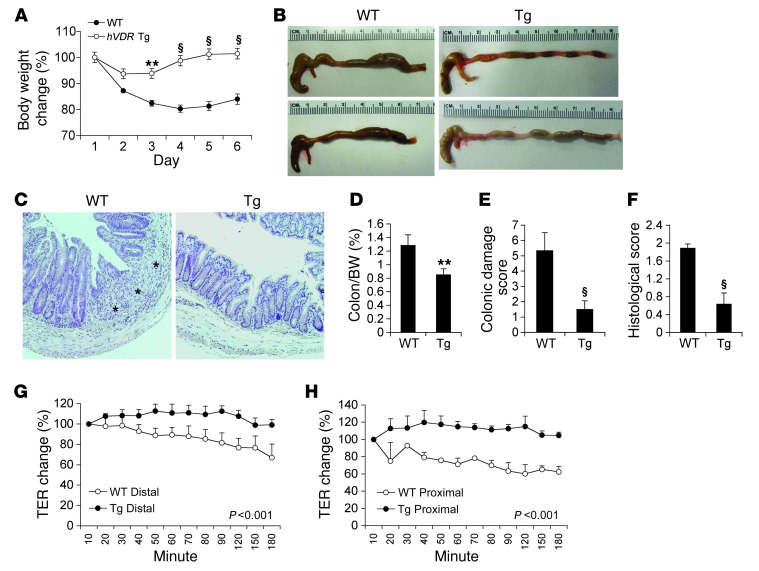
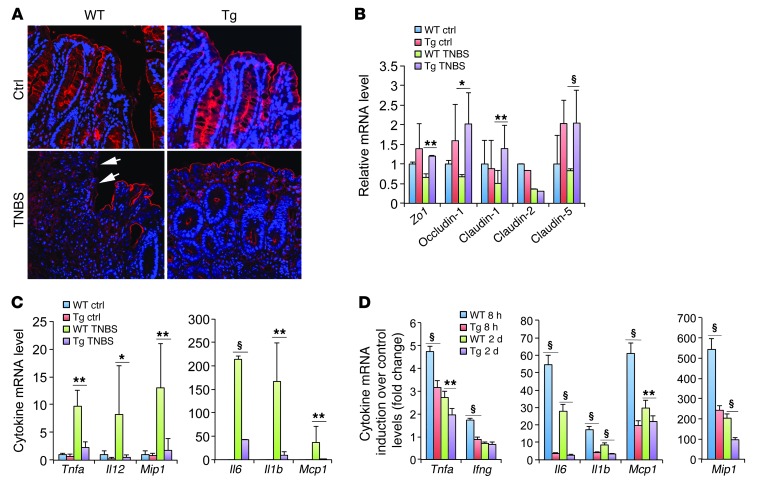
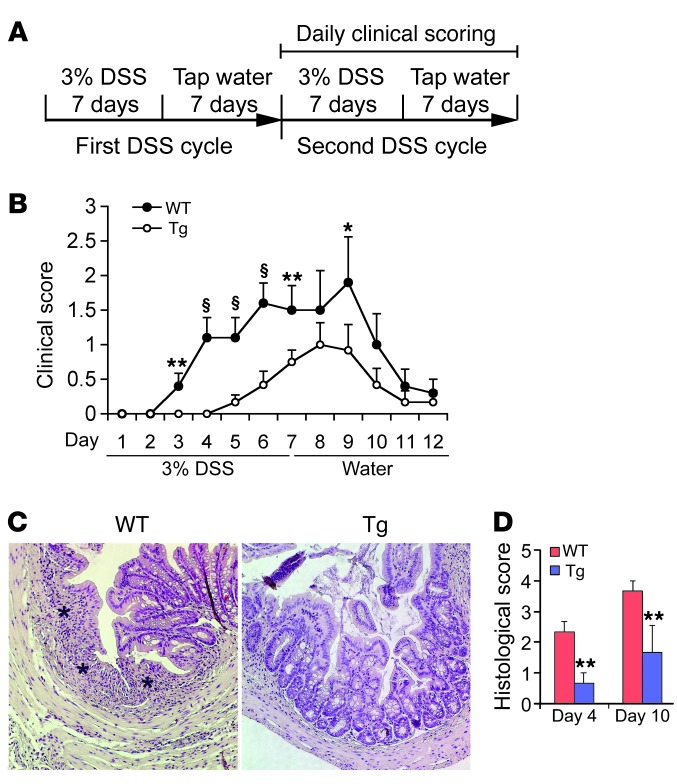
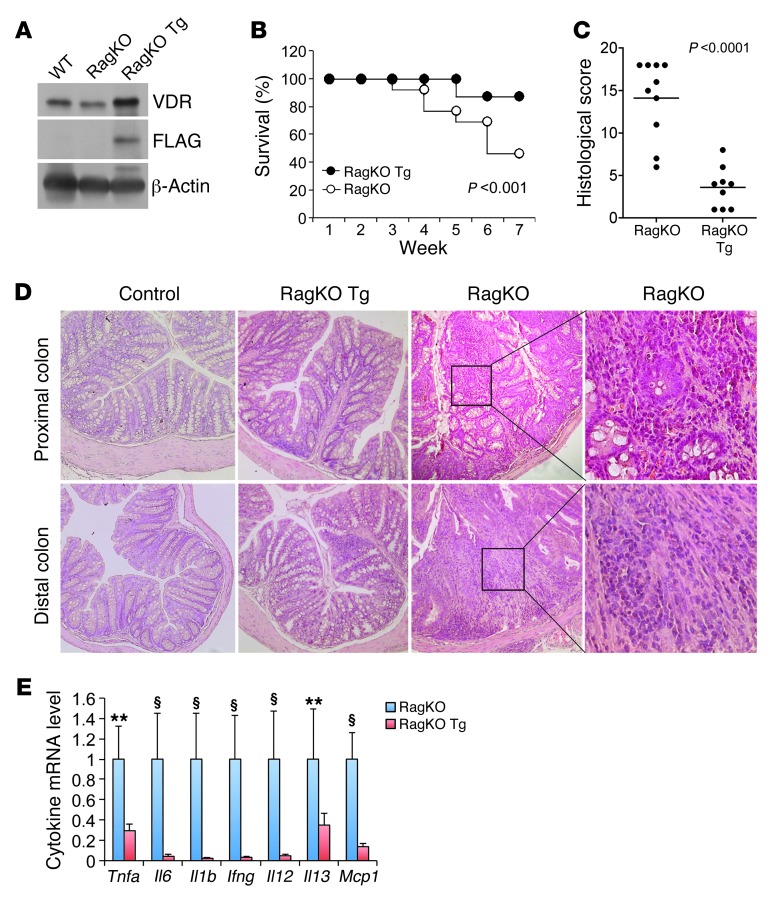
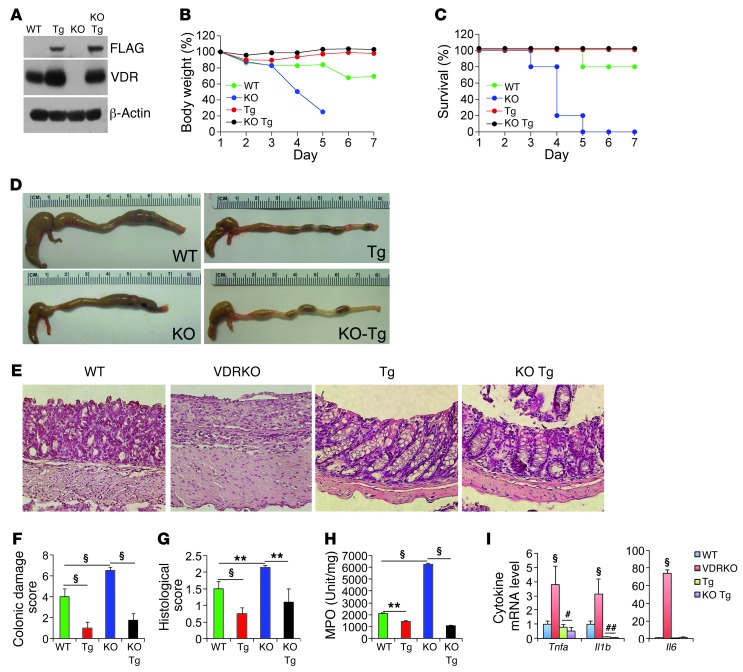
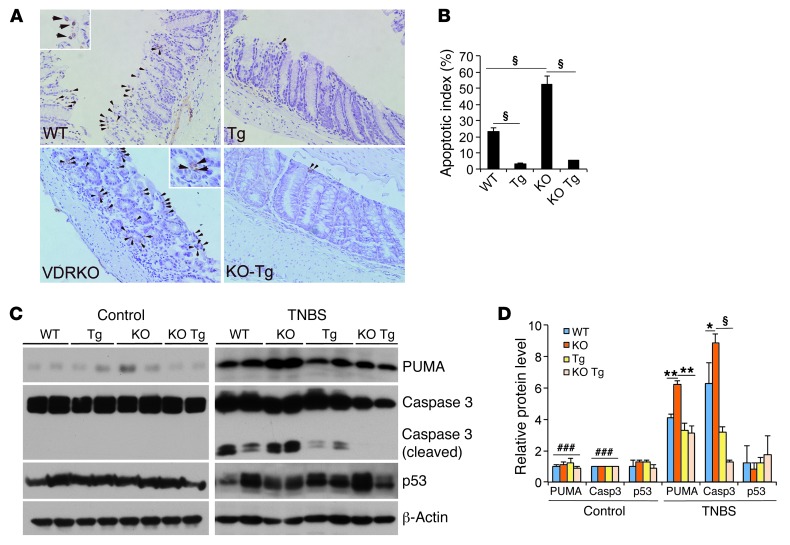
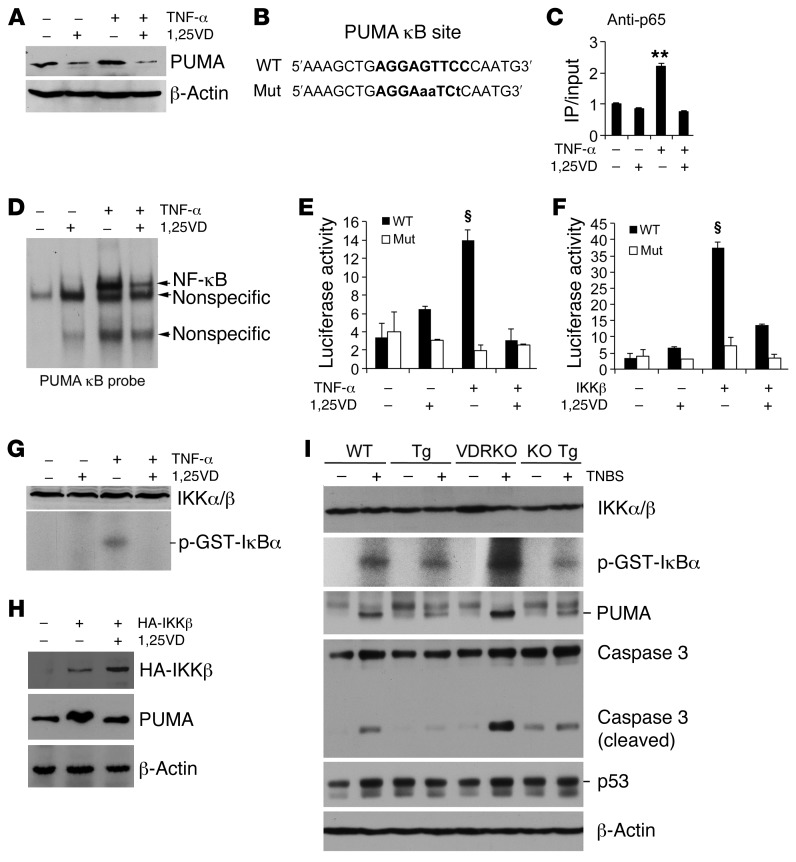
The inhibitory effects of vitamin D on colitis have been previously documented. Global vitamin D receptor (VDR) deletion exaggerates colitis, but the relative anticolitic contribution of epithelial and nonepithelial VDR signaling is unknown. Here, we showed that colonic epithelial VDR expression was substantially reduced in patients with Crohn's disease or ulcerative colitis. Moreover, targeted expression of human VDR (hVDR) in intestinal epithelial cells (IECs) protected mice from developing colitis. In experimental colitis models induced by 2,4,6-trinitrobenzenesulfonic acid, dextran sulfate sodium, or CD4(+)CD45RB(hi) T cell transfer, transgenic mice expressing hVDR in IECs were highly resistant to colitis, as manifested by marked reductions in clinical colitis scores, colonic histological damage, and colonic inflammation compared with WT mice. Reconstitution of Vdr-deficient IECs with the hVDR transgene completely rescued Vdr-null mice from severe colitis and death, even though the mice still maintained a hyperresponsive Vdr-deficient immune system. Mechanistically, VDR signaling attenuated PUMA induction in IECs by blocking NF-κB activation, leading to a reduction in IEC apoptosis. Together, these results demonstrate that gut epithelial VDR signaling inhibits colitis by protecting the mucosal epithelial barrier, and this anticolitic activity is independent of nonepithelial immune VDR actions.


Figures

Figure 1
Figure 1. Reduced VDR expression in patients with IBD.
(A) Representative H&E histology of colonic biopsies obtained from normal subjects and CD and UC patients. Original magnification, ×100. (B) Representative immunostaining of colonic biopsies from normal control and CD and UC patients with anti-VDR antibodies. Arrows indicate VDR staining in the epithelial cells. Original magnification, ×100. (C) Microarray heatmap showing relative VDR transcript levels in normal and UC colonic biopsies. Red color indicates high transcript levels, and green color represents low levels. n ≥10 in each group. (DF) Representative Western blots of colonic biopsies from the Chicago cohort (D) and the Shenyang cohort (E) with anti-VDR antibodies and respective densitometric quantitation (F) of VDR protein levels in each cohort (Full, uncut gels are shown in the supplemental material. Supplemental material available online with this article; doi: 10.1172/JCI65842DS1). §P < 0.001 versus normal (n = 5–12). Patients are numbered in the Shenyang cohort. ac, active; qu, quiescent; D, diseased lesion tissues; N, normal tissue. (G) Serum 25-hydroxyvitamin D concentrations in normal controls and IBD patients from the Chicago and Shenyang cohorts as indicated. Average values are marked by horizontal lines.
Figure 2
Figure 2. Characterization of hVDR Tg mice.
(A) DNA construct used for pronuclear microinjection to generate hVDR Tg mice. (B) Western blot using anti-FLAG (–FLAG) antibodies to detect FLAG-hVDR in small and large intestines in WT and Tg mice. Each lane represents 2–3 cm of intestine in the regions indicated. Samples were run together in two gels, which are separated by a black line. Duo, duodenum. (C) Immunostaining of large intestine from WT and Tg mice with anti-FLAG antibodies. Arrows indicate the epithelium. Note that only the Tg colon is positively stained. Original magnification, ×100. (D) BrdU staining of large intestine from WT and Tg mice. Original magnification, ×200. (E) Western blot analysis of WT and Tg small and large intestines using anti-VDR and anti–β-actin antibodies. Each lane represents 2–3 cm of intestine in the regions indicated. (F) Immunostaining of large intestine from WT and Tg mice with anti-VDR antibodies. Arrows indicate the crypt epithelium. Original magnification, ×100 (upper panels) and ×200 (lower panels). Note that VDR is predominantly stained in the nuclei.
Figure 3
Figure 3. Epithelial hVDR expression protects against TNBS-induced colitis.
(A) Changes in body weight (percentage of original body weight) over time (days) in WT and Tg mice following TNBS treatment. **P < 0.01; §P < 0.001 versus WT (n = 7–10). (B) Gross morphology of the large intestine from WT and Tg mice on day 6 after TNBS treatment. (C) H&E staining of colons from WT and Tg mice on day 6 after TNBS treatment. Note the mucosal ulceration in WT colon, indicated by asterisks. Original magnification, ×100. (DF) Colon weight/body weight ratio (D), colonic damage score (E), and histological score (F) of WT and Tg mice on day 6 after TNBS treatment. **P < 0.01; §P < 0.001 versus WT. n = 5–7 in each genotype. (G and H) Time course measurement of TER determined by an Ussing chamber study in the distal (G) or proximal (H) colon from WT and Tg mice on day 2 after TNBS treatment. P < 0.001 by log-rank test.
Figure 4
Figure 4. Epithelial hVDR preserves epithelial tight junctions and suppresses colonic inflammation in a TNBS-induced colitis model.
(A) ZO-1 immunostaining (red) in untreated (Ctrl) and TNBS-treated WT and Tg colons on day 3. Arrows indicate the loss of ZO-1 protein in the luminal epithelium in TNBS-treated WT mice. (B) Real-time RT-PCR quantitation of tight junction protein transcripts in control and TNBS-treated WT and Tg colons. (C) Real-time RT-PCR quantitation of proinflammatory cytokines and chemokines in colonic mucosa from control and TNBS-treated WT and Tg mice on day 6. (D) Fold change induction of proinflammatory cytokines and chemokines in purified colonic epithelial cells from TNBS-treated WT and Tg mice at 8 hours and on day 2 compared with purified untreated control epithelial cells. *P < 0.05; **P < 0.01; §P < 0001. n = 5–6 in each genotype.
Figure 5
Figure 5. Epithelial hVDR attenuates DSS-induced colitis.
(A) Schematic illustration of DSS treatment protocol. (B) Time course of disease activity index in WT and Tg mice during the second DSS cycle. (C) H&E-stained colonic sections from WT and Tg mice on day 10 in the second DSS cycle. Note the severe colonic mucosal ulceration in the WT mice indicated by asterisks. Original magnification, ×100. (D) Histologic scores of WT and Tg colons on days 4 and 10 in the second DSS cycle. *P < 0.05; **P < 0.01; §P < 0.001 versus corresponding WT. n = 6–7 in each genotype.
Figure 6
Figure 6. Epithelial hVDR inhibits colitis in a T cell transfer model of chronic colitis.
(A) Western blot analysis of the colonic mucosa from WT, RagKO, and RagKO Tg mice with anti-VDR and anti-FLAG antibodies. (B) Survival curves of RagKO and RagKO Tg mice constituted with CD4+CD45RBhi T cells. n = 10–12 in each genotype; P < 0.001 by log-rank test. (C) Colonic histological score in T cell–transferred RagKO and RagKO Tg mice. n = 9–10 in each genotype. Average values are marked by horizontal lines. P < 0.001 by a Student’s t test. (D) H&E-stained proximal and distal colonic sections from T cell–transferred RagKO and RagKO Tg mice. Note the massive leukocyte infiltration in the RagKO colon. Original magnification, ×100. Boxed regions in the RagKO sections are shown at ×400 magnification. (E) Relative transcript levels of proinflammatory cytokines and chemokines in the colons of T cell–transferred RagKO and RagKO Tg mice. **P < 0.01; §P < 0.001 versus corresponding RagKO Tg. n = 5 in each genotype.
Figure 7
Figure 7. Reconstitution of VDR-null intestinal epithelial cells with the hVDR transgene rescues Vdr-null mice from colitis and death.
WT, VDRKO, Tg, and KO Tg mice were studied in parallel using the TNBS colitis model. (A) Western blot analysis of the colonic mucosa from these four genotypes as indicated using anti-FLAG or anti-VDR antibodies. (B) Body weight changes over time. (C) Survival curves over time. (D) Gross morphology of the large intestines on day 6 after TNBS treatment. (E) H&E histology of the colons on day 6 after TNBS treatment. Note the severe ulceration in the VDRKO mice, which is inhibited in the KO Tg mice. Original magnification, ×100. (F) Colonic damage score; (G) histological score; (H) MPO activity. **P < 0.01; §P < 0.001. n = 7–8 in each genotype. (I) Relative proinflammatory cytokine levels in colonic mucosa of these four genotypes on day 6, quantified by quantitative RT-PCR. §P < 0.001 versus the rest; #P < 0.05; ##P < 0.01 versus WT. n = 4–5 in each genotype.
Figure 8
Figure 8. Epithelial VDR signaling attenuates gut epithelial cell apoptosis.
WT, VDRKO, Tg, and KO Tg mice were studied in parallel using the TNBS colitis model. (A) Representative TUNEL staining of WT, Tg, VDRKO, and KO Tg colons on day 4 after TNBS treatment. Arrows indicate TUNEL-positive apoptotic epithelial cells. Original magnification, ×100 and ×200 (insets). Insets on the WT and VDRKO panels show higher-magnification views of representative TUNEL-positive cells. (B) Semiquantitative assessment of epithelial apoptosis. Apoptotic index is the percentage of TUNEL-positive crypts among 80–100 crypts randomly chosen in each genotype. §P < 0.001. (C and D) Western blot analyses (C) and densitometric quantitation (D) of colonic mucosal levels of PUMA, caspase 3, and p53 proteins in untreated control and TNBS-treated WT, Tg, VDRKO, and KO Tg mice on day 2. *P < 0.05; **P < 0.01; §P < 0.001. ###P < 0.001 versus corresponding TNBS-treated colons.
Figure 9
Figure 9. Epithelial VDR signaling abrogates PUMA induction by blocking NF-κB activation.
(A) Western analysis of PUMA in HCT116 cells treated with TNF-α (100 ng/ml) ± 1,25(OH)2D3 (1,25VD, 20 nM). (B) PUMA gene promoter κB cis-element and its mutant sequences. (C) ChIP assay measuring p65 binding to the κB site in HCT116 cells treated with TNF-α ± 1,25(OH)2D3. **P < 0.01 versus the rest. (D) EMSA using 32P-labeled PUMA κB probe and nuclear extracts isolated from HCT116 cells treated with TNF-α ± 1,25(OH)2D3. (E) PUMA promoter luciferase reporter assays in HCT116 cells transfected with wild-type (WT) or mutant (Mut) PUMA κB luciferase reporter, followed by treatment with TNF-α ± 1,25(OH)2D3. (F) HCT116 cells were cotransfected with the WT or Mut PUMA κB luciferase reporter and IKKβ-expressing plasmid. Luciferase activity was determined after 1,25(OH)2D3 (+) or ethanol (–) treatment. §P < 0.001 versus the rest. (G) IKK kinase assays in HCT116 cells treated with TNF-α ± 1,25(OH)2D3. (H) HCT116 cells were transfected with empty vector (–) or HA-IKKβ plasmid (+), followed by treatment with ethanol (–) or 1,25(OH)2D3 (+). Note that PUMA protein was induced by IKKβ overexpression, and this induction was abolished by 1,25(OH)2D3. (I) Colonic mucosal IKK activity. Colonic mucosa were isolated from untreated (–) and TNBS-treated (+) WT, Tg, VDRKO and KO Tg mice on day 2 after TNBS treatment, and the lysates were subjected to IKK kinase assays and Western analyses for IKKα/β, PUMA, caspase 3, and p53 proteins. Each lane represents a pool of 4 to 5 mice of the same genotype and treatment.

References

    1. Podolsky DK. Inflammatory bowel disease. N Engl J Med. 2002;347(6):417–429. doi: 10.1056/NEJMra020831. - DOI - PubMed
    1. Gibson PR. Increased gut permeability in Crohn’s disease: is TNF the link? Gut. 2004;53(12):1724–1725. doi: 10.1136/gut.2004.047092. - DOI - PMC - PubMed
    1. Laukoetter MG, Bruewer M, Nusrat A. Regulation of the intestinal epithelial barrier by the apical junctional complex. Curr Opin Gastroenterol. 2006;22(2):85–89. doi: 10.1097/01.mog.0000203864.48255.4f. - DOI - PubMed
    1. Watson AJ, et al. Epithelial barrier function in vivo is sustained despite gaps in epithelial layers. Gastroenterology. 2005;129(3):902–912. doi: 10.1053/j.gastro.2005.06.015. - DOI - PubMed
    1. Fasano A, Shea-Donohue T. Mechanisms of disease: the role of intestinal barrier function in the pathogenesis of gastrointestinal autoimmune diseases. Nat Clin Pract Gastroenterol Hepatol. 2005;2(9):416–422. - PubMed

Publication types

MeSH terms