. 2013 Sep;123(9):3967-82.
doi: 10.1172/JCI65570. Epub 2013 Aug 15.

Long-term IL-33-producing epithelial progenitor cells in chronic obstructive lung disease

Affiliations

Long-term IL-33-producing epithelial progenitor cells in chronic obstructive lung disease

Derek E Byers et al. J Clin Invest. 2013 Sep.

Erratum in

  • J Clin Invest. 2013 Dec 2;123(12):5410

Abstract

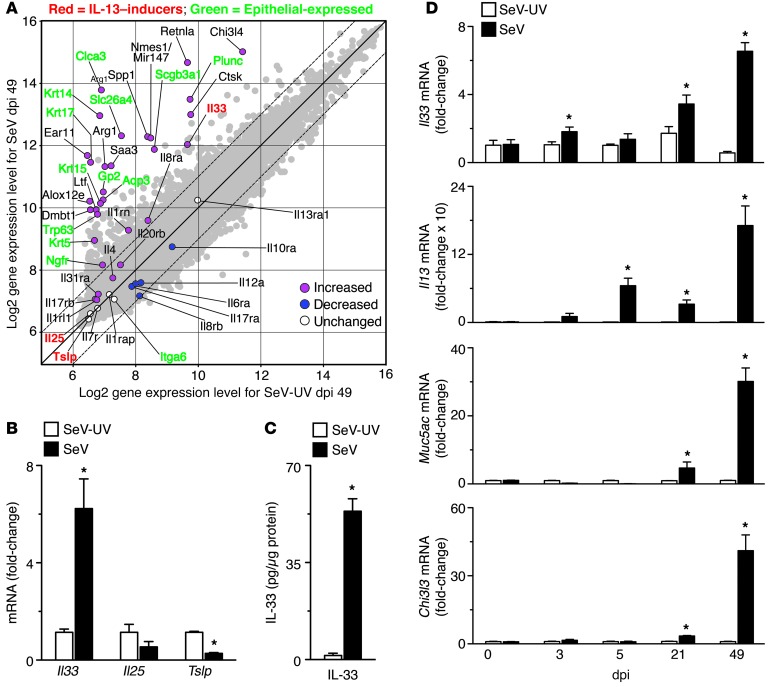
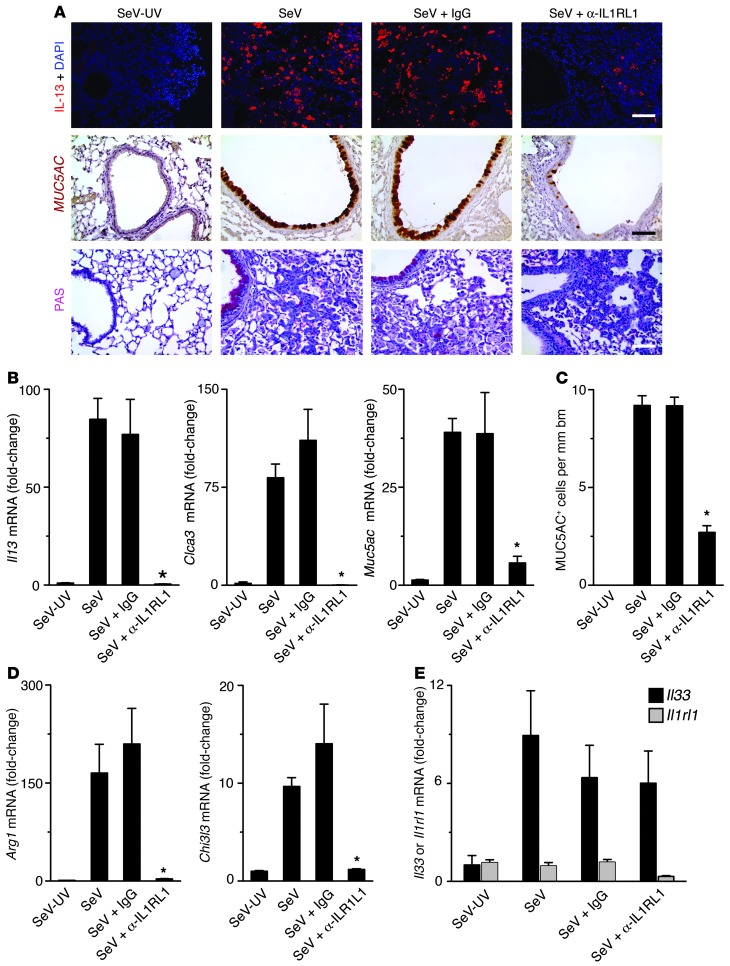
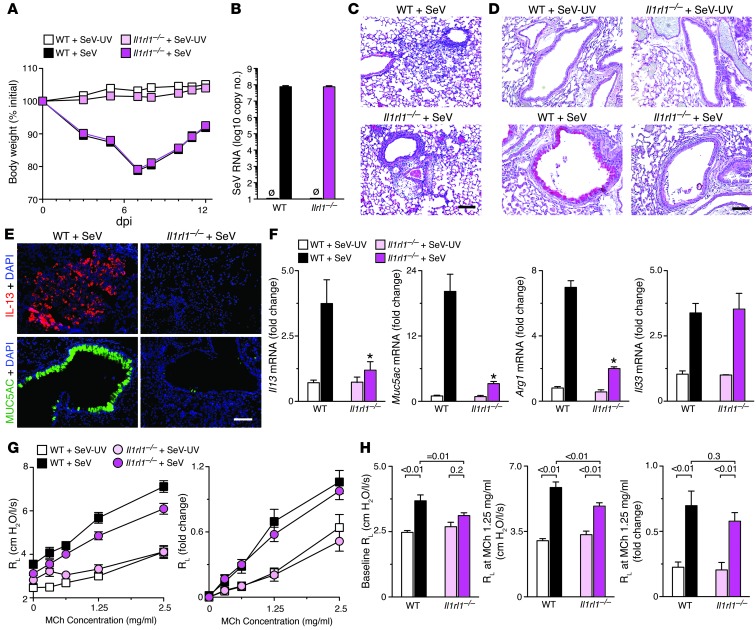
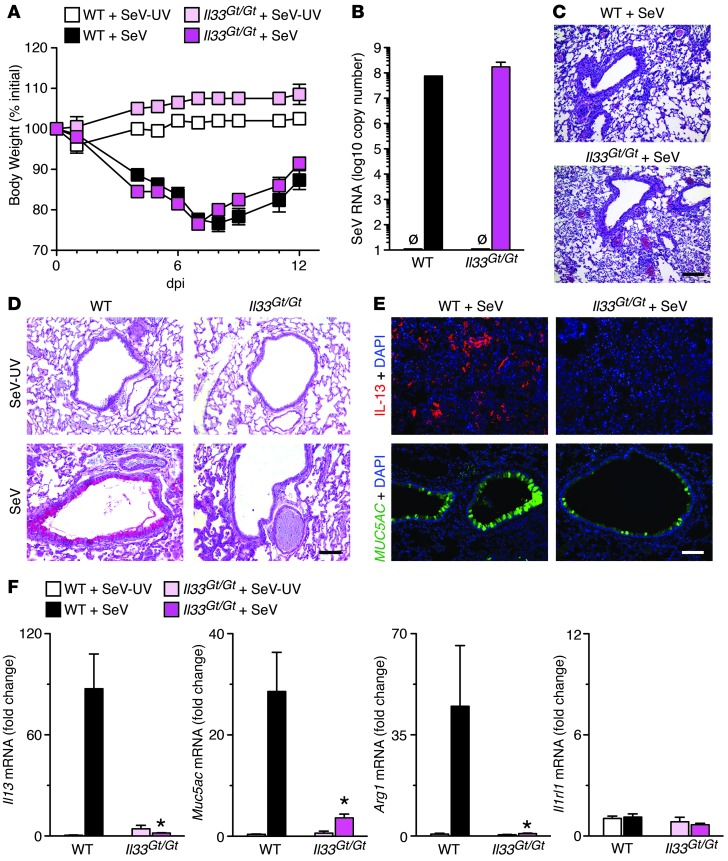
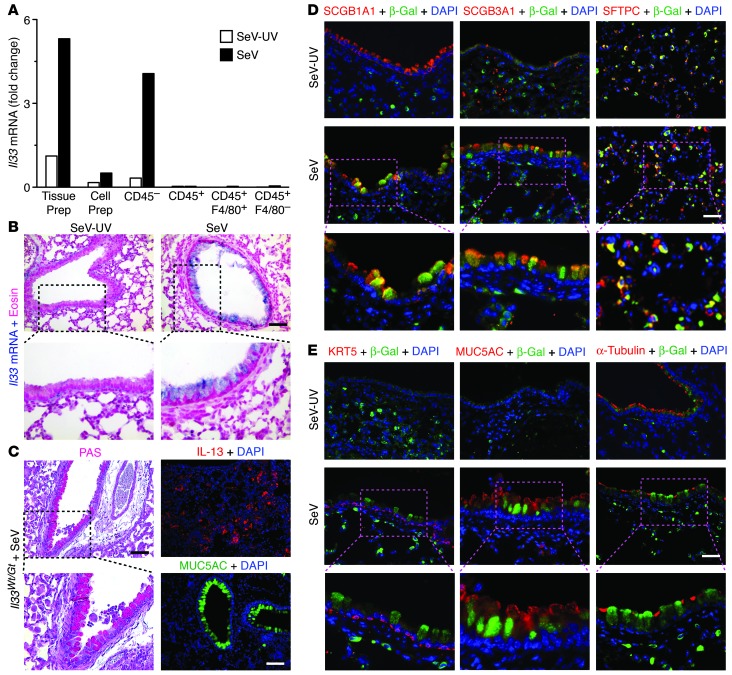
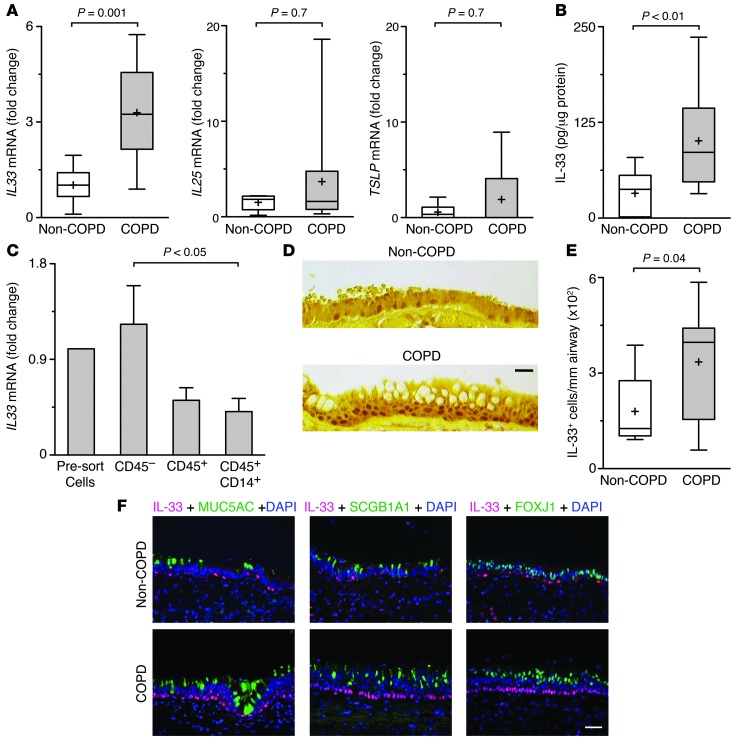
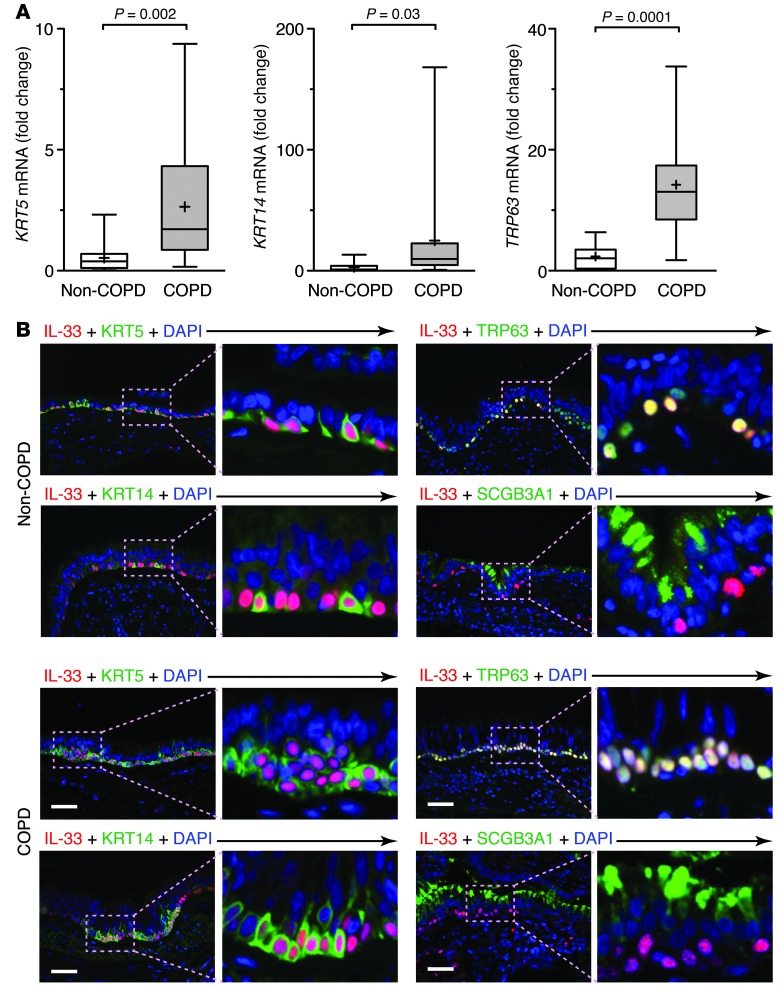
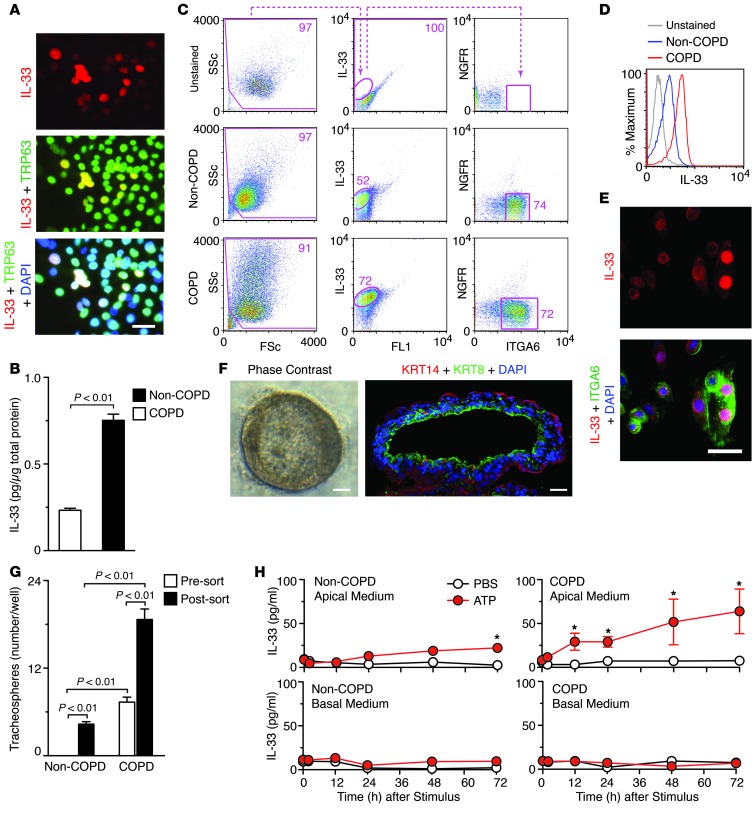
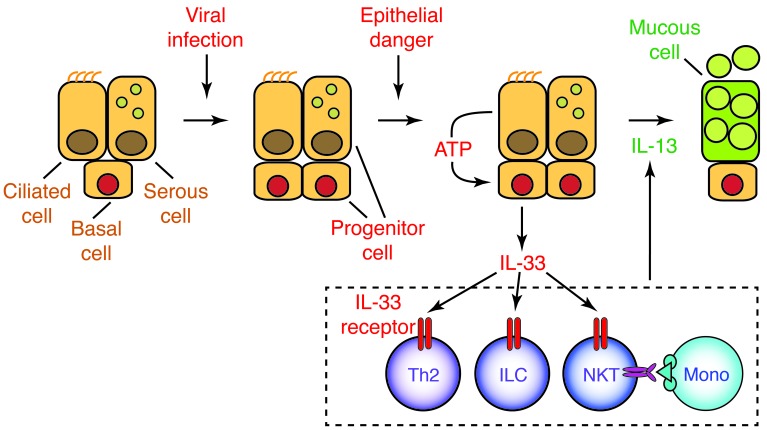
Chronic obstructive lung disease is characterized by persistent abnormalities in epithelial and immune cell function that are driven, at least in part, by infection. Analysis of parainfluenza virus infection in mice revealed an unexpected role for innate immune cells in IL-13-dependent chronic lung disease, but the upstream driver for the immune axis in this model and in humans with similar disease was undefined. We demonstrate here that lung levels of IL-33 are selectively increased in postviral mice with chronic obstructive lung disease and in humans with very severe chronic obstructive pulmonary disease (COPD). In the mouse model, IL-33/IL-33 receptor signaling was required for Il13 and mucin gene expression, and Il33 gene expression was localized to a virus-induced subset of airway serous cells and a constitutive subset of alveolar type 2 cells that are both linked conventionally to progenitor function. In humans with COPD, IL33 gene expression was also associated with IL13 and mucin gene expression, and IL33 induction was traceable to a subset of airway basal cells with increased capacities for pluripotency and ATP-regulated release of IL-33. Together, these findings provide a paradigm for the role of the innate immune system in chronic disease based on the influence of long-term epithelial progenitor cells programmed for excess IL-33 production.


Figures

Figure 1
Figure 1. Selective increase in Il33 gene expression in a postviral mouse model of chronic lung disease.
(A) Gene expression microarray analysis of mRNA from lungs of mice at dpi 49 with SeV (1 × 10⁵ pfu) or SeV-UV. The plot depicts quantile-normalized log2-transformed gene expression values. Each symbol represents the expression value for an individual gene. The 20 genes with the greatest relative change, additional relevant genes, and those encoding ILs and IL receptors are annotated. Diagonal lines represent line of equality (solid line) and 2-fold expression difference (dashed line). Significant differences for SeV versus SeV-UV values (determined as described in Methods) are indicated by colored symbols for annotated genes. (B) Expression levels of Il33, Il25, and Tslp mRNA in whole lung tissues from mice with SeV or SeV-UV at dpi 49. (C) Levels of IL-33, determined by ELISA, using lung lysates from dpi 49. (D) Levels of Il33, Il13, Muc5ac, and Chi3l3 mRNA at the indicated dpi. (BD) Values represent mean ± SEM (n = 5–7 per condition). *P < 0.05 versus corresponding SeV-UV.
Figure 2
Figure 2. Effect of IL1RL1 blockade in the postviral mouse model.
Mice were inoculated with SeV-UV or SeV, then treated as indicated with anti-IL1RL1 mAb or control IgG1 mAb (IgG) on dpi 12–49, and examined at dpi 49. (A) Representative photomicrographs of mouse lung sections for IL-13 and MUC5AC immunostaining and PAS staining. Scale bars: 200 μm. (B) Lung levels of Il13, Clca3, and Muc5ac mRNA. (C) Levels of MUC5AC+ airway epithelial cells. (D). Lung levels of Arg1 and Chi3l3 mRNA. (E) Lung levels of Il33 and Il1rl1 mRNA. (BE) Values represent mean ± SEM (n = 7 per group, representative of 3 experiments). *P < 0.05 versus untreated SeV.
Figure 3
Figure 3. Effect of IL1RL1 deficiency in the postviral mouse model.
Il1rl1–/– and WT mice were inoculated with SeV or SeV-UV. (A) Body weight. (B) Lung levels of SeV RNA at dpi 5. (C) Representative photomicrographs showing H&E staining of lung sections at dpi 5. (D) Representative photomicrographs showing PAS staining of lung sections at dpi 49. (E) Representative photomicrographs showing IL-13 and MUC5AC immunostaining of lung sections at dpi 49. (F) Lung levels of Il13, Muc5ac, Arg1, and Il33 mRNA (n = 5–7 per group). *P < 0.05 versus corresponding WT. (G and H) Airway reactivity to inhaled methacholine (MCh) at SeV dpi 49 (n = 15–21 mice per group). (G) Total lung resistance (RL) and fold change from baseline were not significantly different by 2- and 3-way ANOVA. (H) Differences for lung resistance at baseline and after methacholine (1.25 mg/ml). Scale bars: 200 μm.
Figure 4
Figure 4. Effect of IL-33 deficiency in the postviral mouse model.
Il33Gt/Gt and WT mice were inoculated with SeV or SeV-UV. (A) Body weight. (B) Lung levels of SeV RNA at dpi 5. (C) Representative photomicrographs showing H&E staining of lung sections at dpi 5. (D) Representative photomicrographs showing PAS staining of lung sections at dpi 49. (E) Representative photomicrographs showing IL-13 and MUC5AC immunostaining of lung sections at dpi 49. (F) Lung levels of Il13, Muc5ac, Arg1, and Il1rl1 mRNA (n = 5–7 per group). *P < 0.05 versus corresponding WT. Scale bars: 200 μm.
Figure 5
Figure 5. Localization of IL-33 expression to subsets of lung epithelial cells in the postviral mouse model.
(A) Levels of Il33 mRNA from lung tissue preparation (Tissue Prep), lung cell preparation before FACS (Cell Prep), and the indicated cell populations purified by FACS from lungs obtained at dpi 49. Values are representative of 3 experiments. (B) Representative photomicrographs showing in situ hybridization for Il33 mRNA at dpi 49. (C) Representative photomicrographs showing PAS staining and IL-13 and MUC5AC immunostaining in Il33Wt/Gt lung sections at dpi 49. (D) Representative photomicrographs showing IL-33 immunostaining (detected with anti–β-gal antibody) and indicated cell type–specific costaining and DAPI counterstaining in Il33Wt/Gt lung sections at dpi 49. (E) Representative photomicrographs for additional immunostaining using conditions in D. Boxed regions in BE are shown at higher magnification below (enlarged ×2). Scale bars: 200 μm (B and C); 100 μm (D and E).
Figure 6
Figure 6. Selective increase in IL-33–expressing airway epithelial cells in COPD.
(A). Levels of IL33, IL25, and TSLP mRNA in non-COPD (n = 7) and COPD (n = 15) lung tissues. (B) Levels of IL-33, determined by ELISA, using non-COPD (n = 16 samples from 9 subjects) versus COPD (n = 17 samples from 11 subjects) lung lysates. (C) Levels of IL33 mRNA in lung cells before FACS (Pre-sort Cells) and the indicated cell populations purified by FACS from COPD subjects (n = 4) using labeled anti-CD45 and anti-CD14 mAb. (D) Representative photomicrographs of sections of airway epithelium immunostained for IL-33 with DAB (brown) reporter and counterstained with tartrazine (yellow). (E) Number of IL-33+ cell nuclei per millimeter basement membrane in non-COPD (n = 6) versus COPD (n = 10) lung tissues. (F) Representative photomicrographs of non-COPD and COPD airway epithelium sections immunostained for IL-33 with red (Alexa Fluor 594) reporter; costained for MUC5AC, SCGB1A1, or FOXJ1 with green (Alexa Fluor 488) reporter; and counterstained with DAPI (blue). (A, B, and E) Box represents 25th–75th percentile; line represents median; “+” represents mean; whiskers represent range. (C) Bars represent mean ± SEM. P values were derived from unpaired Student’s t test, but comparisons of medians were also made using Mann-Whitney U test with similar results. Scale bars: 100 μm.
Figure 7
Figure 7. Localization of IL-33 expression to a subset of airway basal cells in COPD.
(A) Levels of KRT5, KRT14, and TRP63 mRNA in non-COPD (n = 18) and COPD (n = 21) lungs. (B) Representative photomicrographs of non-COPD and COPD airway epithelium sections immunostained for IL-33; costained for KRT5, KRT14, TRP63, or SCGB3A1; and counterstained with DAPI. Boxed regions are shown at higher magnification at right (enlarged ×4). Scale bars: 100 μm.
Figure 8
Figure 8. Basal cell capacity for tracheobronchosphere formation and IL-33 release in COPD.
(A) Representative photomicrographs of hTECs isolated from COPD subjects, cultured in 2D submerged conditions for 5 days, and immunostained for IL-33 and TRP63 and counterstained with DAPI. (B) IL-33 levels in cell lysates for non-COPD and COPD subjects (n = 3 per group) as in A. (C and D) Flow cytometric analysis of hTECs cultured from COPD and non-COPD subjects (n = 3 per group) and then permeabilized and stained for IL-33, ITGA6, and NGFR along with unstained non-COPD control. (C) Representative cytograms. FL1, autofluorescence signal; FSc, forward scatter. Values indicate percent of cells within the designated gate. (D) Histograms. (E) Representative photomicrographs showing IL-33 and ITGA6 immunostaining as in A. (F) Representative photomicrographs of tracheobronchospheres in 3D culture using phase contrast and fluorescent microscopy for immunostaining for ablumenal/basal KRT14 and lumenal/apical KRT8. (G) Quantitation of tracheobronchosphere formation for basal cells with and without FACS purification from non-COPD (n = 3) and COPD (n = 5) subjects, using sorting and culture conditions as in C and F. (H) Levels of IL-33 released from hTECs isolated from a COPD and a non-COPD subject, cultured submerged for 5 days, and then incubated with ATP for the indicated time periods. Results are representative of 3–5 subjects. *P < 0.05 versus PBS at 0 h, 2-way ANOVA. Scale bars: 25 μm (A and E); 100 μm (F).
Figure 9
Figure 9. IL-33/IL-13 immune axis in chronic obstructive lung disease.
Respiratory viral infection leads to an increase in lung epithelial progenitor cells (airway basal cells in humans, and perhaps airway serous cells and alveolar type 2 cells in mice) that are programmed for increased IL-33 expression. Subsequent epithelial danger signals stimulate ATP-regulated release of IL-33 that acts on immune cells in the lung, e.g., CD4+ Th2 cells, innate lymphoid cells (ILC), and semi-invariant NKT cells with interacting monocytes and macrophages (Mono) to stimulate IL-13 production and consequent airway mucous cell and mucus formation.

References

    1. Tuder RM, Petrache I. Pathogenesis of chronic obstructive pulmonary disease. J Clin Invest. 2012;122(8):2749–2755. doi: 10.1172/JCI60324. - DOI - PMC - PubMed
    1. Sethi S, Murphy TF. Infection in the pathogenesis and course of chronic obstructive pulmonary disease. N Engl J Med. 2008;359(22):2355–2365. doi: 10.1056/NEJMra0800353. - DOI - PubMed
    1. Seemungal T, et al. Respiratory viruses, symptoms, and inflammatory markers in acute exacerbations and stable chronic obstructive pulmonary disease. Am J Respir Crit Care Med. 2001;164(9):1618–1623. doi: 10.1164/ajrccm.164.9.2105011. - DOI - PubMed
    1. Rohde G, et al. Respiratory viruses in exacerbations of chronic obstrutive pulmonary disease requiring hospitalisation: a case-control study. Thorax. 2003;58(1):37–42. doi: 10.1136/thorax.58.1.37. - DOI - PMC - PubMed
    1. Cameron RJ, de Wit D, Welsh TN, Ferguson J, Grissell TV, Rye PJ. Virus infection in exacerbations of chronic obstructive pulmonary disease requiring ventilation. Intensive Care Med. 2006;32(7):1022–1029. doi: 10.1007/s00134-006-0202-x. - DOI - PMC - PubMed

Publication types

MeSH terms