. 2013 Sep;123(9):3889-901.
doi: 10.1172/JCI68989. Epub 2013 Aug 15.

Differentiation and functional regulation of human fetal NK cells

Affiliations

Differentiation and functional regulation of human fetal NK cells

Martin A Ivarsson et al. J Clin Invest. 2013 Sep.

Abstract

The human fetal immune system is naturally exposed to maternal allogeneic cells, maternal antibodies, and pathogens. As such, it is faced with a considerable challenge with respect to the balance between immune reactivity and tolerance. Here, we show that fetal natural killer (NK) cells differentiate early in utero and are highly responsive to cytokines and antibody-mediated stimulation but respond poorly to HLA class I-negative target cells. Strikingly, expression of killer-cell immunoglobulin-like receptors (KIRs) did not educate fetal NK cells but rendered them hyporesponsive to target cells lacking HLA class I. In addition, fetal NK cells were highly susceptible to TGF-β-mediated suppression, and blocking of TGF-β signaling enhanced fetal NK cell responses to target cells. Our data demonstrate that KIR-mediated hyporesponsiveness and TGF-β-mediated suppression are major factors determining human fetal NK cell hyporesponsiveness to HLA class I-negative target cells and provide a potential mechanism for fetal-maternal tolerance in utero. Finally, our results provide a basis for understanding the role of fetal NK cells in pregnancy complications in which NK cells could be involved, for example, during in utero infections and anti-RhD-induced fetal anemia.


Figures

Figure 1
Figure 1. NK cells are present in human fetal tissues.
(A) Representative staining and gating strategy for identification of NK cells in fetal lung. NK cells were defined using the Boolean algorithm (“CD56+ or NKG2A+ or CD16+” ) after gating on live CD3CD14CD19CD34CD7+ cells. For detailed information on the identification of fetal NK cells, see Supplemental Figure 1. (B) Frequency of NK cells, as percentages of CD7+ cells in fetal liver (n = 10), fetal lung (n = 15), fetal spleen (n = 14), fetal bone marrow (n = 11), fetal mLNs (n = 11), and adult PBMCs (n = 7). Horizontal bars indicate the mean percentage, and dots indicate the number of samples tested. (C) Staining of NKp46+ cells in fetal lung. Arrows indicate NKp46+ cells. Two NKp46+ cells are shown in the top and bottom left corners. The staining is representative of sections from 4 individual fetal lungs at gestational week 18–22. Representative staining of EpCAM expression (epithelial marker, top right) and CD31 expression (endothelial marker, bottom right) in fetal lung sections. Scale bar: 20 μm.
Figure 2
Figure 2. Fetal NK cell differentiation and KIR acquisition starts early in the developing fetus and varies among organs.
(A) Frequency of NKG2A+CD16, NKG2A+CD16+, and NKG2ACD16+ subsets of total NK cells in fetal organs (black circles), full-term umbilical cord blood (UCB; white circles), and adult PBMCs (aPBMC; white circles) (fetal mLN, n = 8; liver, n = 13; spleen, n = 11; bone marrow, n = 11; lung, n = 24; umbilical cord blood, n = 4; adult PBMCs, n = 31). (B) Frequency of NKG2A+CD16, NKG2A+CD16+, and NKG2ACD16+ subsets of NK cells in fetal lung stratified over gestational weeks (gw) 15–18 (black, n = 9), 18–20 (gray, n = 9), and 20–22 (white, n = 6). Error bars represent SD, and bars represent mean. (C) KIR2DL1, KIR2DL3, and KIR3DL1 expression on fetal lung NK cells. (D) Frequency of NK cells expressing KIR2DL1, KIR2DL3, and/or KIR3DL1 (defined by the Boolean gate “KIR2DL1+ and/or KIR2DL3+ and/or KIR3DL1+”) (lung, n = 21; spleen, n = 10; bone marrow, n = 8; mLN, n = 8; liver, n = 12; umbilical cord blood, n = 14; adult PBMCs, n = 26). Horizontal bars indicate the mean percentage, and dots indicate the number of samples tested.
Figure 3
Figure 3. KIR expression on fetal NK cells increases with differentiation, and coexpression of several KIRs is more common on differentiated fetal lung NK cells than on adult PBNK cells.
(A) Frequency of NK cells expressing KIR2DL1, KIR2DL3, and/or KIR3DL1 (defined by the Boolean gate “KIR2DL1+ and/or KIR2DL3+ and/or KIR3DL1+”) within each subset (liver, n = 12; lung, n = 21; full-term umbilical cord blood, n = 4; adult PBMCs, n = 26). (B) Frequency of fetal lung NK cells expressing KIR2DL1, KIR2DL3, and/or KIR3DL1, stratified over gestational weeks 15–18 (black, n = 4), 18–20 (gray, n = 8), and 20–22 (white, n = 6). (C) Frequency of NK cells coexpressing 0, 1, 2, or 3 KIRs (KIR2DL1, KIR2DL3, and/or KIR3DL1) in NKG2A+CD16, NKG2A+CD16+, and NKG2ACD16+ subsets of NK cells from fetal lung (black circles, n = 11) and adult PBMCs (white circles, n = 11). *P < 0.05; **P < 0.01; ***P < 0.001, 2-tailed Mann-Whitney test performed. ns, not significant. (D) Frequency of NKG2A+ NK cells in subsets with 0, 1, 2, or 3 KIR (KIR2DL1, KIR2DL3, and/or KIR3DL1) in fetal lung (n = 19), spleen (n = 9), umbilical cord blood (n = 11), and adult PBMCs (n = 25). Error bars represent SD, and bars represent mean. Horizontal bars indicate the mean percentage, and dots indicate the number of samples tested.
Figure 4
Figure 4. The frequency of CD57+ NK cells in fetal lung is low.
(A) Representative staining of CD16 and CD57 on NK cells from fetal lung and adult PBNK. (B) Frequency and mean fluorescence intensity of CD57 expression on NK cells from fetal lung (black circles) and adult PBNK (white circles). Bars represent mean. Representative stainings of perforin and granzyme B expression in NKG2A+CD16 (long dashed lines), NKG2A+CD16+ (dotted line), and NKG2ACD16+ (solid line) subsets of NK cells in (C) fetal lung and (D) adult PBMC. The non-NK cell Boolean gate was used as a reference (filled gray). The stainings are representative of 3 independent stainings in 3 individual donors.
Figure 5
Figure 5. Fetal NK cells degranulate in response to target cells and are highly responsive to cytokine stimulation.
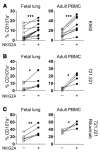
(A) Representative plots of degranulation (measured as CD107a cell surface expression) and IFN-γ production by fetal lung NK cells (top row) and adult PBNK cells (bottom row), following stimulation with target cells (left) or cytokines (right). (B) NK cell degranulation (fetal lung, n = 14; fetal spleen, n = 5; fetal liver, n = 8; fetal mLN, n = 2; adult PBMCs, n = 7) and (C) cytotoxicity in response to K562 cells (fetal lung, n = 7; adult PBMCs, n = 9). ***P < 0.001. (D) NK cell degranulation in response to 721.221 cells and rituximab-coated 721.221 cells and (E) mean cytotoxicity against rituximab-coated 721.221 cells (fetal lung, n = 6; adult PBMCs, n = 10). (F) Frequency of IFN-γ–positive NK cells after stimulation with IL-12 and IL-18 or (G) IL-12 alone. (H) Frequency of NK cells degranulating after overnight priming with IL-12 and IL-18, followed by coculture with K562 cells. Bars represent mean, and error bars represent SD. Horizontal bars indicate the mean percentage, and dots indicate the number of samples tested. ***P < 0.001, paired t test. The frequency of responding (CD107a+ or IFN-γ+) cells cultured in the control (R10 medium alone) was subtracted in B, D, F, and G. The degranulation response from control wells stimulated with medium alone (left) or IL-12/18 (right), without K562 coculture, was subtracted in H. (C and E) Linear regression analysis was performed, testing whether slopes were significantly different.
Figure 6
Figure 6. NKG2A educates fetal NK cells.
Degranulation by NKG2ACD57KIR and NKG2A+CD57KIR fetal lung NK cells and NKG2ACD57KIRCD56dim and NKG2A+CD57KIRCD56dim adult PBNK cells after stimulation with (A) K562 cells, (B) 721.221 cells, or (C) rituximab-coated 721.221 cells. The degranulation in cultures with medium alone was subtracted from the response to the indicated stimulation. *P < 0.05, **P < 0.01, ***P < 0.001, paired t test; #P < 0.05, Wilcoxon matched-pairs signed-rank test.
Figure 7
Figure 7. KIR-expressing fetal NK cells are hyporesponsive to stimulation with K562 cells.
(A) Degranulation by NKG2A+CD57 fetal lung NK cells and NKG2A+CD57CD56dim adult PBNK cells expressing no KIR, only self KIR (S), or only non-self KIR (NS) (defined using a Boolean function of KIR2DL1, KIR2DL3, and KIR3DL1 expression and KIR-HLA ligand genotype) after stimulation with K562 cells. (B) Relative change in response to K562 cells compared with NKG2A+CD57 NK cells lacking KIR expression. (C) Degranulation by NKG2ACD57 fetal lung NK cells and NKG2ACD57CD56dim adult PBNK cells expressing no KIR or any combination of KIR (as in A) after coculture with K562 cells. (D) Relative change in response to K562 cells compared with NKG2ACD57 NK cells lacking KIR expression. (E) Degranulation by NKG2A+CD57 fetal lung NK cells and NKG2A+CD57CD56dim adult PBNK cells expressing 0, 1, 2, or 3 KIRs (KIR2DL1, KIR2DL3, and/or KIR3DL1) after stimulation with K562 cells. (F) Relative change in degranulation compared with NK cells lacking expression of KIRs. Bars represent mean, and error bars represent SD. *P < 0.05, **P < 0.01, ***P < 0.001, 1-way ANOVA analysis of repeated measurements with Bonferroni’s post-test; #P < 0.001, unpaired t test. Horizontal bars indicate the mean percentage, and dots indicate the number of samples tested.
Figure 8
Figure 8. KIR-expressing fetal NK cells are hyporesponsive to 721.221 cells and rituximab-coated 721.221 cells.
(A) Degranulation by NKG2A+CD57 fetal lung NK cells and NKG2A+CD57CD56dim adult PBNK cells expressing no KIR, only self KIR, or only non-self KIR (defined using Boolean function of KIR2DL1, KIR2DL3, and KIR3DL1 expression and KIR-HLA ligand genotype) after stimulation with 721.221 cells. (B) Relative change in degranulation compared with NK cells lacking expression of KIRs after stimulation with 721.221 cells. (C) Degranulation against rituximab-coated 721.221 cells by fetal and adult NK cells as in A. (D) Relative change in degranulation compared with NK cells lacking expression of KIRs after stimulation with rituximab-coated 721.221 cells. The degranulation in unstimulated cultures was subtracted from the response to the specific stimulations. *P < 0.05, **P < 0.01, ***P < 0.001, 1-way ANOVA analysis of repeated measurements with Bonferroni’s post-test; #P < 0.001, unpaired t test. Error bars represent SD.
Figure 9
Figure 9. Fetal NK cells are highly susceptible to TGF-β–mediated suppression.
(A) Degranulation by NKG2A+CD57 fetal cord blood NK cells and NKG2A+CD57 CD56dim adult PBNK cells after culture with TGF-β or TGF receptor kinase inhibitor (SB431542) for 48 hours and subsequent stimulation with rituximab-coated 721.221 cells for 2 hours. (B) Relative change in degranulation in response to rituximab-coated 721.221 cells after treatment with TGF-β or SB431542, compared with medium control. (C) Degranulation by NKG2A+CD57 fetal cord blood NK cells and (D) NKG2A+CD57CD56dim adult PBNK cells expressing no KIR (KIR) or any combination of KIR2DL1, KIR23DL3, or KIR3DL1 (KIR+) after culture with TGF-β or TGF-β receptor kinase inhibitor (SB431542) for 48 hours and subsequent stimulation with rituximab-coated 721.221 cells for 2 hours. Data are summarized from 3 individual experiments. Bars represent mean, and error bars represent SD. *P < 0.05, **P < 0.01, Mann-Whitney test; #P < 0.05, ##P < 0.01, paired t test.

References

    1. Caligiuri MA. Human natural killer cells. Blood. 2008;112(3):461–469. doi: 10.1182/blood-2007-09-077438. - DOI - PMC - PubMed
    1. Trowsdale J, Moffett A. NK receptor interactions with MHC class I molecules in pregnancy. Semin Immunol. 2008;20(6):317–320. doi: 10.1016/j.smim.2008.06.002. - DOI - PubMed
    1. Lanier LL. NK cell recognition. Annu Rev Immunol. 2005;23:225–274. doi: 10.1146/annurev.immunol.23.021704.115526. - DOI - PubMed
    1. Cooper MA, Fehniger TA, Caligiuri MA. The biology of human natural killer-cell subsets. Trends Immunol. 2001;22(11):633–640. doi: 10.1016/S1471-4906(01)02060-9. - DOI - PubMed
    1. Fauriat C, Long EO, Ljunggren HG, Bryceson YT. Regulation of human NK-cell cytokine and chemokine production by target cell recognition. Blood. 2010;115(11):2167–2176. doi: 10.1182/blood-2009-08-238469. - DOI - PMC - PubMed

Publication types