. 2015 Jan;25(1):10-25.
doi: 10.1093/cercor/bht198. Epub 2013 Aug 13.

Place field repetition and purely local remapping in a multicompartment environment

Affiliations

Place field repetition and purely local remapping in a multicompartment environment

Hugo J Spiers et al. Cereb Cortex. 2015 Jan.

Abstract

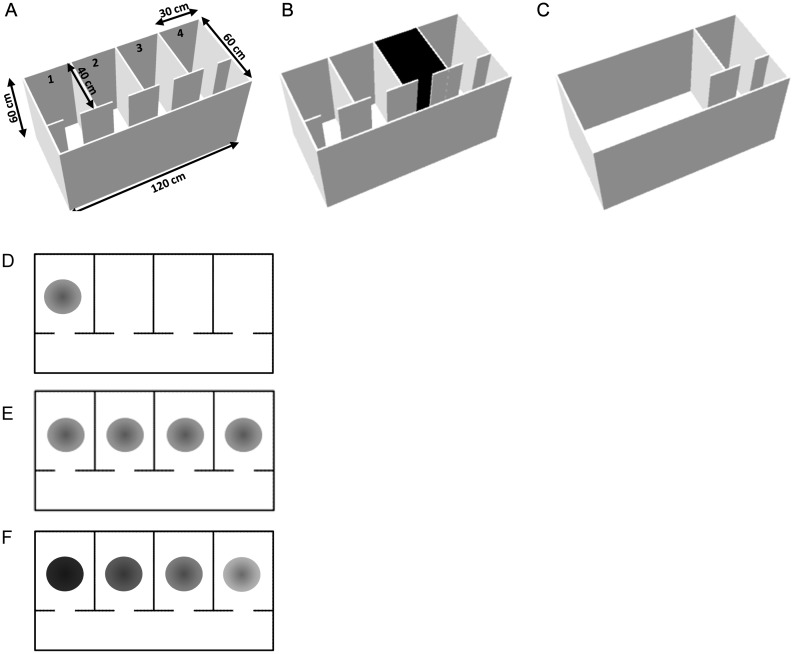
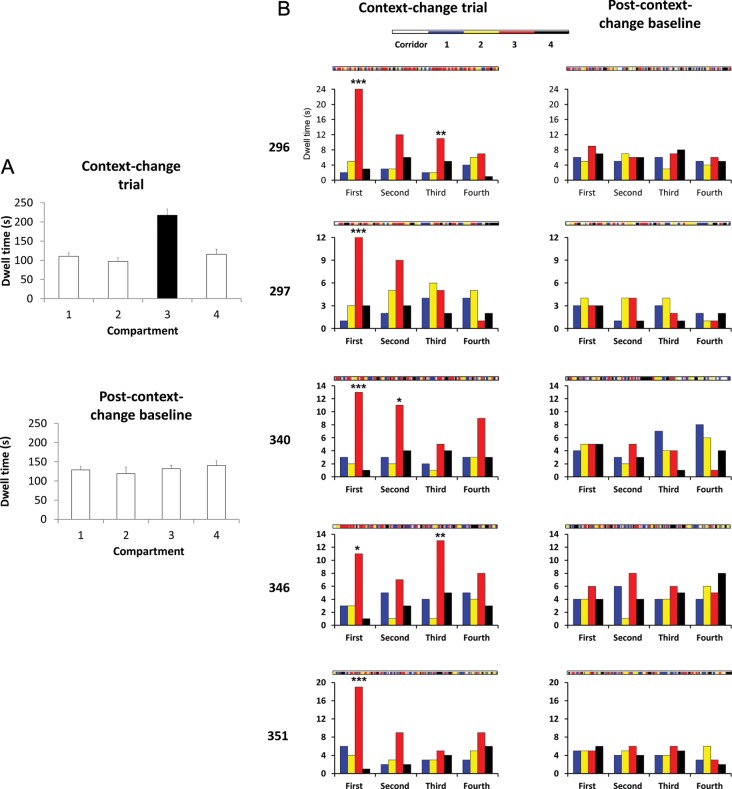
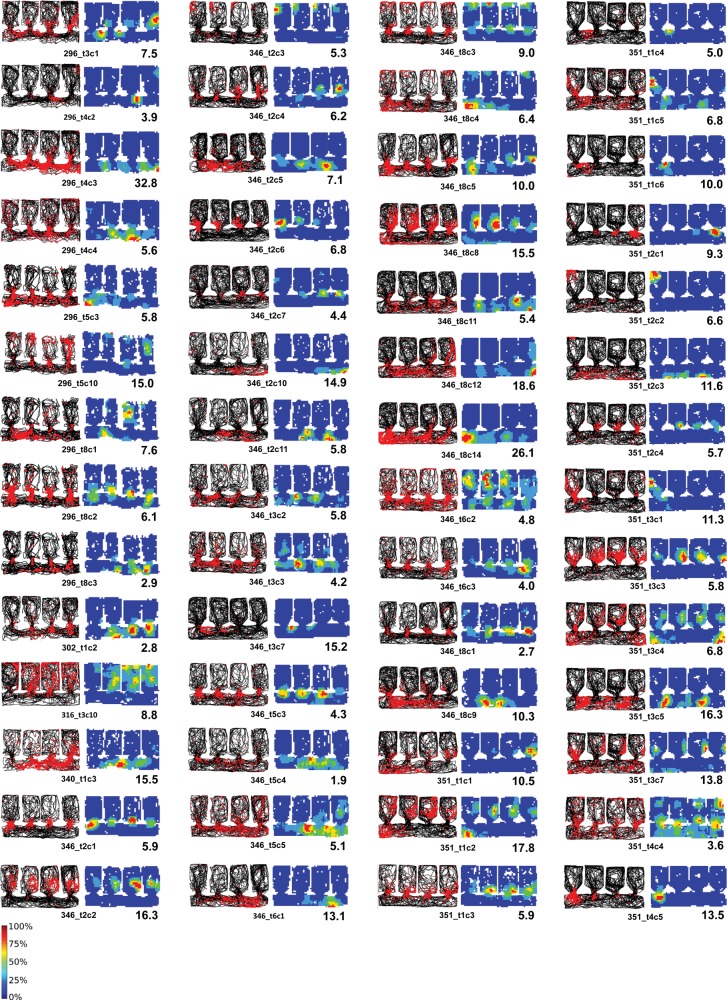
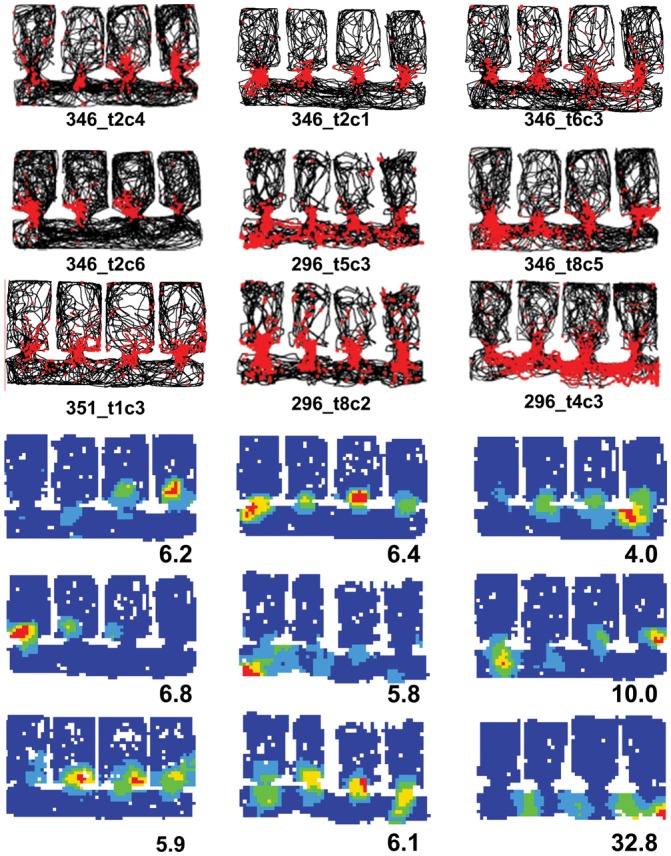
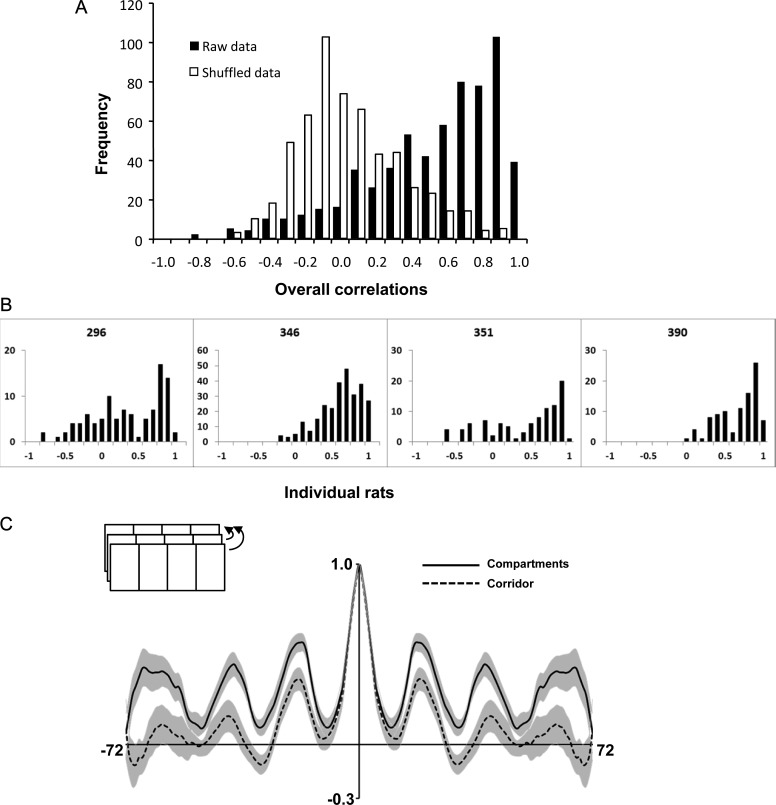
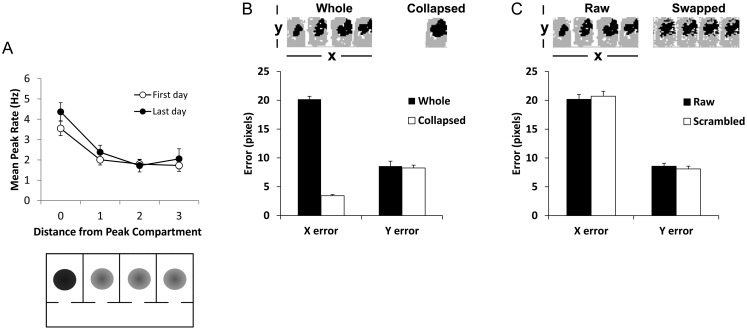
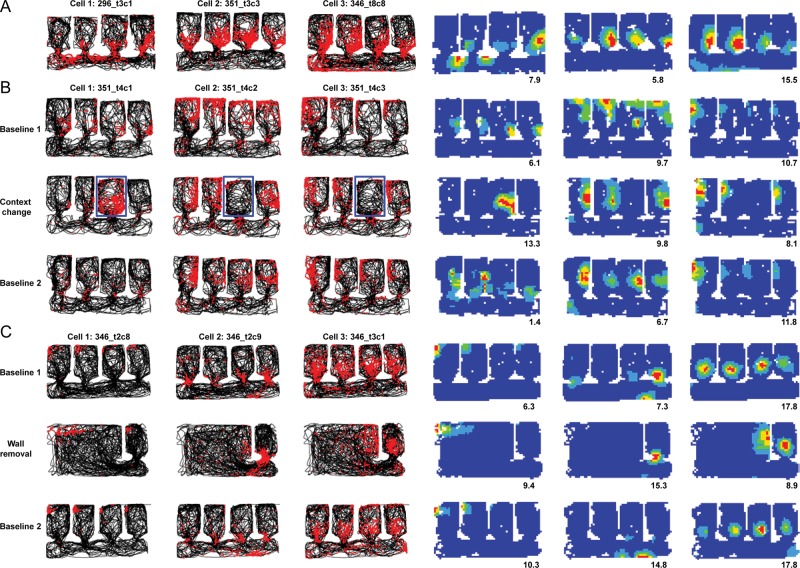
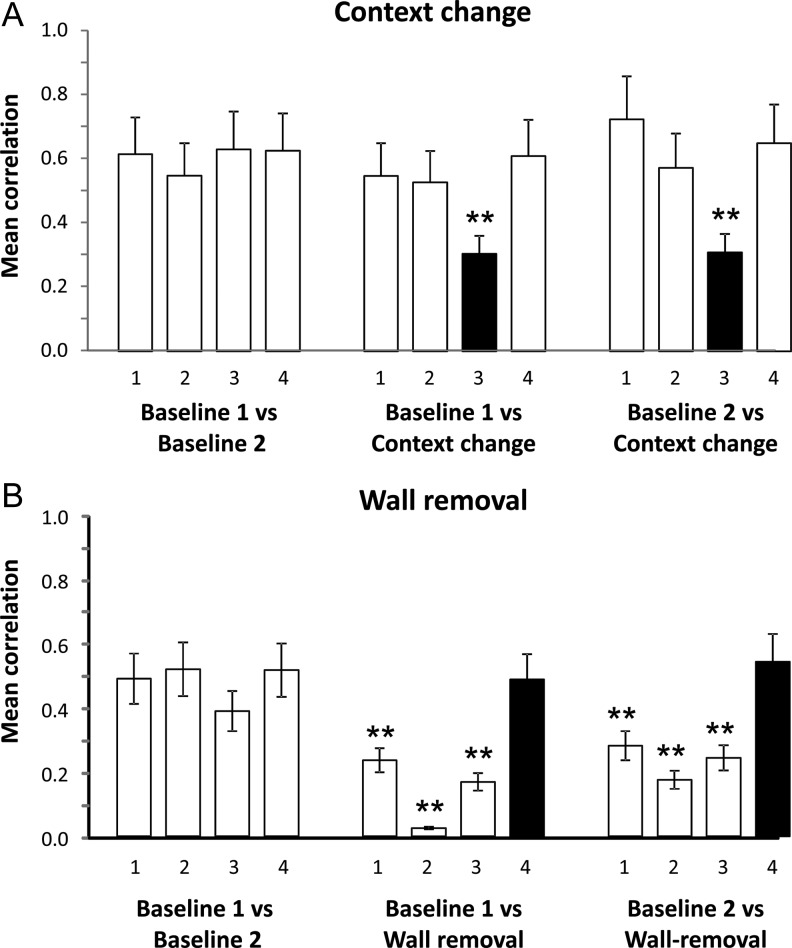
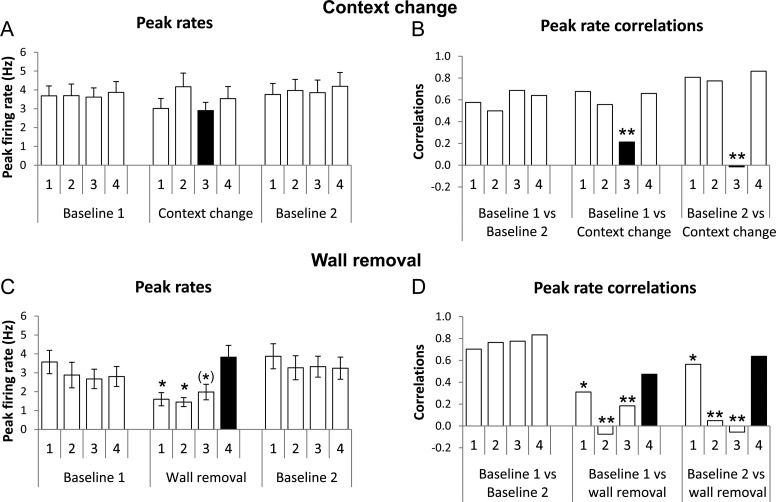
Hippocampal place cells support spatial memory using sensory information from the environment and self-motion information to localize their firing fields. Currently, there is disagreement about whether CA1 place cells can use pure self-motion information to disambiguate different compartments in environments containing multiple visually identical compartments. Some studies report that place cells can disambiguate different compartments, while others report that they do not. Furthermore, while numerous studies have examined remapping, there has been little examination of remapping in different subregions of a single environment. Is remapping purely local or do place fields in neighboring, unaffected, regions detect the change? We recorded place cells as rats foraged across a 4-compartment environment and report 3 new findings. First, we find that, unlike studies in which rats foraged in 2 compartments, place fields showed a high degree of spatial repetition with a slight degree of rate-based discrimination. Second, this repetition does not diminish with extended experience. Third, remapping was found to be purely local for both geometric change and contextual change. Our results reveal the limited capacity of the path integrator to drive pattern separation in hippocampal representations, and suggest that doorways may play a privileged role in segmenting the neural representation of space.

Keywords: grid cells; path integration; place cells; rat; spatial memory.


Figures

Figure 1.
Figure 1.
(A–C) Schematic of the apparatus in its 3 configurations: (A) The standard configuration showing 4 main identical compartments, connected by a long corridor. (B) The context remapping manipulation, in which 1 of the 2 middle compartments was changed from white to black by adding wall and floor inserts. (C) The wall-removal manipulation in which all of the interior walls except those surrounding the end compartment were removed. (D–E) Possible outcomes predicted on a plan view of the apparatus. Filled circles represent place fields from a single hypothetical place cell. (D) Spatial discrimination: If place cells are able to discriminate the compartments cells should produce unique firing patterns in the environment. In this example, a single field is shown, but other examples could include fields in each of the compartments, each occupying a different location. (E) No discrimination—place fields repeat across compartments, firing in the same location in each compartment. (F) Rate discrimination—place field locations repeat across compartments, but the peak rate is modulated across compartments. In this example, the highest peak rate (darkest circle) is in the first compartment, but the peak might occur in any of the compartments.
Figure 2.
Figure 2.
Analysis of dwell times and compartment re-entries in context-change trials and in the follow-up baselines. (A) Dwell time increased markedly in the compartment that was changed (black bar), whereas in the following trial, dwell time was not different in any of the compartments (including the had-been-changed one). (B) Compartment re-entries, broken down by trial quadrant. In the context-change trial (left column), re-entries increased markedly in the changed compartment (red bars), though this declined across the course of the session as the animals habituated to the change. In the follow-up baseline (right column), there was no difference in re-entries into any of the compartments, including the had-been-changed one.
Figure 3.
Figure 3.
Montage of the firing maps of 56 place cells recorded in baseline conditions, shown as spike plots (top) or firing rate maps (bottom). For the spike plots, the path of the rat is shown in black, and the spikes shown as red dots. The condensation of spikes in a particular region of the environment comprises the place field of the cell. These cells were selected for showing activity in the corridor, as well as usually in the compartments. Note the prevalence of intense activity around the doorways. Even in the corridor, there was a high degree of repetition that followed the repetition of the environment. The firing rate maps show the same data expressed as a rate map, normalized for dwell time and for the peak rate of each cell. The peak rate in Hz is shown at the bottom right of each map and the key to the color plots is shown to the bottom left of the array.
Figure 4.
Figure 4.
Intense activity around the doorways in 9 cells (plotted as for Fig. 3).
Figure 5.
Figure 5.
(A) Frequency histograms of the pairwise intercompartment correlations for the raw data (solid bars) and the shuffled data (hollow bars), showing a clear separation between the 2 distributions, reflective of the nonrandom relationship between place fields in different compartments. (B) The same correlation pattern held for individual animals, showing the generality of this effect. (C) The 1D autocorrelation plot, generated by progressively shifting the environment in the direction of the long axis (inset) and re-correlating at every step. The vertical axis represents the firing rate map correlation, with the central value at 1.0 (map correlated with itself). The horizontal axis indicates the extent of the environment in bins (72 in total). The shaded areas represent the standard errors. The correlations for the compartments (solid line) peaked at intervals corresponding to the width of a compartment, reflecting the underlying repetition of the place field map. This periodicity was also evident in the corridor fields (dotted line), although the peaks were slightly lower, reflecting the greater number of aperiodic place fields in the corridor.
Figure 6.
Figure 6.
Rate coding analysis, to see whether firing rates might contain information that could be used to disambiguate compartments. (A) Change in peak firing rate of place cells as a function of distance from the compartment having the peak rate, for naive rats (“First day”; open circles) or rats with extensive experience of the environment (“Last day”; closed circles). Below is shown a plan view of the apparatus, filled circles represent place fields from a single hypothetical place cell, illustrating the result shown above for comparison to the predictions in Figure 1. (B) Reconstruction error analysis, based on an ensemble of 15 simultaneously recorded cells, in which the firing rate population vector was used to reconstruct the position of the rat, and this position compared against the rat's actual position in the X- and Y-dimensions. The data for the whole 4-compartment environment were compared against the same dataset collapsed in the X-dimension (see inset) onto a single, composite compartment (thus losing compartment-specific information). For the whole-environment dataset, the X-error was much great than the Y-error, which reflects the ambiguity in the firing rate information about which environment the rat was in. When the data were collapsed onto a single-compartment reference frame, the X-error was slightly less, probably because the X-dimension was slightly but significantly less than the Y-dimension and there was thus less room for error. (C) The raw data were compared against the same data in which homologous bins in the 4 compartments were exchanged, so that compartment-specific rate information would be dispersed while spatial information common to all 4 compartments would be preserved. Although in both datasets the errors in the X-dimension were much larger than those in the Y-dimension, this error was even greater for the scrambled data than the raw data, suggesting a slight degree of compartment-specific information contained in the firing rate maps.
Figure 7.
Figure 7.
Remapping in place cells, showing red spikes superimposed on the black path of the rat, as in Figure 3. (A) Rate remapping, in which some cells appeared to differentiate the compartments by varying their firing rate. (B) The response of 3 cells to the context-change manipulation. The changed compartment is outlined in blue. Note that the change in firing was local to the changed compartment and did not spread beyond its confines. (C) The response of 3 cells to the wall-removal manipulation. Again, the change was local, affecting only the parts of the environment that were changed (in this case, all but the right-hand compartment).
Figure 8.
Figure 8.
Within-compartment spatial bin-by-bin correlations between the first and last baseline conditions, or between each baseline and the environment-change trials. (A) Context-change manipulation. (B) Wall-removal manipulation. The compartments of interest are labeled with black bars. In the context-change trials, this is compartment 3, which was changed from white to black: correlations with this compartment dropped markedly in the context-change manipulation. In the wall-removal trials, this was compartment 4, which was the only compartment not to be changed, and likewise the only compartment in which correlations did not drop significantly. **P < 0.001.
Figure 9.
Figure 9.
Changes in peak rates of place cell firing when the environments were changed. (A) and (B) are from the context-change manipulation, (C) and (D) from the wall-removal one. (A) In the context-change trials, overall peak rates became slightly more variable between the baseline conditions and the context-change condition, but this was not significant, even for the compartment that was actually changed (black bar). (B) Within-cell between-condition correlation of peak rates, however, showed a significant change, indicating variability of firing rate in the changed compartment (black bar) relative to the unchanged compartments/conditions. (C) Removal of the walls separating compartments 1–3 caused a drop in the overall firing rates in those regions of the environment (black bars), but not in the compartment that remained enclosed. (D) Correlations in peak rate firing dropped in the 2 central changed compartments in the changed condition when compared with the unchanged condition—the end compartment retained a relatively high correlation, perhaps because 3 of its 4 walls still remained. The firing rates in the unchanged compartment remained highly correlated throughout. *P < 0.05, (*)P < 0.05 only for the second comparison (wall-removal vs. second baseline).

References

    1. Ainge JA, Tamosiunaite M, Woergoetter F, Dudchenko PA. Hippocampal CA1 place cells encode intended destination on a maze with multiple choice points. J Neurosci. 2007;27:9769–9779. - PMC - PubMed
    1. Allen K, Rawlins JNP, Bannerman DM, Csicsvari J. Hippocampal place cells can encode multiple trial-dependent features through rate remapping. J Neurosci. 2012;32:14752–14766. - PMC - PubMed
    1. Alvernhe A, Van Cauter T, Save E, Poucet B. Different CA1 and CA3 representations of novel routes in a shortcut situation. J Neurosci. 2008;28:7324–7333. - PMC - PubMed
    1. Anderson MI, Jeffery KJ. Heterogeneous modulation of place cell firing by changes in context. J Neurosci. 2003;23:8827–8835. - PMC - PubMed
    1. Boccara CN, Sargolini F, Thoresen VH, Solstad T, Witter MP, Moser EI, Moser M-B. Grid cells in pre-and parasubiculum. Nat Neurosci. 2010;13:987–994. - PubMed

Publication types