Assessing socioeconomic vulnerability to dengue fever in Cali, Colombia: statistical vs expert-based modeling
- PMID: 23945265
- PMCID: PMC3765508
- DOI: 10.1186/1476-072X-12-36
Assessing socioeconomic vulnerability to dengue fever in Cali, Colombia: statistical vs expert-based modeling
Abstract
Background: As a result of changes in climatic conditions and greater resistance to insecticides, many regions across the globe, including Colombia, have been facing a resurgence of vector-borne diseases, and dengue fever in particular. Timely information on both (1) the spatial distribution of the disease, and (2) prevailing vulnerabilities of the population are needed to adequately plan targeted preventive intervention. We propose a methodology for the spatial assessment of current socioeconomic vulnerabilities to dengue fever in Cali, a tropical urban environment of Colombia.
Methods: Based on a set of socioeconomic and demographic indicators derived from census data and ancillary geospatial datasets, we develop a spatial approach for both expert-based and purely statistical-based modeling of current vulnerability levels across 340 neighborhoods of the city using a Geographic Information System (GIS). The results of both approaches are comparatively evaluated by means of spatial statistics. A web-based approach is proposed to facilitate the visualization and the dissemination of the output vulnerability index to the community.
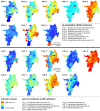
Results: The statistical and the expert-based modeling approach exhibit a high concordance, globally, and spatially. The expert-based approach indicates a slightly higher vulnerability mean (0.53) and vulnerability median (0.56) across all neighborhoods, compared to the purely statistical approach (mean = 0.48; median = 0.49). Both approaches reveal that high values of vulnerability tend to cluster in the eastern, north-eastern, and western part of the city. These are poor neighborhoods with high percentages of young (i.e., < 15 years) and illiterate residents, as well as a high proportion of individuals being either unemployed or doing housework.
Conclusions: Both modeling approaches reveal similar outputs, indicating that in the absence of local expertise, statistical approaches could be used, with caution. By decomposing identified vulnerability "hotspots" into their underlying factors, our approach provides valuable information on both (1) the location of neighborhoods, and (2) vulnerability factors that should be given priority in the context of targeted intervention strategies. The results support decision makers to allocate resources in a manner that may reduce existing susceptibilities and strengthen resilience, and thus help to reduce the burden of vector-borne diseases.
Figures


References
-
- Intergovernmental Panel on Climate Change. Climate change 2007: the physical science basis. contribution of working group I to the fourth assessment report of the intergovernmental panel on climate change. Cambridge, UK, and New York, NY, USA: Cambridge University Press; 2007.
-
- Gubler DJ. Epidemic dengue/dengue hemorrhagic fever as a public health, social and economic problem in the 21st century. Trends Microbiol. 2002;10:100–103. - PubMed
Publication types
MeSH terms
LinkOut - more resources
Full Text Sources
Other Literature Sources
Medical
Research Materials

