. 2013 Sep 12;501(7466):185-90.
doi: 10.1038/nature12464. Epub 2013 Aug 14.

RNAi screens in mice identify physiological regulators of oncogenic growth

Affiliations

RNAi screens in mice identify physiological regulators of oncogenic growth

Slobodan Beronja et al. Nature. .

Abstract

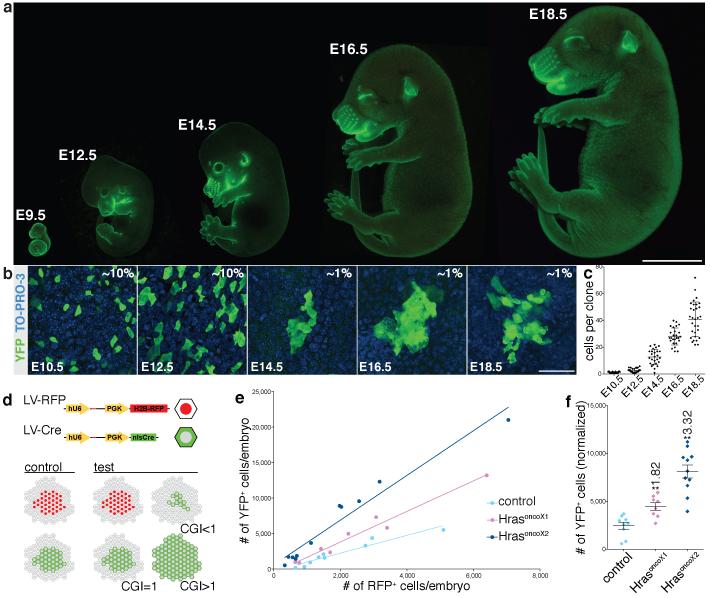
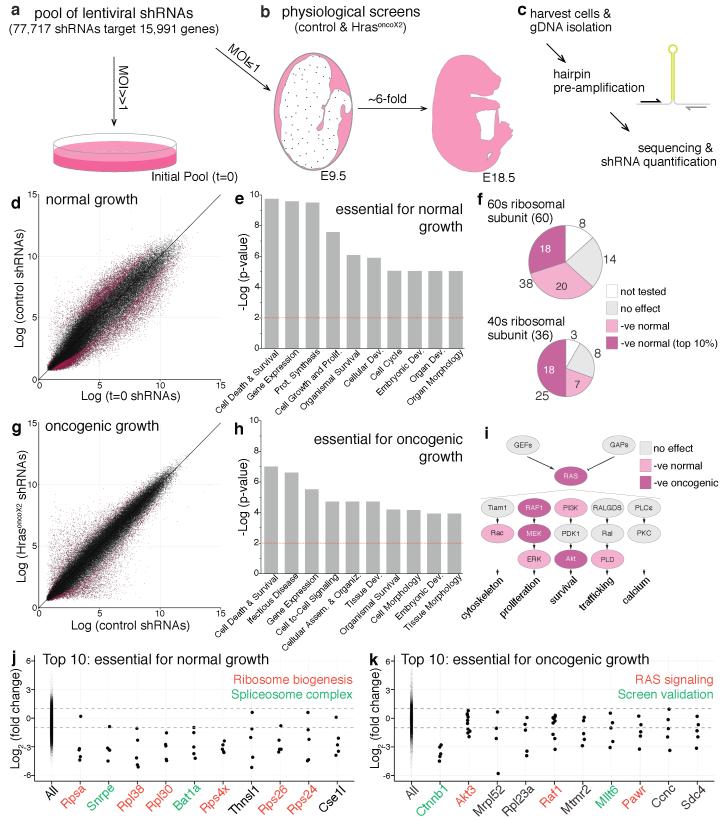
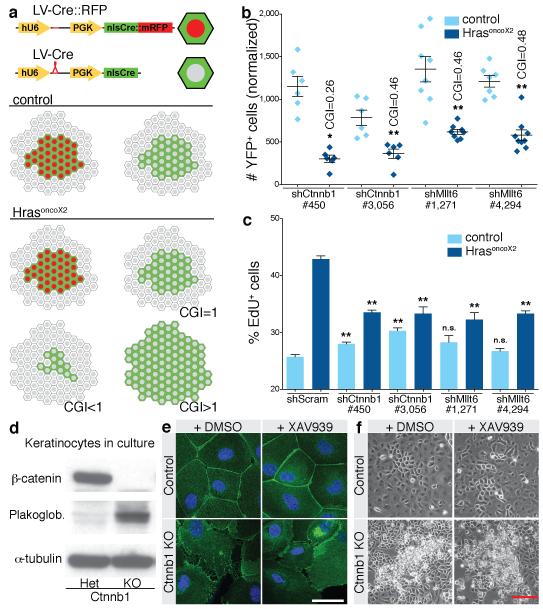
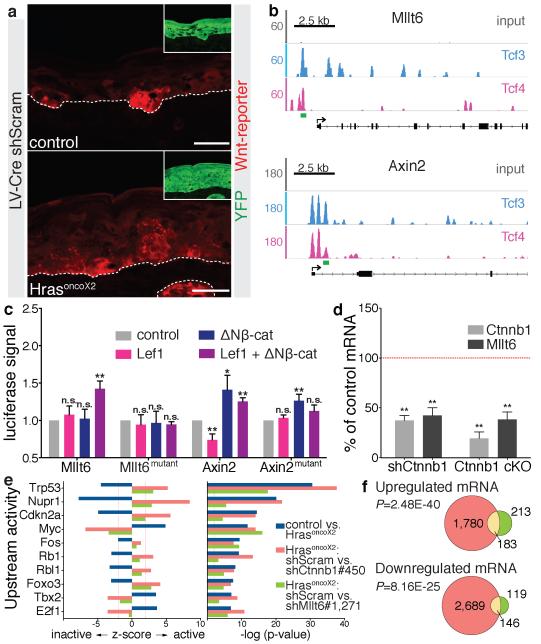
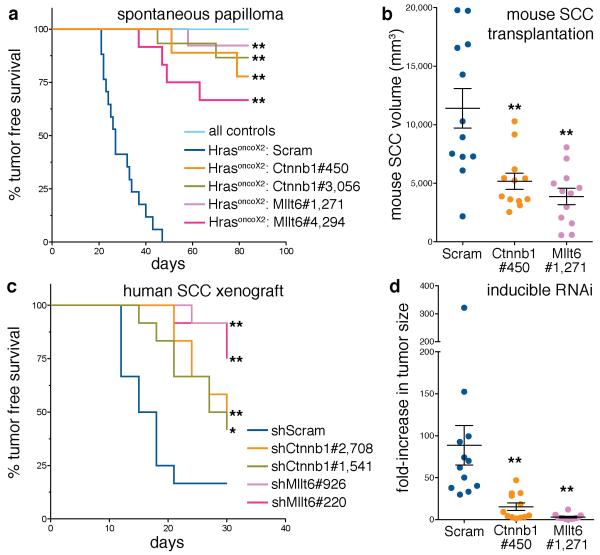
Tissue growth is the multifaceted outcome of a cell's intrinsic capabilities and its interactions with the surrounding environment. Decoding these complexities is essential for understanding human development and tumorigenesis. Here we tackle this problem by carrying out the first genome-wide RNA-interference-mediated screens in mice. Focusing on skin development and oncogenic (Hras(G12V)-induced) hyperplasia, our screens uncover previously unknown as well as anticipated regulators of embryonic epidermal growth. Among the top oncogenic screen hits are Mllt6 and the Wnt effector β-catenin, which maintain Hras(G12V)-dependent hyperproliferation. We also expose β-catenin as an unanticipated antagonist of normal epidermal growth, functioning through Wnt-independent intercellular adhesion. Finally, we validate functional significance in mouse and human cancers, thereby establishing the feasibility of in vivo mammalian genome-wide investigations to dissect tissue development and tumorigenesis. By documenting some oncogenic growth regulators, we pave the way for future investigations of other hits and raise promise for unearthing new targets for cancer therapies.


Figures

Figure 1
Figure 1. Embryonic epidermal tissue growth is rapid and responsive to oncogenic-Hras
a, Mouse embryogenesis, highlighted by Propidium Iodide (E9.5) or K14-actin::GFP (E12.5-18.5). b, r26yfp/+ Cre-reporter embryos infected at E9.5 with LV-Cre and analyzed at days shown. Transduced cells are YFP+. Transduction levels (% YFP+ cells) depend upon viral titre. c, Cell numbers in transduced YFP+ clones at ages shown. d, Schematic of CGI assay. E9.5 r26yfp/+ Cre-reporter (control) or genelox/lox r26yfp/+ (test) embryos are infected with LV-Cre and LV-RFP mix. At E18.5, numbers of RFP+:YFP+ cells in control and test animals are compared, and phenotypes scored as neutral (CGI=1), growth advantaged (CGI>1) or disadvantaged (CGI<1). e, Numbers of RFP+ and YFP+ cells at E18.5 in control, HrasoncoX1, and HrasoncoX2 embryos. Upper shift is consistent with growth advantage. f, RFP+ cell numbers normalized to YFP+ cells in control, HrasoncoX1, and HrasoncoX2 animals. CGI assay suggests a 1.8-fold overgrowth (P=0.002) in HrasoncoX1, and 3.3-fold overgrowth (P<0.0001) in HrasoncoX2 epidermis. Error bars indicate s.d (c) and s.e.m (f). For CGI assay (e,f), data points are individual embryos: control (n=9), HrasoncoX1 (n=8), HrasoncoX2 and (n=11). f, ** (P≤0.01) indicates statistical significance of comparison to control. Scale bars, (a) 5 mm, (b) 50 μm.
Figure 2
Figure 2. Genome-wide RNAi screens for physiological regulators of normal and oncogenic growth identify expected and surprising regulators
a-c, Schematic of the RNAi screens based on relative enrichment/depletion of individual shRNAs over time. a, shRNAs against 15,991 mouse genes are combined into a lentiviral pool whose composition is determined from the “Initial Pool” (t=0) experiment, where transduced cells are analyzed 24 hours after infection. b, Genes that regulate normal and oncogenic growth are identified in two screens, in which E9.5 control or K14-Cre+; HrasoncoX2 embryos are infected in utero, allowed to develop 9d, and processed. c, After epidermal tissues are harvested and used in gDNA isolation, individual shRNAs are pre-amplified and quantified by sequencing unique hairpin regions. d-k, Significantly enriched/depleted shRNAs identified using DESeq analysis. d, Dot plot of relative abundance of 77,717 shRNAs at t=0 and in E18.5 epidermis. e, Putative normal growth regulators are significantly enriched (P≥0.01) for gene function categories promoting cell viability and development. f, Normal growth regulators encode for ribosomal 60S and 40S subunit components (P=1.12E-09 and P=3.26E-07), with many in the top 10% of all hits (maroon). g, Relative shRNA abundance in control and HrasG12V animals reveal oncogenic growth altering shRNAs. h, Putative oncogenic growth regulators are enriched (P≥0.01) in gene categories that support cell growth. i, Downstream effectors of Ras signaling score as essential for growth (pink), with many exhibiting an oncogene-specific requirement (maroon). j,k, shRNAs for the top ten essential regulators of normal (d) and oncogenic (g) growth are markedly depleted relative to the genome-wide pool (All).
Figure 3
Figure 3. Suppressing β-Catenin and Mllt6 selectively affects HrasG12V-dependent epidermal hyperplasia
a, Modified CGI assay measures effect of shRNA-mediated gene knockdown in animals with Cre-activated transgene expression. Transduction with LV-Cre::RFP co-expressing Scrambled shRNA, and LV-Cre co-expressing candidate-targeting shRNA, leads to generation of YFP+RFP+ Scrambled and YFP+ knockdown clones in control or HrasG12V animals. Numbers of YFP+ cells (normalized to YFP+RFP+) in control and HrasoncoX2 animals reflect lentiviral mix composition after normal and oncogenic growth, respectively. b, Fewer YFP+ cells are found in oncogenic animals upon knockdown of Ctnnb1 and Mllt6 with independent shRNAs. c, Reduced EdU incorporation following Ctnnb1 knockdown in HrasG12V animals contrasts with increased proliferation in control epidermis. Mllt6 depletion also reduces EdU labeling in oncogenic growth. d, Immunoblot of control (Ctnnb1 Het) and Ctnnb1 KO keratinocyte lysates shows upregulation of Plakoglobin. e, Establishment of cell adhesion 48 hrs following Ca2+ shift is unaffected in keratinocytes treated with a Wnt-signaling inhibitor (XAV939) but impaired in Ctnnb1 knockout cells. E-cadherin (green) marks adherens junctions and Dapi (blue) labels the nuclei. f, Unlike control cells or cells treated with a Wnt-inhibitor, Ctnnb1 KO keratinocytes form overgrown foci upon reaching confluence. Error bars (b,c) indicate s.e.m. Data points (b,c) represent individual embryos with n=6 (shCtnnb1 and shScram in control), n=7 (shMllt6#4,294 in control), n=8 (shMllt6#1.271), n=9 (shMllt6#4,294 in HrasG12V), or n=10 (shScram in HrasG12V), each scored through immunofluorescence analysis of ten 425.1 μm2 images. b,c, n.s. (not significant, P>0.05), * (P≤0.05), and ** (P≤0.01) indicate statistical significance. Scale bars, (e) 50 μm, (f) 10 μm.
Figure 4
Figure 4. HrasG12V-induced epidermal growth impacts other signaling pathways
a, Wnt-reporter activity is restricted to hair placodes in control skin (top) but extends to interfollicular epidermis in HrasoncoX2 animals (bottom). YFP (inset) marks LV-Cre-transduced epidermis. White dotted line demarcates dermal-epidermal boundary. Dapi labels nuclei. b, CHIP-seq peaks on chromosome 11 reveal TCF3 (blue) and TCF4 (pink) binding sites in Mllt6 and Axin2 promoter regions. Negative control (gray) is total genome DNA. Green bars represent the ~300bp fragment used to validate TCF3/4 binding. c, hLEF1 (TCF3/4 family member) and stabilized β-catenin (ΔNβ-cat) together promote luciferase activity when putative TCF3/4 binding sites of Mllt6 and Axin2 are used as drivers. These effects are not observed when the TCF3/4 binding motifs are mutated. d, Mllt6 and Ctnnb1 mRNA epidermal levels are reduced by Ctnnb1 knockdown (shCtnnb1#450) or knockout (cKO). e, Transcriptional profile of HrasG12V epidermal progenitors reveals repression of tumor suppressors (eg. TRP53, CDKN2A, RB1) and activation of oncogenic signaling (eg. MYC, E2F1). shRNA-mediated depletion of Ctnnb1 or Mllt6 in HrasG12V epidermis significantly counter these transcriptional changes. Red vertical lines represent significant activation z-score (two-fold) and p-value of a correct prediction (p=0.01). f, Significant overlap in differentially regulated transcripts is observed following depletion of β-catenin and Mllt6 in HrasG12V epidermal progenitors. Error bars indicate (c) s.e.m. and (d) s.d. In real-time PCR experiment (d), data are shown for three embryos assayed in two independent reactions (n=6). c,d, n.s. (not significant, P>0.05), * (P≤0.05), and ** (P≤0.01) indicate statistical significance. Scale bar, 50 μm.
Figure 5
Figure 5. β-catenin and Mllt6 depletion impair HrasG12V-dependent tumorigenesis
a, shRNA-mediated depletion of Ctnnb1 or Mllt6 delays spontaneous tumor initiation in HrasoncoX2 mice (n=9 in all conditions except LV-Scram transduced HrasoncoX2 n=18). Control lines correspond to animals transduced with shRNAs with no impact on tumorigenesis. b, Tumor volume of Ctnnb1- and Mllt6-depleted mouse SCCs transplants are significantly reduced after 30 days of growth. c, Tumor initiation following xenotransplantation of shRNA-transduced human SCC cells is significantly delayed following knockdown of human Ctnnb1 or Mllt6. d, Induction of Ctnnb1 or Mllt6 knockdown in preexisting spontaneous mouse papillomas results in impaired growth and sometimes regression. a-d, Transduction of Scrambled shRNA (Scram) served as control. Error bars (b,d) indicate s.e.m. b-d, n=12 transplants (b,c) or tumors (d). * (P≤0.05), and ** (P≤0.01) indicates statistical significance of the observed differences.

Comment in

References

    1. Beronja S, Livshits G, Williams S, Fuchs E. Rapid functional dissection of genetic networks via tissue-specific transduction and RNAi in mouse embryos. Nat Med. 2010;16:821–827. - PMC - PubMed
    1. Williams SE, Beronja S, Pasolli HA, Fuchs E. Asymmetric cell divisions promote Notch-dependent epidermal differentiation. Nature. 2011;470:353–358. - PMC - PubMed
    1. Ezratty EJ, et al. A role for the primary cilium in Notch signaling and epidermal differentiation during skin development. Cell. 2011;145:1129–1141. - PMC - PubMed
    1. Oshimori N, Fuchs E. Paracrine TGF-beta signaling counterbalances BMP-mediated repression in hair follicle stem cell activation. Cell Stem Cell. 2012;10:63–75. - PMC - PubMed
    1. Srinivas S, et al. Cre reporter strains produced by targeted insertion of EYFP and ECFP into the ROSA26 locus. BMC Dev Biol. 2001;1:4. - PMC - PubMed

Publication types

MeSH terms

Associated data