. 2013 Aug 14;33(33):13375-87.
doi: 10.1523/JNEUROSCI.5286-12.2013.

Hypoxia-induced developmental delays of inhibitory interneurons are reversed by environmental enrichment in the postnatal mouse forebrain

Affiliations

Hypoxia-induced developmental delays of inhibitory interneurons are reversed by environmental enrichment in the postnatal mouse forebrain

Mila Komitova et al. J Neurosci. .

Abstract

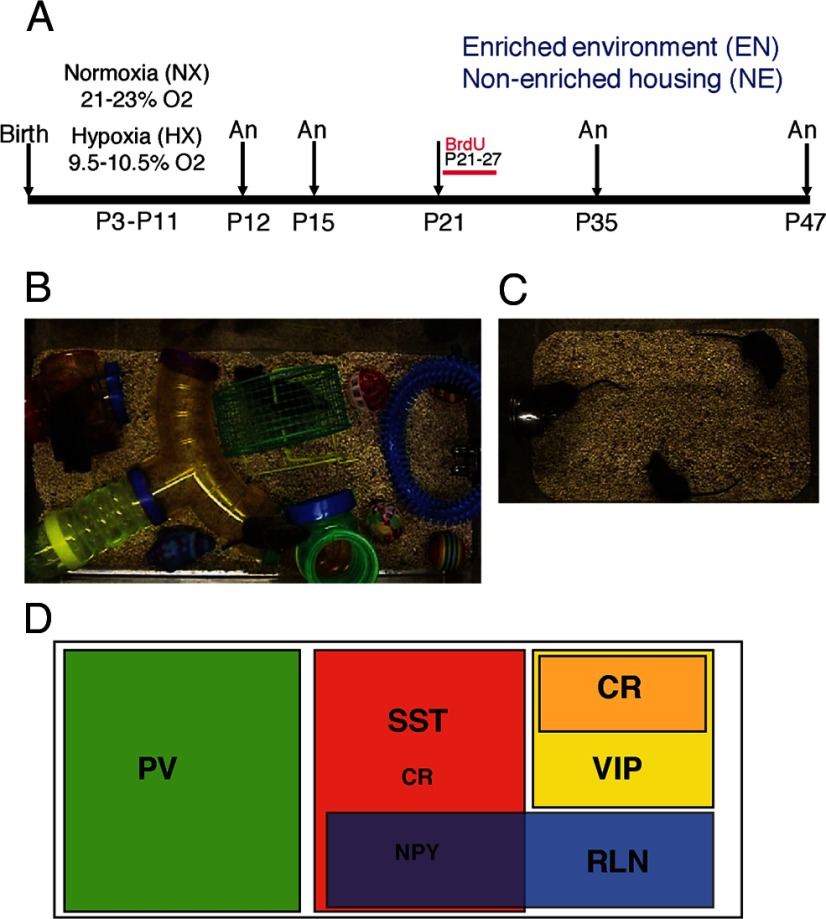
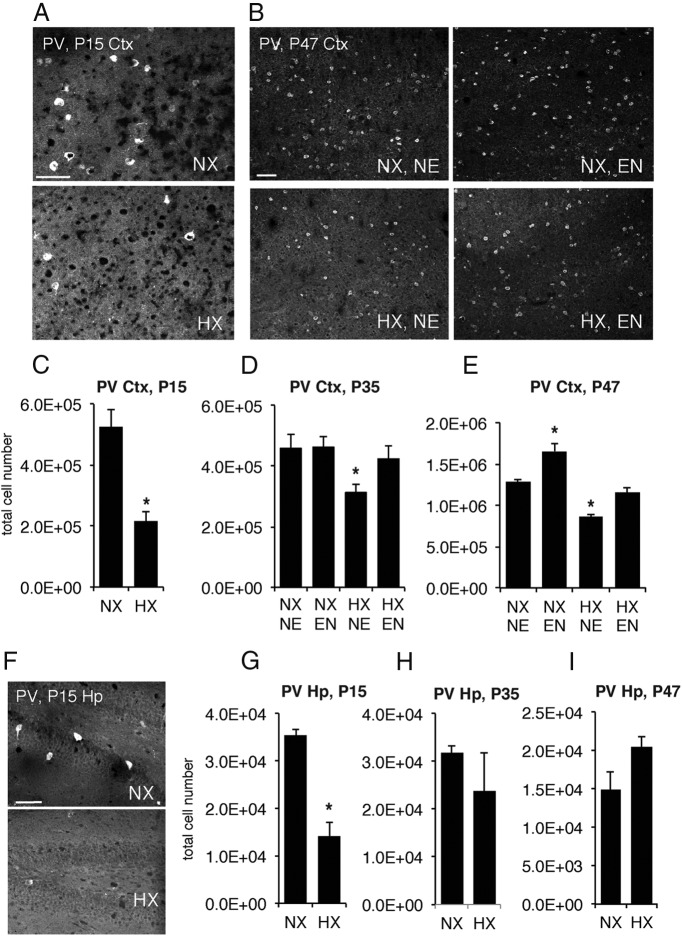
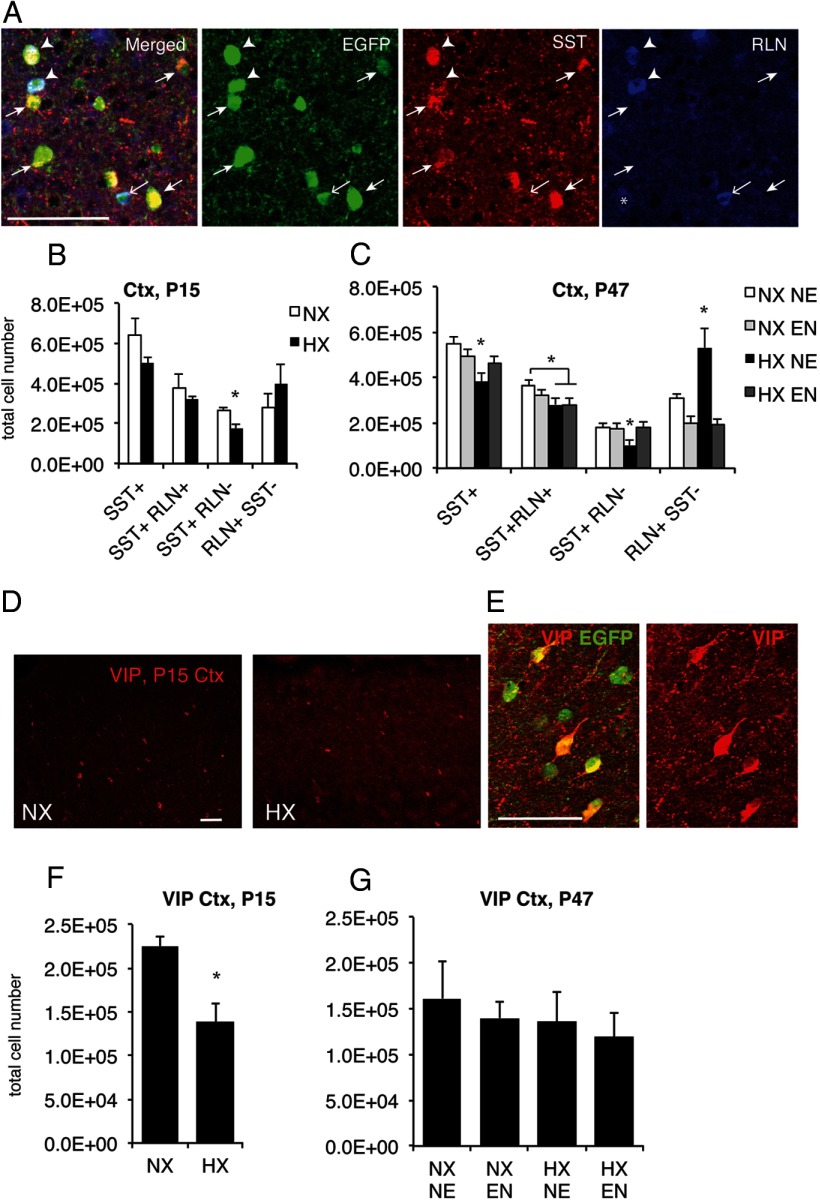
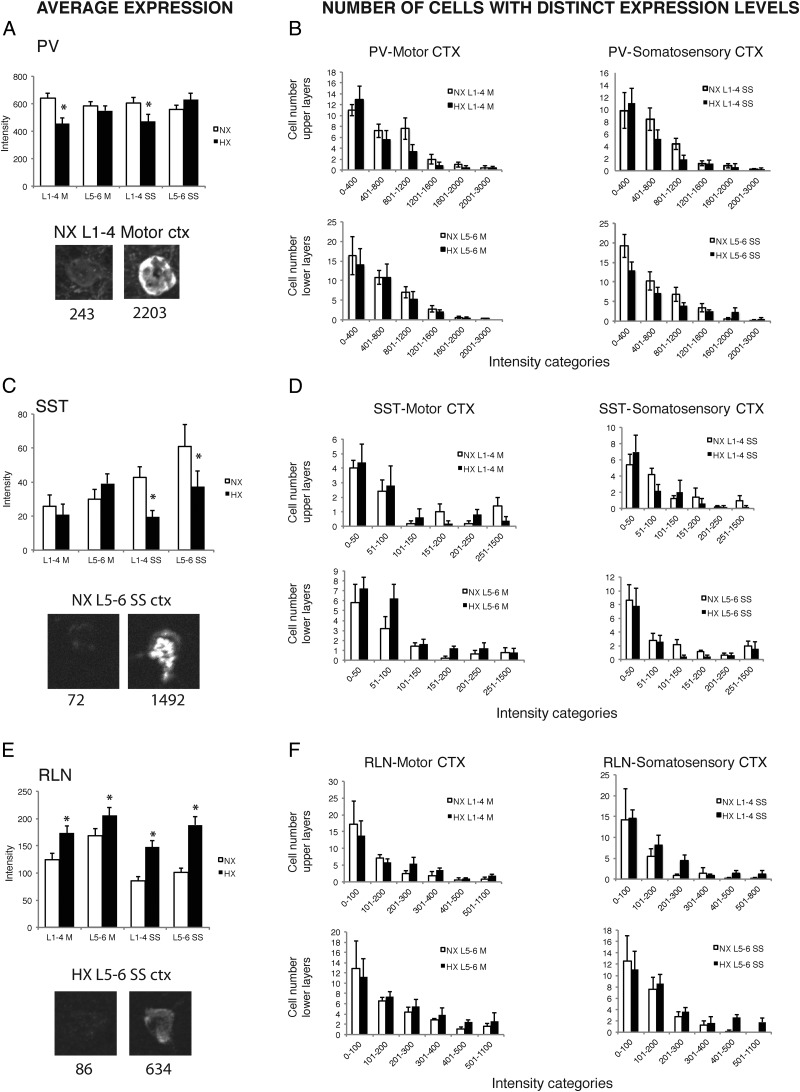
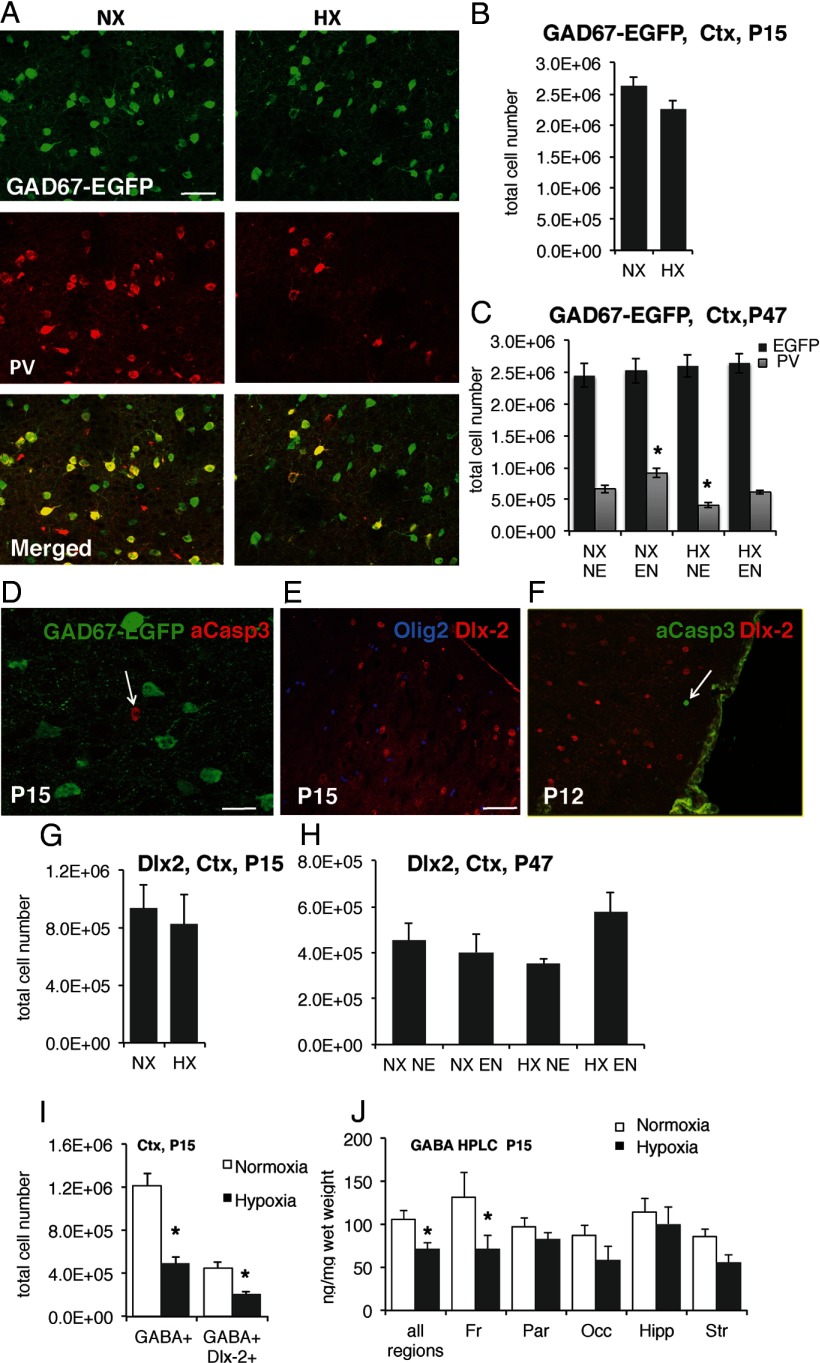
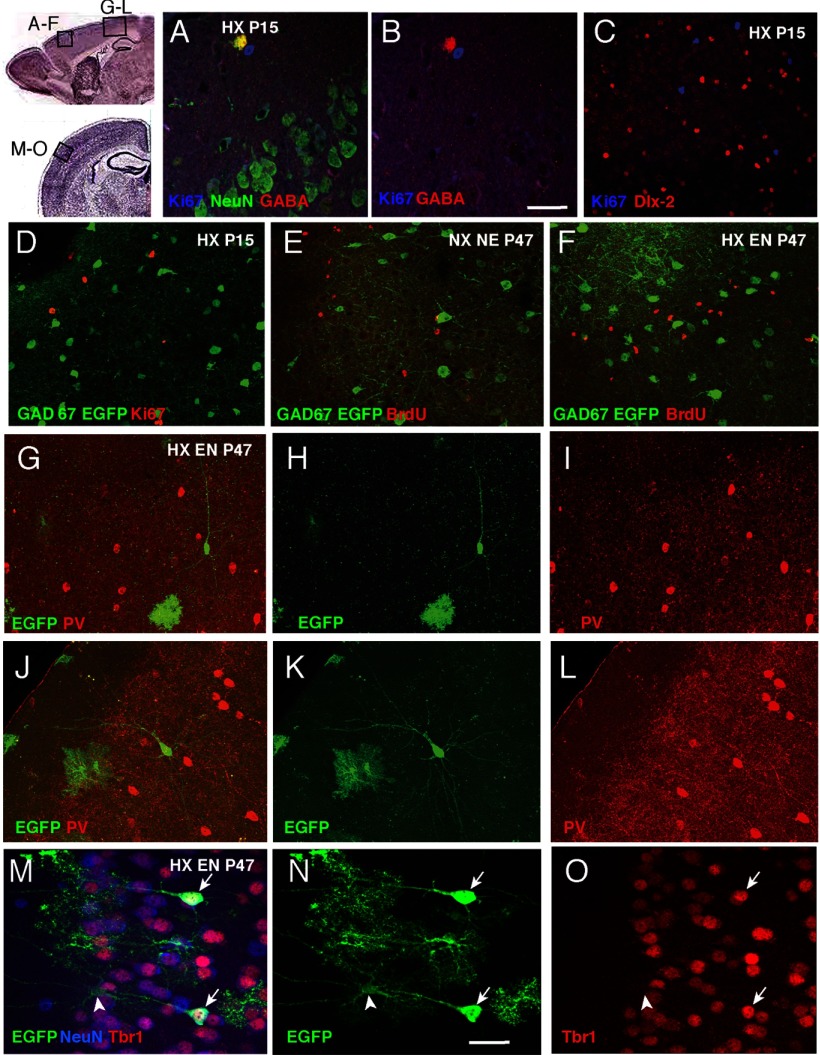
Infants born premature experience hypoxic episodes due to immaturity of their respiratory and central nervous systems. This profoundly affects brain development and results in cognitive impairments. We used a mouse model to examine the impact of hypoxic rearing (9.5-10.5% O2) from postnatal day 3 to 11 (P3-P11) on GABAergic interneurons and the potential for environmental enrichment to ameliorate these developmental abnormalities. At P15 the numbers of cortical interneurons expressing immunohistochemically detectable levels of parvalbumin (PV), somatostatin (SST), and vasoactive intestinal peptide were decreased in hypoxic-reared mice by 59%, 32%, and 38%, respectively, compared with normoxic controls. Hypoxia also decreased total GABA content in frontal neocortex by 31%. However, GAD67-EGFP knock-in mice reared under hypoxic conditions showed no changes in total number of GAD67-EGFP(+) cells and no evidence of increased interneuron death, suggesting that the total number of interneurons was not decreased, but rather, that hypoxic-rearing decreased interneuron marker expression in these cells. In adulthood, PV and SST expression levels were decreased in hypoxic-reared mice. In contrast, intensity of reelin (RLN) expression was significantly increased in adult hypoxic-reared mice compared with normoxic controls. Housing mice in an enriched environment from P21 until adulthood normalized phenotypic interneuron marker expression without affecting total interneuron numbers or leading to increased neurogenesis. Our data show that (1) hypoxia decreases PV and SST and increases RLN expression in cortical interneurons during postnatal cortical development and (2) enriched environment has the capacity to normalize the interneuron abnormalities in cortex.


Figures

Figure 1.
Figure 1.
A, Experimental design of the study. Mice were housed in normoxic (NX) or hypoxic (HX) conditions from P3 to P11. Mice were perfused and analyzed (An) at P12, P15, P35, and P47. Upon weaning at P21, mice were either introduced into enriched environment (EN; B) or housed in standard, nonenriched (NE) conditions (C). An, time of analysis. D, Schematic of the different interneuron subpopulations identified by the different markers used in the study (adapted from Gelman and Marín, 2010). NPY, neuropeptide Y.
Figure 2.
Figure 2.
Effects of hypoxic rearing and environmental enrichment on PV-expressing interneurons. A, B, PV immunohistochemistry in the neocortex of normoxic (NX) and hypoxic (HX)-reared mice at P15 (A) and P47 (B); P47 groups of NX and HX mice were reared in standard, nonenriched (NE) or enriched (EN) environments from P21 until analysis. Stereological quantification of PV+ cells in P15 (C), P35 (D), and P47 (E) cortex (Ctx) for all four experimental groups. Rearing mice in HX decreased PV interneuron numbers in neocortex and subsequent EN normalized PV+ cell numbers (P35: main effect of hypoxia, p < 0.05; P47: main effect of hypoxia and enrichment, both p < 0.001). F–I, Hippocampal (Hp) PV immunolabeling (F) and stereological quantification of PV+ cells at P15 (G), 35 (H), and 47 (I). Rearing mice in HX decreased PV+ interneurons in the hippocampus at P15 but PV+ cells recovered spontaneously. Scale bars: 20 μm. Asterisks denote significant differences from all other groups at p < 0.05.
Figure 3.
Figure 3.
Effects of hypoxic and enriched environment on SST, RLN, and VIP-immunopositive interneurons in neocortex. A, Immunolabeling with EGFP, RLN, and SST antibodies in P47 cortex from GAD67-EGFP mice, illustrating the presence of different subpopulations of interneurons: EGFP+/SST+/RLN (small closed arrows), EGFP+/SST/+/RLN+ (arrowheads), and EGFP+/RLN+/SST (open arrow). Asterisk indicates an EGFP/RLN+/SST cell. B, C, Stereological quantification of EGFP+ cells coexpressing SST and/or RLN at P15 (B) and at P47 (C). Both SST+/RLN and SST+/RLN+ interneurons were decreased in hypoxic-reared mice, but while the first recovered to control levels with subsequent enrichment, SST+/RLN+ interneurons did not recover with subsequent enrichment. In contrast, RLN+/SST interneurons increased after hypoxia and were also normalized with enriched environment at P47. D, Decreased number VIP+ interneurons in P15 hypoxic cortex (Ctx) shown by immunostaining with VIP antibodies; stereological quantification shown in F. E, Higher magnification image of supragranular Ctx demonstrating that all VIP+ cells coexpress GAD67-EGFP at P15. G, Stereological quantification of VIP+ cells in neocortex at P47 showing that VIP+ cells recovered spontaneously and there was no further effect of enriched environment. NX NE, normoxic nonenriched; NX EN, normoxic enriched; HX NE, hypoxic nonenriched; HX EN, hypoxic enriched. Scale bars: 20 μm. Asterisks denote significant differences from all other groups at p < 0.05.
Figure 4.
Figure 4.
Intensity and distribution of expression of interneuron marker expression in upper (L1–L4) and lower (L5–L6) layers of primary motor or primary somatosensory cortex (hindlimb) of normoxic and hypoxic mice at P47. Quantification of average expression and numbers of cells with distinct expression levels, respectively, with regards to PV (A, B), SST (C, D), and RLN (E, F). Asterisks denote significant differences (p < 0.05) as determined by factorial ANOVA conducted for each marker. Images depict representative examples of single cells expressing low or high levels of a given marker. The numbers signify the background corrected intensity of cell fluorescence for each cell and marker. NX, normoxia; HX, hypoxia; M, motor cortex; SS, somatosensory cortex; L1–4, cortical layers 1–4; L5–6, cortical layers 5 and 6; ctx, cortex.
Figure 5.
Figure 5.
Analysis of interneuron lineage cells in the neocortex. A, Costaining of PV (red) and GAD67-EGFP reporter (green) in P15 cortex (Ctx). B, C, Stereological quantification of GAD67 EGFP+ cells in the cortex (Ctx) at P15 (B) and P47 (C). EGFP+ cell numbers do not change across conditions, whereas PV+ cells counted in the same sections are decreased by hypoxia (HX) and increased by enriched environment (EN). D–F, P12–P15 neocortex from HX-reared mice labeled with antibodies to activated caspase-3 (red) and GAD67-EGFP (green; D), Dlx-2 (red), and Olig2 (blue; E), and activated caspase-3 (green) and Dlx-2 (red; F). Interneurons do not undergo noticeable increases in cell death in response to rearing in HX. G, H, Stereological quantification of Dlx-2+ cells in P15 (G) and P47 (H) neocortex. There are no significant changes in Dlx-2+ cell numbers in response to HX or EN. I, The numbers of all GABA+ cells and GABA+Dlx-2+ colabeled cells in P15 cortex were decreased in HX-reared mice. J, HPLC measurement of GABA content in different brain regions showed that HX rearing significantly decreased GABA in frontal cortex. Scale bars: A, E, 20 μm; D, 10 μm. Asterisks denote significant differences from normoxic controls at p < 0.05. NX NE, normoxic nonenriched; NX EN, normoxic enriched; HX NE, hypoxic nonenriched; HX EN, hypoxic enriched; Fr, frontal; Par, parietal; Occ, occipital, Hipp, hippocampus; Str, striatum.
Figure 6.
Figure 6.
Assessment of cell proliferation and neurogenesis in cortex. Boxed areas on a sagittal and coronal cresyl violet-stained section depict where the images were taken. A, Costaining of P15 cortex from hypoxic (HX)-reared mice with Ki67 (blue), GABA (red), and NeuN (green) showing a Ki67+ cell next to a GABA+ NeuN+ double-labeled cell (yellow when colocalized). B, Same staining with the NeuN channel extinguished, showing the GABA-positive cell (red) next to and distinct from the Ki67-positive cell (red). C, D, Immunolabeling of P15 cortex from HX-reared mice with Ki67 (blue) and Dlx-2 (red; C), and GAD67-EGFP (green) and Ki67 (red; D showing lack of proliferation in interneuron lineage cells. E, F, GAD67-EGFP (green) and BrdU (red) colabeling of P47 cortex from normoxic nonenriched (NX NE; E) and hypoxic-reared enriched mice (HX EN; F) showing lack of interneuron generation. G–L, Immunolabeling of P47 cortex with EGFP (green) and PV (red) in P47 cortical sections from GCE mice, in which GFAP+ cells had been permanently tagged with reporter by administering tamoxifen at P12–P14. Note EGFP reporter+ cells with neuronal morphology that lack PV expression and the presence of EGFP reporter+ bushy morphology typical of astroglia. M–O, Immunolabeling of P47 cortex with EGFP (green), Tbr1 (red), and NeuN (blue) in P47 cortical sections from GCE mice, showing genesis of Tbr1+ neurons from GFAP+ cells (arrows). Arrowheads point to astrocytes. Scale bars: A, B, M–O, 10 μm; in all other parts, 20 μm.

References

    1. Bartos M, Vida I, Jonas P. Synaptic mechanisms of synchronized gamma oscillations in inhibitory interneuron networks. Nat Rev Neurosci. 2007;8:45–56. doi: 10.1038/nrn2044. - DOI - PubMed
    1. Batista-Brito R, Fishell G. The developmental integration of cortical interneurons into a functional network. Curr Top Dev Biol. 2009;87:81–118. doi: 10.1016/S0070-2153(09)01203-4. - DOI - PMC - PubMed
    1. Behrens MM, Ali SS, Dao DN, Lucero J, Shekhtman G, Quick KL, Dugan LL. Ketamine-induced loss of phenotype of fast-spiking interneurons is mediated by NADPH-oxidase. Science. 2007;318:1645–1647. doi: 10.1126/science.1148045. - DOI - PubMed
    1. Ben-Ari Y. Excitatory actions of GABA during development: the nature of the nurture. Nat Rev Neurosci. 2002;3:728–739. doi: 10.1038/nrn920. - DOI - PubMed
    1. Bi B, Salmaso N, Komitova M, Simonini MV, Silbereis J, Cheng E, Kim J, Luft S, Ment LR, Horvath TL, Schwartz ML, Vaccarino FM. Cortical glial fibrillary acidic protein-positive cells generate neurons after perinatal hypoxic injury. J Neurosci. 2011;31:9205–9221. doi: 10.1523/JNEUROSCI.0518-11.2011. - DOI - PMC - PubMed

Publication types

MeSH terms

LinkOut - more resources