. 2013 Aug 14;33(33):13388-97.
doi: 10.1523/JNEUROSCI.0967-13.2013.

Robust encoding of stimulus identity and concentration in the accessory olfactory system

Affiliations

Robust encoding of stimulus identity and concentration in the accessory olfactory system

Hannah A Arnson et al. J Neurosci. .

Abstract

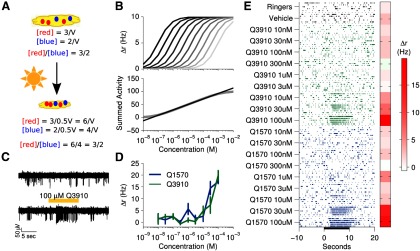
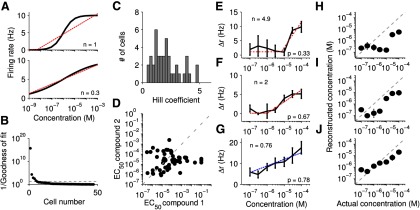
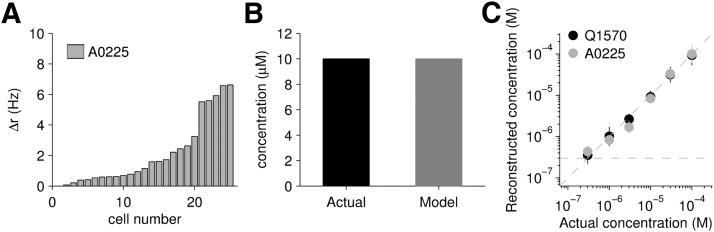
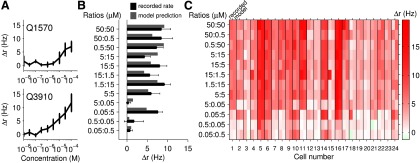
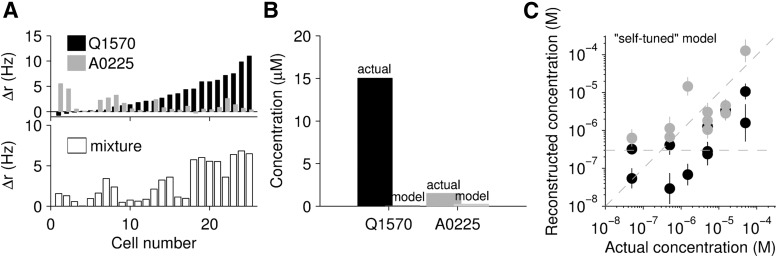
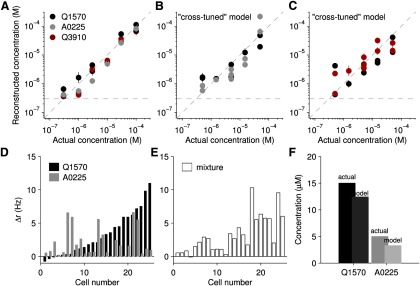
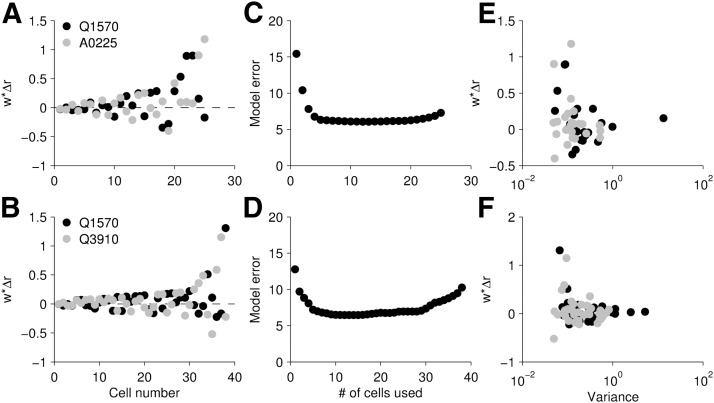
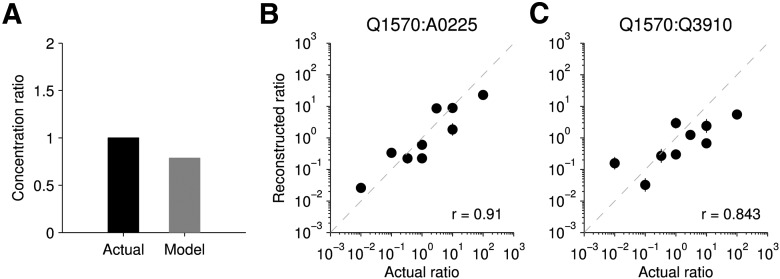
Sensory systems represent stimulus identity and intensity, but in the neural periphery these two variables are typically intertwined. Moreover, stable detection may be complicated by environmental uncertainty; stimulus properties can differ over time and circumstance in ways that are not necessarily biologically relevant. We explored these issues in the context of the mouse accessory olfactory system, which specializes in detection of chemical social cues and infers myriad aspects of the identity and physiological state of conspecifics from complex mixtures, such as urine. Using mixtures of sulfated steroids, key constituents of urine, we found that spiking responses of individual vomeronasal sensory neurons encode both individual compounds and mixtures in a manner consistent with a simple model of receptor-ligand interactions. Although typical neurons did not accurately encode concentration over a large dynamic range, from population activity it was possible to reliably estimate the log-concentration of pure compounds over several orders of magnitude. For binary mixtures, simple models failed to accurately segment the individual components, largely because of the prevalence of neurons responsive to both components. By accounting for such overlaps during model tuning, we show that, from neuronal firing, one can accurately estimate log-concentration of both components, even when tested across widely varying concentrations. With this foundation, the difference of logarithms, log A - log B = log A/B, provides a natural mechanism to accurately estimate concentration ratios. Thus, we show that a biophysically plausible circuit model can reconstruct concentration ratios from observed neuronal firing, representing a powerful mechanism to separate stimulus identity from absolute concentration.


Figures

Figure 1.
Figure 1.
VSNs respond to a wide range of concentrations A, An example of environmental uncertainty facing the AOS. The concentration of ligands measured in a pool of urine of volume V depends strongly on environmental uncertainties, such as evaporation. However, ratios allow for robust representation of concentration invariant to environmental uncertainties. B, A population of idealized cells with slightly different sensitivities to the same compound are shown (top). Summing their activity produces a result that is linear with respect to log-concentration (bottom) over the range spanned by the cells. C, An example voltage trace from a single electrode in response to Ringer's solution control (top) and Q3910 (bottom). The tissue was stimulated for 10 s. D, Summary of average firing rates in response to presented stimuli in the same cell as shown in C. Error bars correspond to the SEM. E, A raster plot of the same cell shown in C and D in response to two negative controls and nine concentrations of two different sulfated steroids. Each stimulus was presented five times (rows within each block). Average firing rate is shown on the right.
Figure 2.
Figure 2.
Single neuron encoding of log-concentration. A, Top, Simulated cell with a “typical” Hill-response profile (black line). To demonstrate that the concentrations around the EC50 approximate log-concentration, we fit the response with a rectified-log model (red dotted line). Bottom, Another simulated cell with a smaller Hill coefficient. This cell approximates log-concentration over the entire range shown (red dotted line). B, Goodness of fit to the Hill model for each VSN as measured by the 1/p value to the χ2 fit. Cells below the dotted line (p = 0.05) are well described by the model (n = 47 neurons from 18 mice). C, Hill coefficients for each VSN. D, EC50 to each compound. E–G, Example cells with a rectified-log model (red dotted line) or an unrectified log model (blue dotted line). H–J, Reconstruction of log-concentration using the response of the cell to the left. Whereas J provides a reasonable approximation of log-concentration, I does so only at a few higher concentrations and H does only at nonresponsive concentrations.
Figure 3.
Figure 3.
Population coding of log-concentration. A, The activity of 25 cells from 18 mice that were stimulated with 10 μm A0225, sorted by response magnitude. B, The actual concentration presented (black) and the model reconstruction (gray). C, Using the firing rates obtained in response to six different concentrations of a sulfated steroid presented individually, log-concentration was accurately reconstructed.
Figure 4.
Figure 4.
Competitive binding. A, The response of a cell to a range of concentrations of Q1570 (top) and Q3910 (bottom). B, The response of the same cell to binary mixtures of Q1570 and Q3910 (black). Using the Hill model parameters fit to this cell previously, we predicted the expected firing rate to these mixtures given that the cell follows competitive binding (gray). The model fit and recorded rates closely agree, providing evidence for the competitive binding model. C, The recorded response (left side of each column) and predicted response (right side of each column) to sulfated steroid mixtures across the population of 24 cells from 18 mice.
Figure 5.
Figure 5.
Log-concentration reconstruction from population response to mixtures. A, The response of a population of cells stimulated with 30 μm Q1570 (black) (25 cells, 18 mice) and 3 μm A0225 (gray), presented individually (top). Bottom, The response of the same population of cells to the mixture of the two compounds at half their concentrations (15 μm Q1570 and 1.5 μm A0225). B, Using weights set from responses to pure compounds, we tested the model with the responses to mixtures. The actual versus model reconstructed concentrations are shown. The model poorly reconstructs the concentration of both compounds. C, Mixture element concentration reconstruction using the same technique described in B across a larger range of concentrations. The reconstructed concentration does not appear to accurately capture the stimulated concentration across the range of stimuli.
Figure 6.
Figure 6.
Population coding taking nonlinearities into account. A, Reconstructed versus actual concentration in response to the pure compounds of Q1570, A0225, and Q3910 presented individually. Error bars indicate SE (n = 63 cells from 18 mice). B, C, Reconstructed versus actual concentration of mixture components using two populations of neurons: 25 cells (B) and 38 cells (C). Using the recorded responses to mixtures, the model was able to disambiguate mixture elements and concentrations. D, The response of a population of cells to two sulfated steroids presented separately (30 μm Q1570 and 10 μm A0225). E, The response of the same population in the same order, to the mixture of the two compounds at half their original concentrations (15 μm Q1570 and 5 μm A0225). F, The model reconstruction of each element of the mixture compared with the actual concentrations of the mixture elements.
Figure 7.
Figure 7.
Contributions of individual neurons to reconstruction. A, B, Weight times the maximum firing rate of that cell, corresponding to throughput, or how much information the cell contributed. Each cell has two weights, one per compound. Cells are ordered based on maximum w × Δr; n = 25 cells from 9 mice (top) and n = 38 cells from 9 mice (bottom). C, D, Model error as a function of numbers of cells used (Q1570, A0225 top, Q1570, Q3910 bottom), starting with the most informative cells. Model error corresponds to the sum of squares error. E, F, Weight times maximum firing rate (as in A,B) as a function of variance in the fit of the EC50 value in the Hill model fitting. The more reliable cells (with smaller variance) tend to be the most heavily used by the model.
Figure 8.
Figure 8.
Log-ratio reconstruction. A, Actual and model reconstructed ratio for an example ratio. The example mixture was of 5 μm Q1570 and 5 μm A0225. B, C, Actual versus model reconstruction of the log-ratio using two different populations of VSNs. Error bars indicate SEM and are typically smaller than the points; n = 25 cells from 9 mice (A, B) and n = 38 cells from 9 mice (C). r indicates the correlation coefficient. There is a high degree of correlation.

References

    1. Ache BW, Young JM. Olfaction: diverse species, conserved principles. Neuron. 2005;48:417–430. doi: 10.1016/j.neuron.2005.10.022. - DOI - PubMed
    1. Arnson HA, Fu X, Holy TE. Multielectrode array recordings of the vomeronasal epithelium. J Vis Exp. 2010;37 - PMC - PubMed
    1. Baker TC, Cardé RT, Roelofs WL. Behavioral responses of male Argyrotaenia velutinana (Lepidoptera: Tortricidae) to components of its sex pheromone. J Chem Ecol. 1976;2:333–352. doi: 10.1007/BF00988281. - DOI
    1. Barbour DL. Intensity-invariant coding in the auditory system. Neurosci Biobehav Rev. 2011;35:2064–2072. doi: 10.1016/j.neubiorev.2011.04.009. - DOI - PMC - PubMed
    1. Belluscio L, Koentges G, Axel R, Dulac C. A map of pheromone receptor activation in the mammalian brain. Cell. 1999;97:209–220. doi: 10.1016/S0092-8674(00)80731-X. - DOI - PubMed

Publication types

LinkOut - more resources