. 2013 Aug 14;33(33):13398-409.
doi: 10.1523/JNEUROSCI.6255-11.2013.

Synaptic state-dependent functional interplay between postsynaptic density-95 and synapse-associated protein 102

Affiliations

Synaptic state-dependent functional interplay between postsynaptic density-95 and synapse-associated protein 102

Stéphanie A D Bonnet et al. J Neurosci. .

Abstract

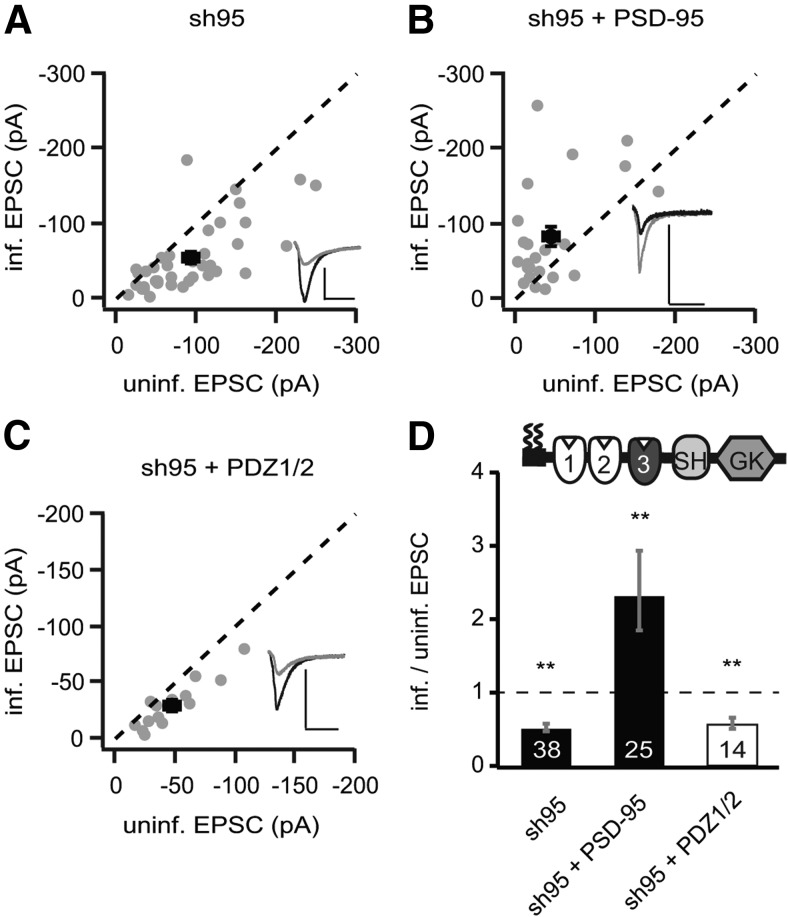
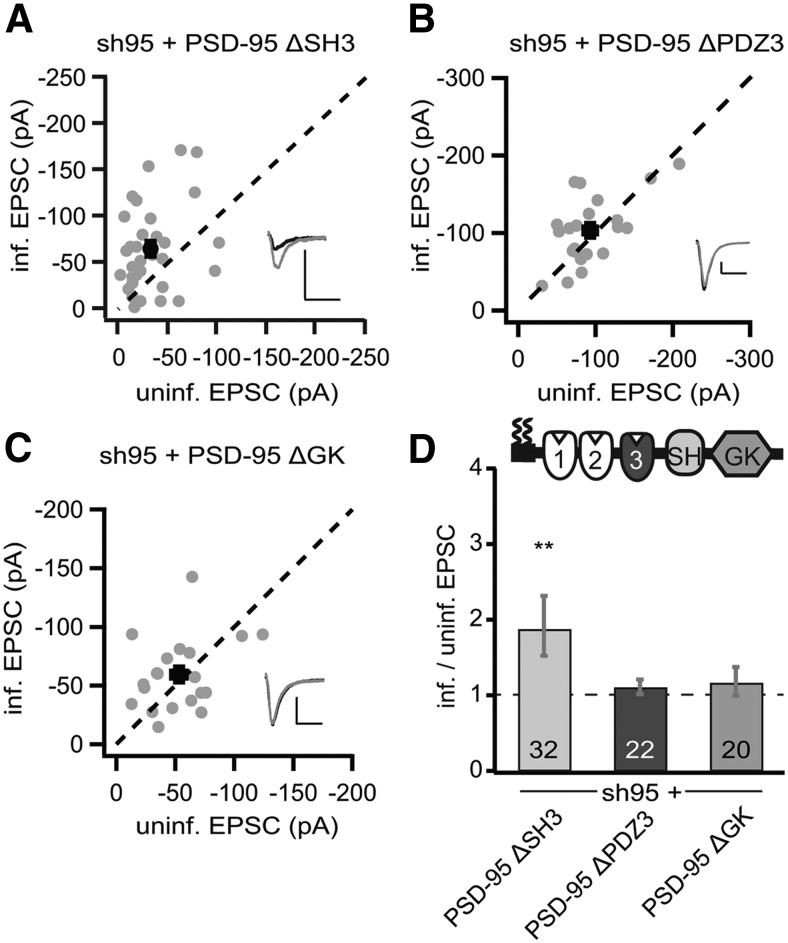
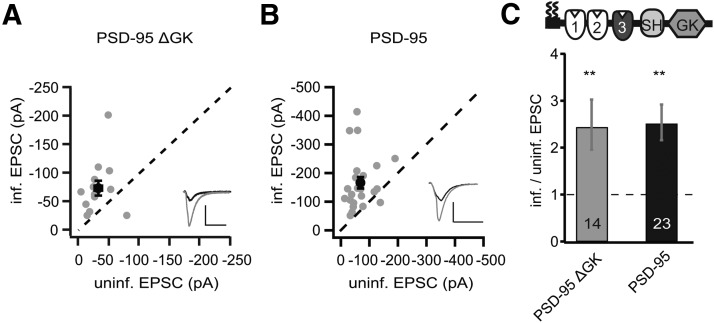
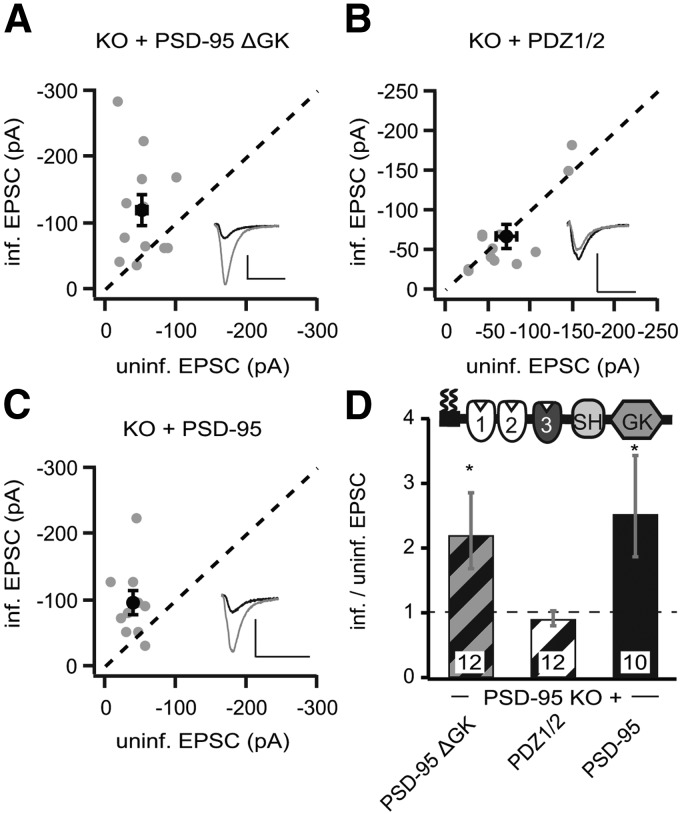
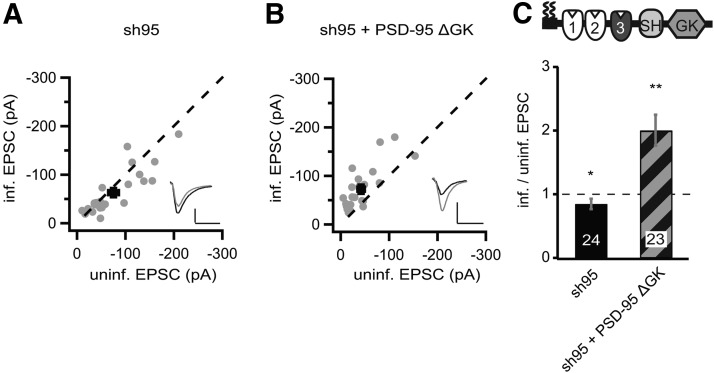
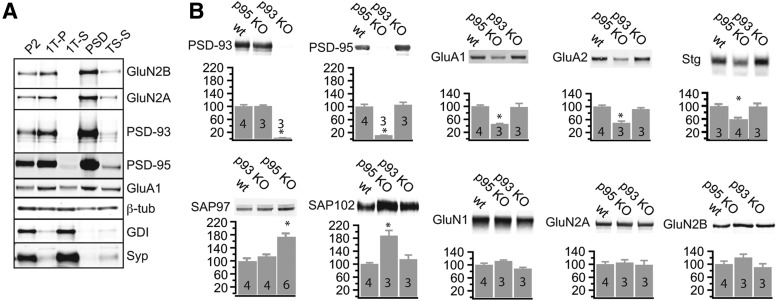
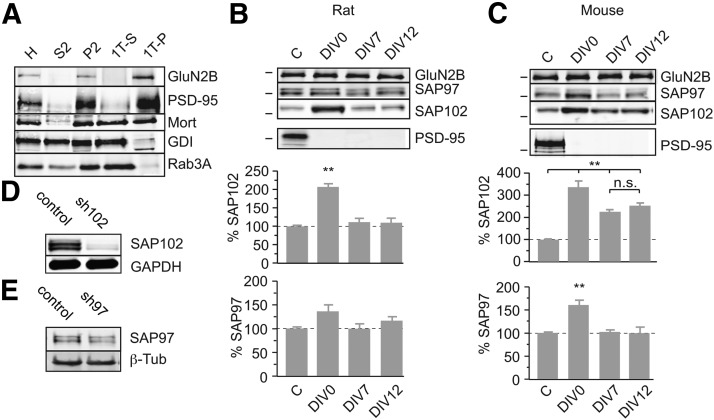
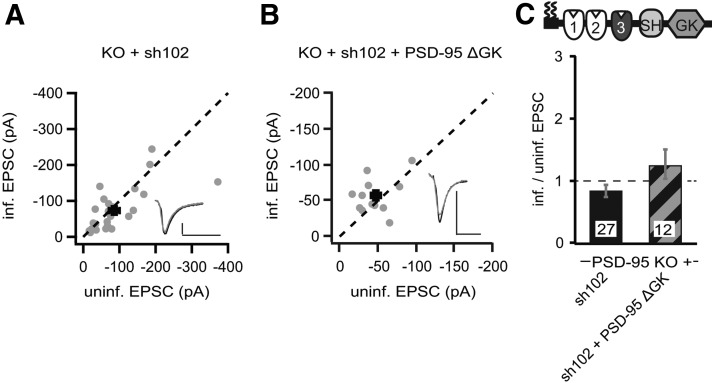
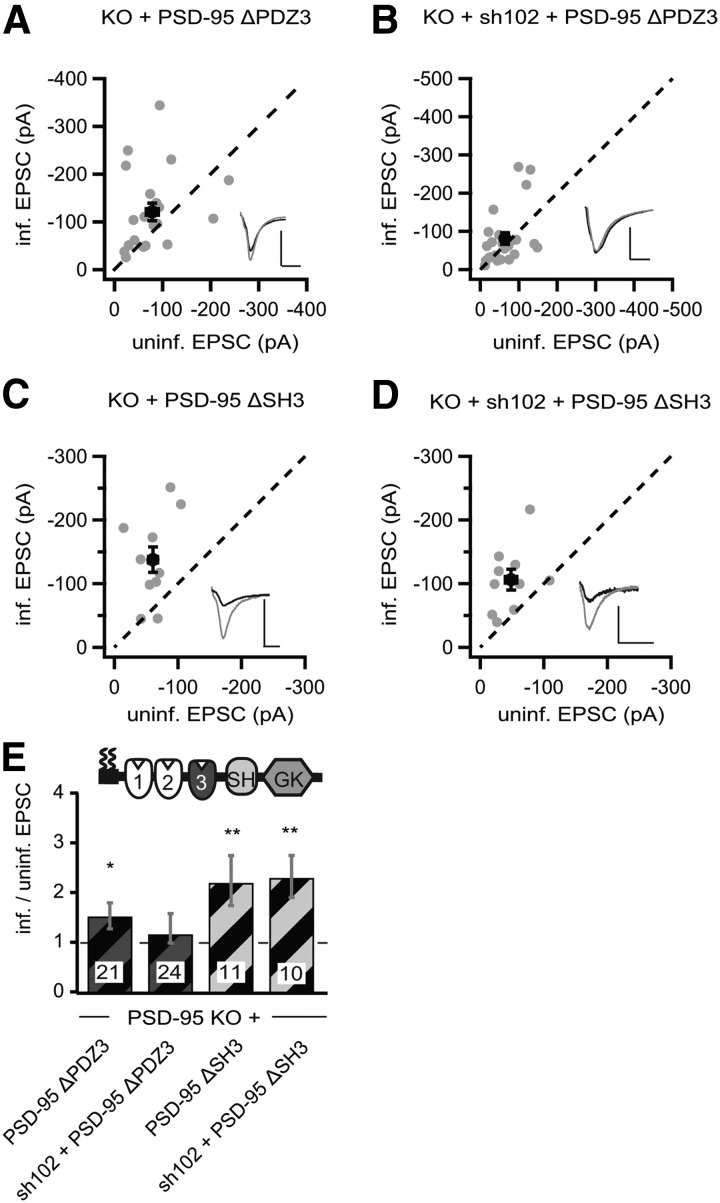
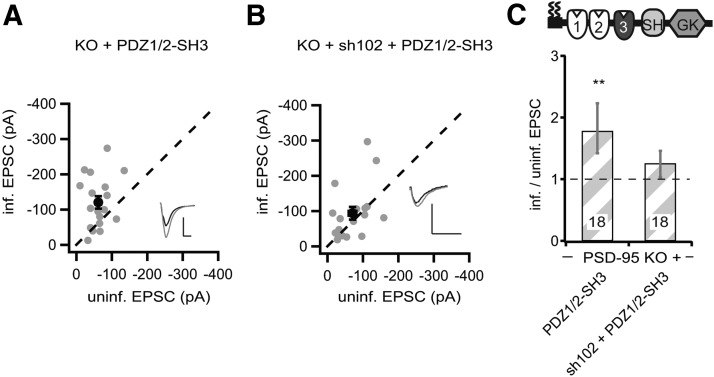
Activity-dependent regulation of AMPA receptor (AMPAR)-mediated synaptic transmission is the basis for establishing differences in synaptic weights among individual synapses during developmental and experience-dependent synaptic plasticity. Synaptic signaling scaffolds of the Discs large (DLG)-membrane-associated guanylate kinase (MAGUK) protein family regulate these processes by tethering signaling proteins to receptor complexes. Using a molecular replacement strategy with RNAi-mediated knockdown in rat and mouse hippocampal organotypic slice cultures, a postsynaptic density-95 (PSD-95) knock-out mouse line and electrophysiological analysis, our current study identified a functional interplay between two paralogs, PSD-95 and synapse-associated protein 102 (SAP102) to regulate synaptic AMPARs. During synaptic development, the SAP102 protein levels normally plateau but double if PSD-95 expression is prevented during synaptogenesis. For an autonomous function of PSD-95 in regulating synaptic AMPARs, in addition to the previously demonstrated N-terminal multimerization and the first two PDZ (PSD-95, Dlg1, zona occludens-1) domains, the PDZ3 and guanylate kinase domains were required. The Src homology 3 domain was dispensable for the PSD-95-autonomous regulation of basal synaptic transmission. However, it mediated the functional interaction with SAP102 of PSD-95 mutants to enhance AMPARs. These results depict a protein domain-based multifunctional aspect of PSD-95 in regulating excitatory synaptic transmission and unveil a novel form of domain-based interplay between signaling scaffolds of the DLG-MAGUK family.


Figures

Figure 1.
Figure 1.
The protein levels of PSD-95 were correlated with the strength of AMPAR EPSCs. A–C, Amplitude peaks of AMPAR EPSCs of neurons expressing sh95 (A), sh95 + rPSD-95 (B), or sh95 + PDZ1/2 (C) were plotted against those of simultaneously recorded uninfected neighboring neurons in rat hippocampal slice cultures. [In this and all subsequent panels, gray symbols represent single pairs of recordings, and black symbols show mean ± SEM. p values were calculated with a paired Student's t test comparing absolute values of paired recordings. Insets in each panel show representative EPSC trace of averaged 30 sweeps for control (black) and infected neuron (gray). Calibration: 50 pA, 25 ms.] D, Summary of AMPAR EPSC ratio of infected and uninfected pairs. Schematic representation of PSD-95 with color-coded domains, matching the bar colors. Number of pairs (n) indicated in the foot of the graph. Statistical significance is indicated with asterisks from the analysis in A–C to indicate difference from control.
Figure 2.
Figure 2.
The SH3 domain was not required for PSD-95 to enhance AMPAR EPSCs. A–C, Amplitude peaks of AMPAR EPSCs of neurons expressing sh95 + p95ΔSH3 (A), sh95 + p95ΔPDZ3 (B), or sh95 + p95ΔGK (C) were plotted against those of simultaneously recorded uninfected neighboring neurons in rat hippocampal slice cultures. D, Summary of AMPAR EPSC ratio of infected and uninfected pairs. Schematic representation of PSD-95 with color-coded domains, matching the bar colors. Number of pairs (n) indicated in the foot of the graph. Statistical significance is indicated with asterisks from the analysis in A–C to indicate difference from control. Calibration: 50 pA, 25 ms.
Figure 3.
Figure 3.
Expression of PSD-95ΔGK enhanced AMPAR EPSCs in the presence of endogenous PSD-95. A, B, Amplitude peaks of AMPAR EPSCs of neurons expressing p95ΔGK (A) or rPSD-95 (B) were plotted against those of simultaneously recorded uninfected neighboring neurons in rat hippocampal slice cultures. C, Summary of AMPAR EPSC ratio of infected and uninfected pairs. Schematic representation of PSD-95 with color-coded domains, matching the bar colors. Number of pairs (n) indicated in the foot of the graph. Statistical significance is indicated with asterisks from the analysis in A and B to indicate difference from control. Calibration: 50 pA, 25 ms.
Figure 4.
Figure 4.
Expression of p95ΔGK enhanced AMPAR EPSCs in PSD-95 KO mice. A–C, Amplitude peaks of AMPAR EPSCs neurons expressing p95ΔGK (A), PDZ1/2 (B), or rPSD-95 (C) were plotted against those of simultaneously recorded uninfected neighboring neurons in PSD-95 KO hippocampal slice cultures. D, Summary of AMPAR EPSC ratio of infected and uninfected pairs. Schematic representation of PSD-95 with color-coded domains, matching the bar colors and with diagonal stripes to indicate results from PSD-95 KO mice. Number of pairs (n) indicated in the foot of the graph. Statistical significance is indicated with stars from the analysis in A–C to indicate difference from control. Calibration: 50 pA, 25 ms.
Figure 5.
Figure 5.
Expression of p95ΔGK enhanced AMPAR EPSCs when replacing endogenous PSD-95 in mouse slice cultures. A, B, Amplitude peaks of AMPAR EPSCs neurons expressing sh95 (A) or sh95 + p95ΔGK (B) were plotted against those of simultaneously recorded uninfected neighboring neurons in mouse hippocampal slice cultures. C, Summary of AMPAR EPSC ratio of infected and uninfected pairs. Schematic representation of PSD-95 with color-coded domains, matching the bar colors. Number of pairs (n) indicated in the foot of the graph. Statistical significance is indicated with asterisks from the analysis in A and B to indicate difference from control. Calibration: 50 pA, 25 ms.
Figure 6.
Figure 6.
Compensatory increases of DLG–MAGUK levels in the PSD of PSD-95 KO mice. Subcellular fractionations with differential centrifugation and detergent extractions were performed of single cortices of control, PSD-93 KO, and PSD-95 KO mice. Thirty micrograms of total protein were processed by SDS-PAGE and immunoblotted with antibodies directed against the indicated proteins (β-tub, β-tubulin; Syp, Synaptophysin). A, Characterization of different fractions [P2, crude synaptosomes; 1T-P, Triton X-100 extraction pellet; 1T-S, Triton X-100 extraction supernatant; PSD, postsynaptic density (N-lauroyl-sarcosyl extraction pellet); TS-S, N-lauroyl-sarcosyl supernatant]. B, Sample immunoblot of the indicated proteins is illustrated on the top, and quantified protein amounts (mean ± SEM) normalized against the mean of control animals on each blot is plotted against the genotype. Number of animals (n) indicated as number in the foot of the bar. Statistical significance is indicated with asterisks, tested with ANOVA and post hoc analysis of test sample versus control.
Figure 7.
Figure 7.
Compensatory increases of DLG–MAGUKs levels in the Triton X-100-insoluble fraction of dissociated neuronal cultures. Subcellular fractionations with differential centrifugation and detergent extractions were performed on dissociated mouse or rat cortical cultures after DIV21, transduced at different time points with sh95 (C, GFP expression control; D0, transduction at DIV0; D7, transduction at DIV7; D12, transduction at DIV12). Ten micrograms of total protein were processed by SDS-PAGE and immunoblotted with antibodies directed against the indicated proteins (Mort, mortalin). A, Characterization of different fractions (H, homogenate; S2, cytosolic and microsomal fraction; P2, crude synaptosomes; 1T-P, Triton X-100 extraction pellet; 1T-S, Triton X-100 extraction supernatant). B, C, Sample immunoblots of the 1T-P fraction (top three) and P2 fraction (PSD-95) of indicated proteins is illustrated on the top and quantified protein amounts (mean ± SEM) normalized against the mean of control condition on each blot is plotted against the experimental condition [n = 6 rat (B) or mouse (C) cultures]. Statistical significance is indicated with asterisks, tested with ANOVA and post hoc analysis of experimental condition versus control or when indicated with bar among all indicated conditions. D, E, Sample immunoblots of mouse hippocampal cultures transduced with sh102 (D), sh97 (E), or control lentiviral vector, probed with indicated antibodies.
Figure 8.
Figure 8.
p95ΔGK-mediated enhancement of AMPAR EPSCs in PSD-95 KO mice was dependent on increased SAP102 levels. A, B, Amplitude peaks of AMPAR EPSCs of neurons expressing sh102 (A) or sh102 + p95ΔGK (B) are plotted against those of simultaneously recorded uninfected neighboring neurons in PSD-95 KO hippocampal slice cultures. C, Summary of AMPAR EPSC ratio of infected and uninfected pairs. Schematic representation of PSD-95 with color-coded domains, matching the bar colors. Number of pairs (n) indicated in the foot of the graph. Calibration: 50 pA, 25 ms.
Figure 9.
Figure 9.
p95ΔPDZ3-mediated enhancement of AMPAR EPSCs in PSD-95 KO mice was dependent on increased SAP102 levels. A–D, Amplitude peaks of AMPAR EPSCs neurons expressing p95ΔPDZ3 (A), sh102 + p95ΔPDZ3 (B), p95ΔSH3 (C), or sh102 + p95ΔSH3 (D) were plotted against those of simultaneously recorded uninfected neighboring neurons in PSD-95 KO hippocampal slice cultures. E, Summary of AMPAR EPSC ratio of infected and uninfected pairs. Schematic representation of PSD-95 with color-coded domains, matching the bar colors. Number of pairs (n) indicated in the foot of the graph. Statistical significance is indicated with asterisks from the analysis in A–D to indicate difference from control. Calibration: 50 pA, 25 ms.
Figure 10.
Figure 10.
A minimal PSD-95 was dependent on the functional interaction with SAP102. A, B, Amplitude of AMPAR EPSCs of neurons expressing PDZ1/2–SH3 (A) or sh102 + PDZ1/2–SH3 (B) were plotted against those of simultaneously recorded uninfected neighboring neurons in PSD-95 KO hippocampal slice cultures. C, Summary of AMPAR EPSC ratio of infected and uninfected pairs. Schematic representation of PSD-95 with color-coded domains, matching the bar colors. Number of pairs (n) indicated in the foot of the graph. Statistical significance is indicated with asterisks from the analysis in A and B to indicate difference from control. Calibration: 50 pA, 25 ms.

References

    1. Abegg MH, Savic N, Ehrengruber MU, McKinney RA, Gähwiler BH. Epileptiform activity in rat hippocampus strengthens excitatory synapses. J Physiol. 2004;554:439–448. doi: 10.1113/jphysiol.2003.052662. - DOI - PMC - PubMed
    1. Balch WE, Rothman JE. Characterization of protein transport between successive compartments of the Golgi apparatus: asymmetric properties of donor and acceptor activities in a cell-free system. Arch Biochem Biophys. 1985;240:413–425. doi: 10.1016/0003-9861(85)90046-3. - DOI - PubMed
    1. Béïque JC, Andrade R. PSD-95 regulates synaptic transmission and plasticity in rat cerebral cortex. J Physiol. 2003;546:859–867. doi: 10.1113/jphysiol.2002.031369. - DOI - PMC - PubMed
    1. Béïque JC, Lin DT, Kang MG, Aizawa H, Takamiya K, Huganir RL. Synapse-specific regulation of AMPA receptor function by PSD-95. Proc Natl Acad Sci U S A. 2006;103:19535–19540. doi: 10.1073/pnas.0608492103. - DOI - PMC - PubMed
    1. Carlisle HJ, Fink AE, Grant SG, O'Dell TJ. Opposing effects of PSD-93 and PSD-95 on long-term potentiation and spike timing-dependent plasticity. J Physiol. 2008;586:5885–5900. doi: 10.1113/jphysiol.2008.163469. - DOI - PMC - PubMed

Publication types

LinkOut - more resources