. 2013 Nov;87(21):11371-87.
doi: 10.1128/JVI.03433-12. Epub 2013 Aug 14.

Norovirus genome circularization and efficient replication are facilitated by binding of PCBP2 and hnRNP A1

Affiliations

Norovirus genome circularization and efficient replication are facilitated by binding of PCBP2 and hnRNP A1

Eduardo López-Manríquez et al. J Virol. 2013 Nov.

Abstract

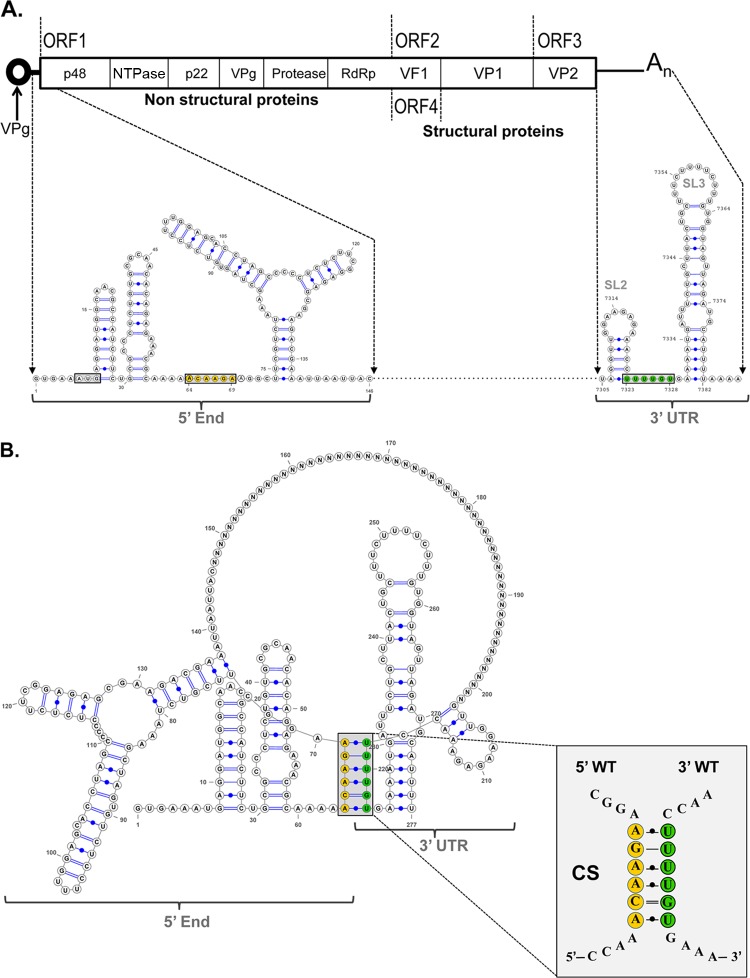
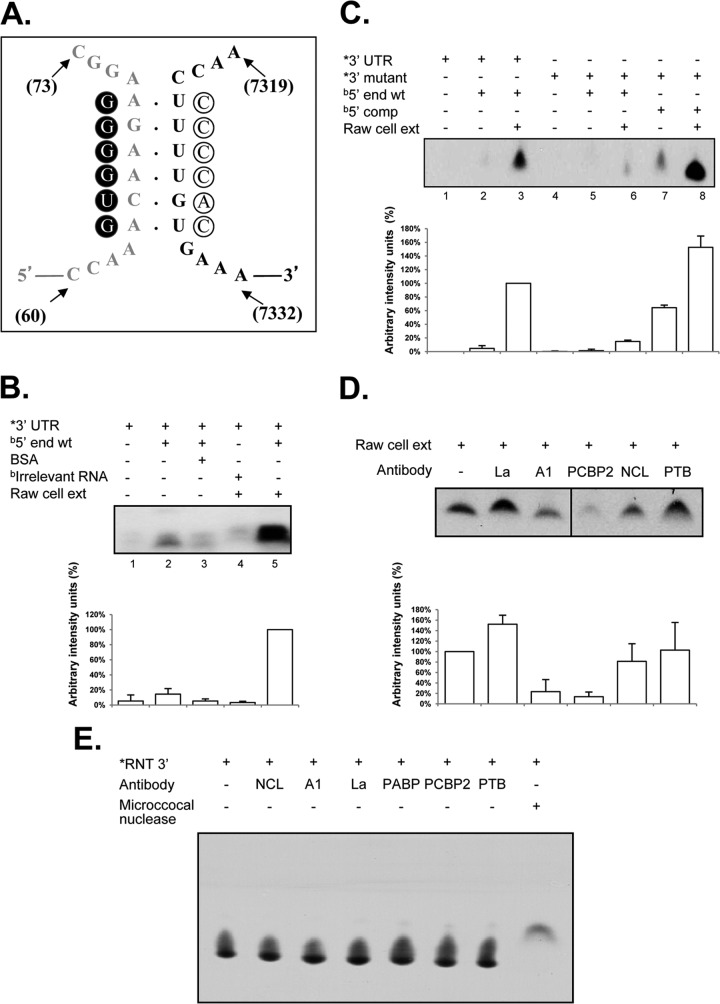
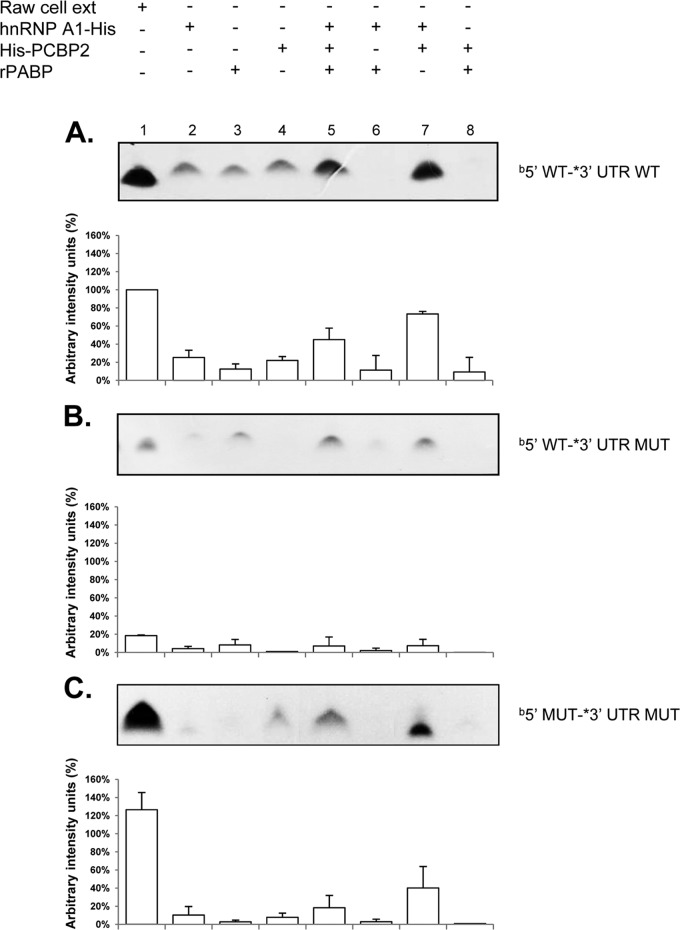
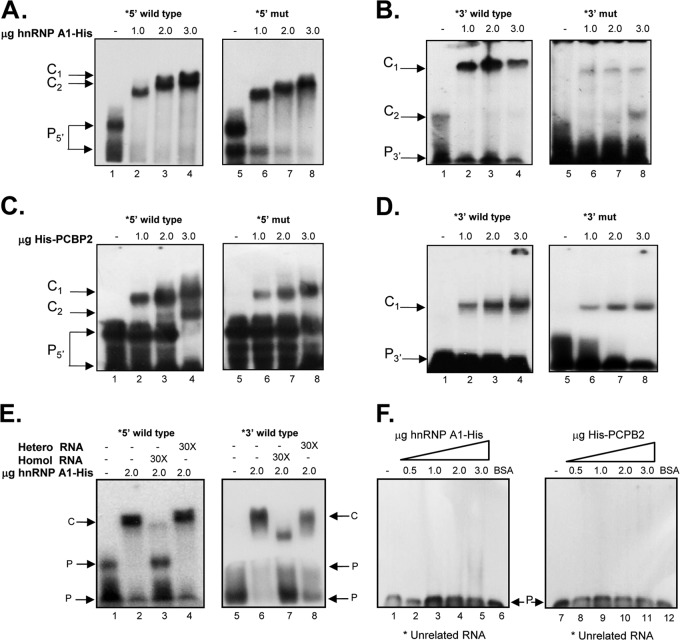
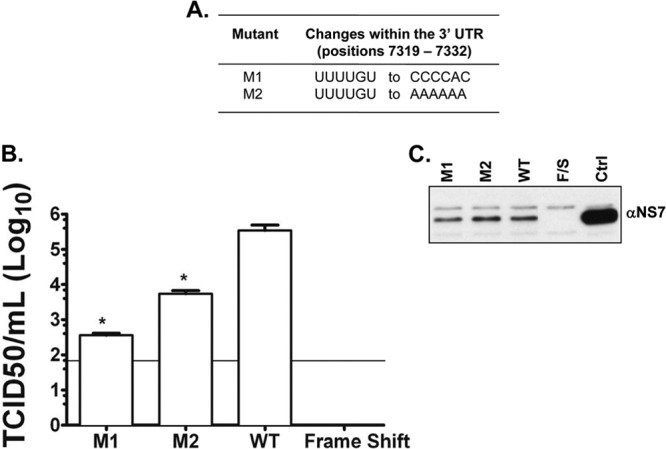
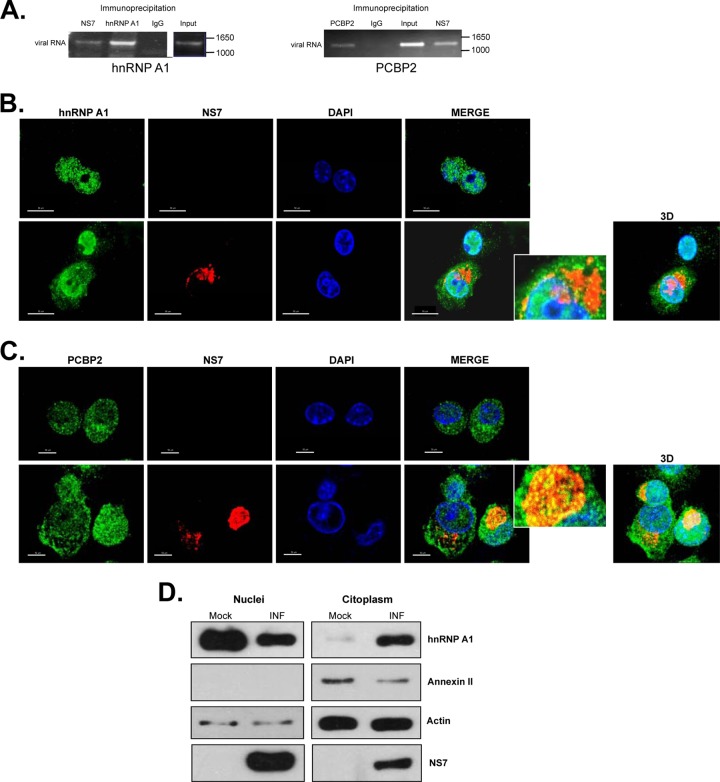
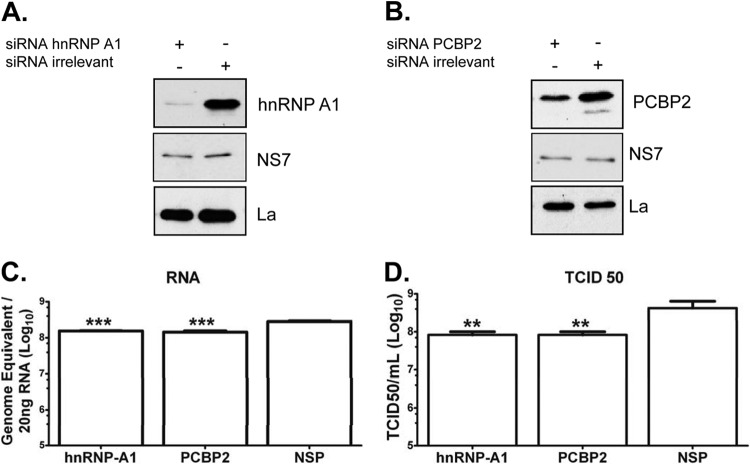
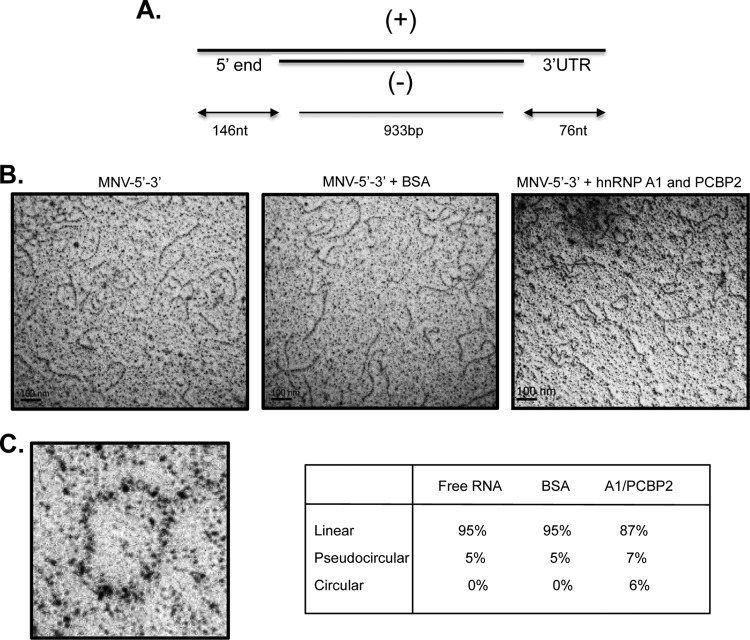
Sequences and structures within the terminal genomic regions of plus-strand RNA viruses are targets for the binding of host proteins that modulate functions such as translation, RNA replication, and encapsidation. Using murine norovirus 1 (MNV-1), we describe the presence of long-range RNA-RNA interactions that were stabilized by cellular proteins. The proteins potentially responsible for the stabilization were selected based on their ability to bind the MNV-1 genome and/or having been reported to be involved in the stabilization of RNA-RNA interactions. Cell extracts were preincubated with antibodies against the selected proteins and used for coprecipitation reactions. Extracts treated with antibodies to poly(C) binding protein 2 (PCBP2) and heterogeneous nuclear ribonucleoprotein (hnRNP) A1 significantly reduced the 5'-3' interaction. Both PCBP2 and hnRNP A1 recombinant proteins stabilized the 5'-3' interactions and formed ribonucleoprotein complexes with the 5' and 3' ends of the MNV-1 genomic RNA. Mutations within the 3' complementary sequences (CS) that disrupt the 5'-3'-end interactions resulted in a significant reduction of the viral titer, suggesting that the integrity of the 3'-end sequence and/or the lack of complementarity with the 5' end is important for efficient virus replication. Small interfering RNA-mediated knockdown of PCBP2 or hnRNP A1 resulted in a reduction in virus yield, confirming a role for the observed interactions in efficient viral replication. PCBP2 and hnRNP A1 induced the circularization of MNV-1 RNA, as revealed by electron microscopy. This study provides evidence that PCBP2 and hnRNP A1 bind to the 5' and 3' ends of the MNV-1 viral RNA and contribute to RNA circularization, playing a role in the virus life cycle.


Figures

Fig 1
Fig 1
Computer analysis of the 5′-3′-end contacts of the MNV-1 genomic RNA wt region. (A) Genome schematic of the secondary structures formed within the first 146 nt and the last 75 nt (3′ UTR) of the MNV-1 genomic RNA. The positions of the CS and the AUG initiation codon are highlighted. (B) Predicted secondary structure formed between the first 146 nt and the last 75 nt (3′ UTR) of the MNV-1 genomic RNA. An expanded drawing shows CS formed in the predicted structure. The secondary structures were predicted using Mfold2 software (http://mfold.rna.albany.edu) with a ΔG value of −70.6 kcal/mol. The Ns represent the genome sequence between the 5′ and 3′ ends. (C) Predicted secondary structures formed between the first 146 nt and the last 75 nt (3′ UTR) of 9 different representative isolates and/or strains of MNV-1, corresponding to groups 1 to 9 shown in Table 1 and in Materials and Methods. The numbers in parentheses are the number of isolates in each group.
Fig 1
Fig 1
Computer analysis of the 5′-3′-end contacts of the MNV-1 genomic RNA wt region. (A) Genome schematic of the secondary structures formed within the first 146 nt and the last 75 nt (3′ UTR) of the MNV-1 genomic RNA. The positions of the CS and the AUG initiation codon are highlighted. (B) Predicted secondary structure formed between the first 146 nt and the last 75 nt (3′ UTR) of the MNV-1 genomic RNA. An expanded drawing shows CS formed in the predicted structure. The secondary structures were predicted using Mfold2 software (http://mfold.rna.albany.edu) with a ΔG value of −70.6 kcal/mol. The Ns represent the genome sequence between the 5′ and 3′ ends. (C) Predicted secondary structures formed between the first 146 nt and the last 75 nt (3′ UTR) of 9 different representative isolates and/or strains of MNV-1, corresponding to groups 1 to 9 shown in Table 1 and in Materials and Methods. The numbers in parentheses are the number of isolates in each group.
Fig 2
Fig 2
The interaction between the 5′ and 3′ ends of the MNV-1 genomic RNA requires cellular proteins and CS complementarity, and antibodies to hnRNP A1 and PCBP2 affect these interactions. (A) Schematic representation of the 5′-3′ CS. Mutations introduced in the 5′ end (solid circles) and the compensatory mutations in the 3′ end (open circles) are highlighted. (B) Coprecipitation assay of the α-32P-labeled wt 3′ UTR (lanes 1 to 5) and the biotin-labeled wt 5′ end (lanes 2, 3, and 5) of the MNV-1 genomic RNA or an irrelevant related biotin-labeled RNA (lane 4) in the absence (lanes 1 and 2) or presence (lane 3) of 10 μg BSA and 10 μg Raw264.7 S10 (lanes 4 and 5). ext, extract; *, α-32P-labeled; b, biotin-labeled. The error bars indicate standard deviations from three independent experiments. (C) Coprecipitation assay of the α-32P-labeled wt 3′-UTR (lanes 1 to 3) or the α-32P-labeled mutant (mut) 3′-UTR (lanes 4 to 8) RNAs and the biotin-labeled wt 5′-end (lanes 2, 3, 5, and 6) or the mut 5′-end (5′ comp) RNAs (lanes 7 and 8) in the absence (lanes 1, 2, 4, 5, and 7) or presence (lanes 3, 6, and 8) of 10 μg Raw264.7 S10 extracts. (D) Complex formation in the presence of specific antibodies. Coprecipitation assay of the α-32P-labeled wt 3′ UTR and the biotin-labeled wt 5′ end of the MNV-1 genomic RNA with Raw264.7 cell extracts (all lanes), alone (lane 1 from left) or incubated in the presence of anti-La (lane 2), anti-hnRNP A1 (lane 3), anti-PCBP2 (lane 4), anti-NCL (lane 5), and anti-PTB (lane 6) antibodies prior to addition to the coprecipitation reaction mixtures. Precipitated α-32P-labeled RNA levels were quantified using ImageJ software and expressed as arbitrary intensity units. The error bars represent the standard deviations from three independent experiments. (E) RNA integrity in the presence of antibodies. The α-32P-labeled 3′-UTR RNA was interacted alone (far left lane) or in the presence of 0.2 μg of anti-La (La), anti-hnRNP A1 (A1), anti-PCBP2 (PCBP2), anti-NCL (NCL), anti-PTB (PTB), and anti-PABP (PABP) antibodies or 0.2 μg of micrococcal nuclease (far right lane).
Fig 3
Fig 3
hnRNP A1 and PCBP2 contribute to CS binding, and mutations that disrupt the CS affect the formation of the coprecipitated complex. Coprecipitation assay between α-32P-labeled wt 3′ UTR and the biotin-labeled wt 5′ end (A), α-32P-labeled mut 3′ UTR and the biotin-labeled wt 5′ end (B), and α-32P-labeled mut 3′ UTR and the biotin-labeled comp 5′ end (C) were carried out in the presence of cell extracts (lanes 2), His-hnRNP A1 (lanes 2), PABP (lanes 3), PCBP2-His (lanes 4), all recombinant proteins (lanes 5), His-hnRNP A1 and PABP (lanes 6), His-hnRNP A1 and PCBP2-His (lanes 7), and PABP and PCBP2-His (lanes 8). Precipitated α-32P-labeled RNA levels were quantified using ImageJ software and are expressed as percent arbitrary intensity units. The error bars represent the standard deviations from three independent experiments.
Fig 4
Fig 4
Mutations in the CS affect hnRNP A1 and/or PCBP2 binding to the 5′ and 3′ ends of the MNV-1 genomic RNA and virus replication. (A to D) EMSA showing the recombinant hnRNP A1-His (A and B) and His-PCBP2 (C and D) interaction with the [α-32P]UTP-labeled wt 5′ end (A and C, lanes 1 to 4) and [α-32P]UTP-labeled mut 5′ end (A and C, lanes 5 to 8) and with the [α-32P] UTP-labeled wt 3′ UTR (B and D, lanes 1 to 4) and [α-32P]UTP-labeled mut 3′ UTR (B and D, lanes 5 to 8). (E and F) EMSA showing the specific interaction of the recombinant hnRNP A1-His with the MNV-1 [α-32P]UTP-labeled 5′ end (E, lanes 2 to 4) and [α-32P]UTP-labeled 3′ UTR (E, lanes 6 to 8), alone (lanes 2) or in the presence of 30× homologous (lanes 3 and 7) or heterologous (lanes 4 and 8) unlabeled RNAs. The EMSAs were performed using 2 μg of protein. Lanes 1 and 5, free probes. Unrelated [α-32P]UTP-labeled RNA (see Materials and Methods) was interacted alone (F, lanes 1 and 7) or with increasing amounts of hnRNP A1-His (F, lanes 2 to 5) or His-PCBP2 (F, lanes 8 to 11) or 3 μg BSA (lanes 6). The positions of the free probe (P) and various RNA-protein complexes (C) are highlighted.
Fig 5
Fig 5
Nucleotide changes within the 3′ UTR of recovered viruses obtained from BSRT7 cells transfected with the in vitro-transcribed capped RNA pT7MNV-1:3′RZ infectious clone containing a 6-nt mutation. (A) The 6-nt changes within M1 and M2. (B) Virus recovered at 24 h posttransfection and total virus levels assayed by TCID50 in Raw264.7 cells. The limit of detection was 50 TCID50/ml. Transfections were performed in triplicate, and the average log titers are plotted, together with standard errors. Significance was also tested using one-way ANOVA compared to the wild type. *, P < 0.05. (C) Western blot analysis was carried out on lysates of transfected BSRT7 cells to assess the translation of NS7. Ctrl, total mock-transfected cell lysates. Frameshift (F/S) was also used as a recovery negative control. The data shown are representative of at least 3 independent experiments.
Fig 6
Fig 6
hnRNP A1 and PCBP2 subcellular localization and interaction with the viral RNA during MNV-1 replication. (A) Antisera to MNV-1 NS7, hnRNP A1, and PCBP2 precipitated viral RNA from MNV-1-infected cells. Viral RNA was coimmunoprecipitated from MNV-1-infected Raw264.7 cell extracts using an antibody directed against viral polymerase (NS7) or anti-hnRNP A1 or anti-PCBP2 antibodies, respectively. Purified IgG (IgG) was used as a negative control. RNA was extracted from the immunoprecipitated complex or from an aliquot of the input lysate and subjected to RT-PCR using MNV-1-specific primers as detailed in Materials and Methods. The RT-PCR products were visualized on a 1% agarose gel. (B and C) Subcellular localization of hnRNP A1 (B) and PCBP2 (C) in mock-infected and MNV-1-infected Raw264.7 cells. Mock-infected Raw264.7 cells (top rows) or Raw264.7 cells infected with MNV-1 for 16 h at an MOI of 5 (bottom rows) were immunostained with an anti-hnRNP A1 (B) or an anti-PCBP2 (C) monoclonal antibody, followed by anti-mouse Alexa Fluor 488 (green) and DAPI (blue) staining. To identify the infected cells, the MNV-1 NS7 protein was immunostained with an anti-NS7 antibody, followed by anti-rabbit Alexa Fluor 594 (red) staining. The cells were observed using the Zeiss LSM 700 confocal microscope. The images depict single confocal slices taken from z-stacks. The colocalization coefficients of NS7 with hnRNP A1 and PCBP2 determined by ZEN 2010 software were 0.11/1 and 0.46/1, respectively. Enlarged views of the boxed areas are shown on the right. 3D, maximally projected z-stack. (D) Western blot of the hnRNP A1 protein in nuclear and cytoplasmic extracts from mock-infected (Mock) and MNV-1-infected (INF) Raw264.7 cells. The annexin II expression levels were used to show that cytosol and nuclear extracts were well separated. The actin expression levels were used as protein-loading controls. The data shown are representative of at least 3 independent experiments.
Fig 7
Fig 7
hnRNP A1 and PCBP2 siRNA affect virus replication. (A and B) BV-2 cells were transfected with an irrelevant siRNA or an siRNA specific for either hnRNP A1 (A1) (A) or PCBP2 (B) for 12 h. (C and D) The treated cells were then infected with MNV-1 at an MOI of 5 for 18 h, and RNA (C) and virus titer (D) determinations were performed by qRT-PCR or TCID50 assays, respectively. Detection of La protein was used as the loading control. Detection of NS7 indicates infection. The error bars represent the standard deviations from three independent experiments. ***, P < 0.001 for qRT-PCR, and **, P < 0.01 for TCID50 experiments by two-way ANOVA.
Fig 8
Fig 8
MNV-1 RNA circularizes in the presence of hnRNP A1 and PCBP2. (A) Scheme of the structure of the RNA molecule used (see Materials and Methods). (+), positive sense RNA molecule; (−), antisense RNA molecule. (B) RNA electron micrographs. RNA molecules with 5′ ends and 3′ UTRs were incubated with BSA or hnRNP A1 and PCBP2 and observed under EM. (C) Amplification of a circular molecule. One hundred molecules were counted for each set, and the percentages of circular, pseudocircular, and linear RNA molecules are indicated.

Similar articles

Cited by

References

    1. Lopman B, Zambon M, Brown DW. 2008. The evolution of norovirus, the “Gastric Flu.” PLoS Med. 5:e42.10.1371/journal.pmed.0050042 - DOI - PMC - PubMed
    1. Patel MM, Widdowson M-A, Glass RI, Akazawa K, Vinje J, Parashar UD. 2008. Systematic literature review of role of noroviruses in sporadic gastroenteritis. Emerg. Infect. Dis. 14:1224–1231 - PMC - PubMed
    1. Teunis PFM, Moe CL, Liu P, Miller SE, Lindesmith L, Baric RS, Le Pendu J, Calderon RL. 2008. Norwalk virus: how infectious is it? J. Med. Virol. 80:1468–1476 - PubMed
    1. Clarke IN, Lambden PR. 1997. The molecular biology of caliciviruses. J. Gen. Virol. 78:291–301 - PubMed
    1. McFadden N, Bailey D, Carrara G, Benson A, Chaudhry Y, Shortland A, Heeney J, Yarovinsky F, Simmonds P, Macdonald A, Goodfellow I. 2011. Norovirus regulation of the innate immune response and apoptosis occurs via the product of the alternative open reading frame 4. PLoS Pathog. 7:e1002413.10.1371/journal.ppat.1002413 - DOI - PMC - PubMed

Publication types

MeSH terms

Substances

LinkOut - more resources