

Efficiency of E2-p7 processing modulates production of infectious hepatitis C virus
- PMID: 23946462
- PMCID: PMC3807289
- DOI: 10.1128/JVI.01807-13
Efficiency of E2-p7 processing modulates production of infectious hepatitis C virus
Abstract
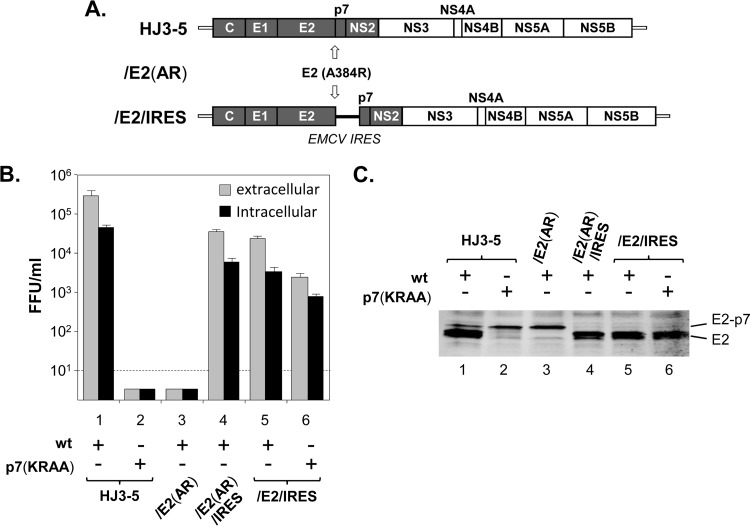
Previous studies indicate that the processing of hepatitis C virus (HCV) E2-p7-NS2 precursor mediated by host signal peptidase is relatively inefficient, resulting in the accumulation of E2-p7-NS2 and E2-p7 precursors in addition to E2 in mammalian cells. In this study, we discovered that a significant inhibition of the processing at an E2-p7 junction site is detrimental for HCV production, whether it was caused by the mutations in p7 or by the strategic introduction of a mutation at a terminal residue of E2 to block the signal peptidase-mediated cleavage of this junction site. However, complete separation of E2 and p7 by inserting an encephalomyocarditis virus (EMCV) internal ribosome entry site (IRES) between these two proteins also moderately inhibited virus production. These results indicate that optimal processing of the E2-p7 junction site is critical for efficient HCV production. We further demonstrated that disrupting E2-p7 processing inhibits both NS2 localization to the putative virus assembly sites near lipid droplets (LD) and NS2 interaction with NS3 and E2. However, the impact, if any, of the p7-NS2 processing efficiency on HCV production seems relatively minor. In conclusion, these results imply that effective release of E2 and p7 from the precursor E2-p7 promotes HCV production by enhancing NS2-associated virus assembly complex formation near LD.
Figures


Similar articles
-
Detergent-resistant membrane association of NS2 and E2 during hepatitis C virus replication.J Virol. 2015 Apr;89(8):4562-74. doi: 10.1128/JVI.00123-15. Epub 2015 Feb 11. J Virol. 2015. PMID: 25673706 Free PMC article.
-
Palmitoylation of Hepatitis C Virus NS2 Regulates Its Subcellular Localization and NS2-NS3 Autocleavage.J Virol. 2019 Dec 12;94(1):e00906-19. doi: 10.1128/JVI.00906-19. Print 2019 Dec 12. J Virol. 2019. PMID: 31597774 Free PMC article.
-
Hepatitis C virus NS2 protein serves as a scaffold for virus assembly by interacting with both structural and nonstructural proteins.J Virol. 2011 Jan;85(1):86-97. doi: 10.1128/JVI.01070-10. Epub 2010 Oct 20. J Virol. 2011. PMID: 20962101 Free PMC article.
-
Processing and functions of Hepatitis C virus proteins.Intervirology. 1999;42(2-3):145-52. doi: 10.1159/000024973. Intervirology. 1999. PMID: 10516468 Review.
-
Biochemical and immunologic properties of the nonstructural proteins of the hepatitis C virus: implications for development of antiviral agents and vaccines.Semin Liver Dis. 2000;20(1):69-83. doi: 10.1055/s-2000-9504. Semin Liver Dis. 2000. PMID: 10895433 Review.
Cited by
-
Transverse relaxation dispersion of the p7 membrane channel from hepatitis C virus reveals conformational breathing.J Biomol NMR. 2015 Apr;61(3-4):369-78. doi: 10.1007/s10858-015-9912-0. Epub 2015 Feb 28. J Biomol NMR. 2015. PMID: 25724842 Free PMC article.
-
Delayed by Design: Role of Suboptimal Signal Peptidase Processing of Viral Structural Protein Precursors in Flaviviridae Virus Assembly.Viruses. 2020 Sep 26;12(10):1090. doi: 10.3390/v12101090. Viruses. 2020. PMID: 32993149 Free PMC article. Review.
-
Viral Membrane Channels: Role and Function in the Virus Life Cycle.Viruses. 2015 Jun 23;7(6):3261-84. doi: 10.3390/v7062771. Viruses. 2015. PMID: 26110585 Free PMC article. Review.
-
The elusive function of the hepatitis C virus p7 protein.Virology. 2014 Aug;462-463:377-87. doi: 10.1016/j.virol.2014.04.018. Epub 2014 Jul 4. Virology. 2014. PMID: 25001174 Free PMC article. Review.
-
Landscape of protein-protein interactions during hepatitis C virus assembly and release.Microbiol Spectr. 2024 Feb 6;12(2):e0256222. doi: 10.1128/spectrum.02562-22. Epub 2024 Jan 17. Microbiol Spectr. 2024. PMID: 38230952 Free PMC article.
References
-
- Alter HJ. 2005. HCV natural history: the retrospective and prospective in perspective. J. Hepatol. 43:550–552. - PubMed
-
- Leone N, Rizzetto M. 2005. Natural history of hepatitis C virus infection: from chronic hepatitis to cirrhosis, to hepatocellular carcinoma. Minerva Gastroenterol. Dietol. 51:31–46. - PubMed
-
- Houghton M, Weiner A, Han J, Kuo G, Choo QL. 1991. Molecular biology of the hepatitis C viruses: implications for diagnosis, development and control of viral disease. Hepatology 14:381–388. - PubMed
-
- Robertson B, Myers G, Howard C, Brettin T, Bukh J, Gaschen B, Gojobori T, Maertens G, Mizokami M, Nainan O, Netesov S, Nishioka K, Shin i T, Simmonds P, Smith D, Stuyver L, Weiner A. 1998. Classification, nomenclature, and database development for hepatitis C virus (HCV) and related viruses: proposals for standardization. International Committee on Virus Taxonomy. Arch. Virol. 143:2493–2503. - PubMed
Publication types
MeSH terms
Substances
Grants and funding
LinkOut - more resources
Full Text Sources
Other Literature Sources
Research Materials
