. 2013 Oct 4;288(40):29069-80.
doi: 10.1074/jbc.M113.500066. Epub 2013 Aug 14.

FAD synthesis and degradation in the nucleus create a local flavin cofactor pool

Affiliations

FAD synthesis and degradation in the nucleus create a local flavin cofactor pool

Teresa Anna Giancaspero et al. J Biol Chem. .

Abstract

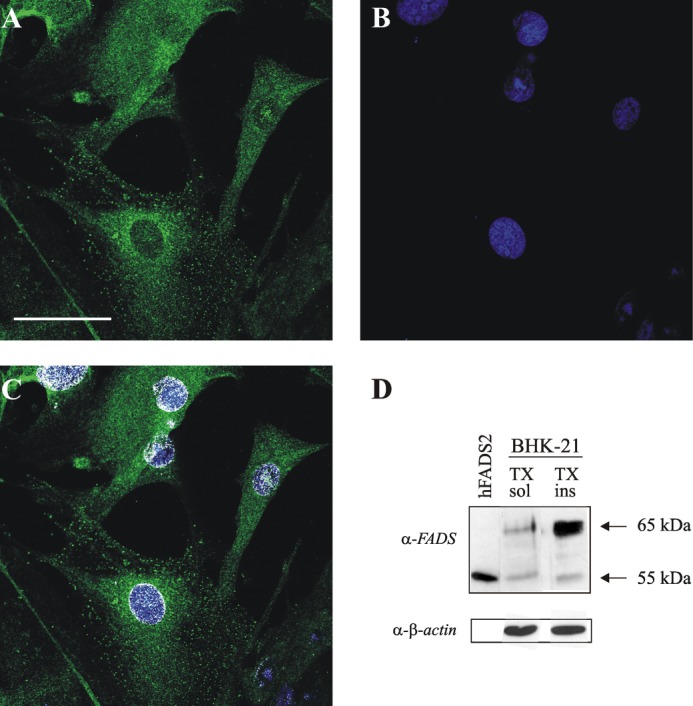
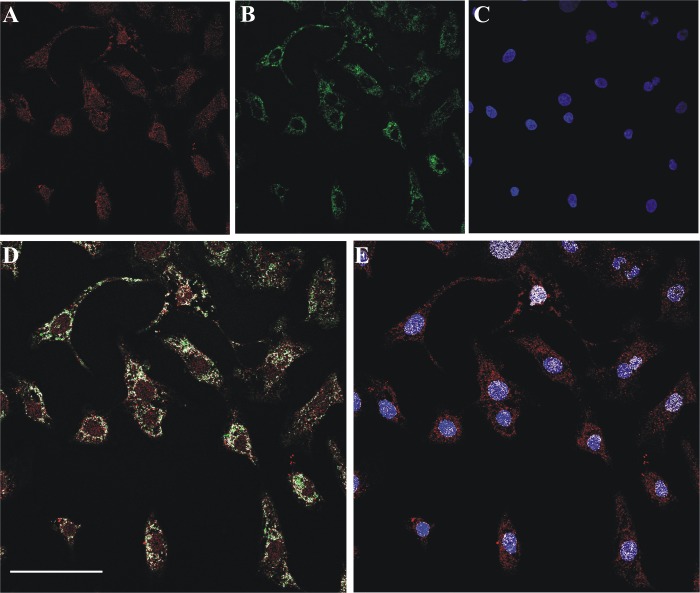
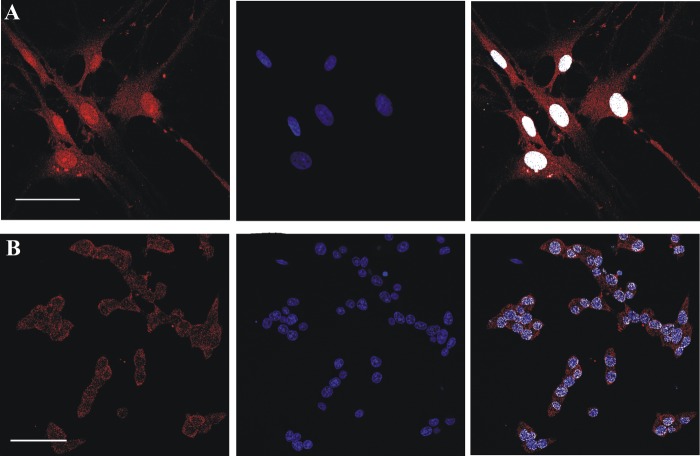
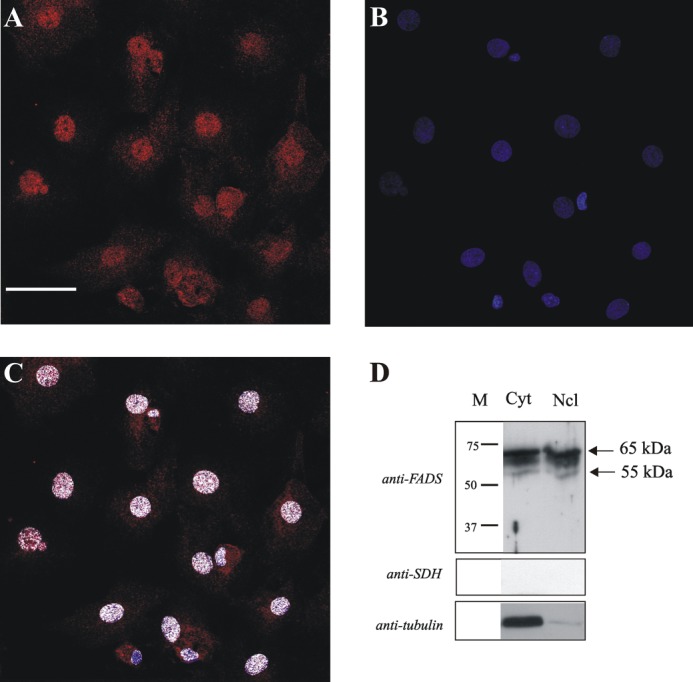
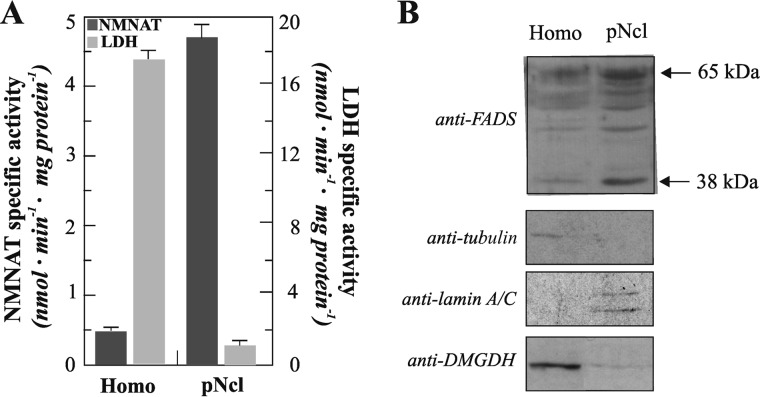
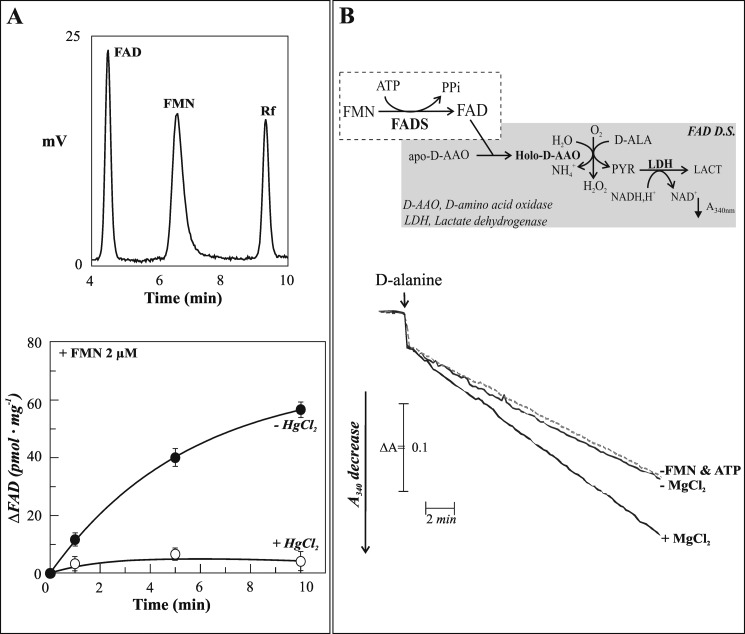
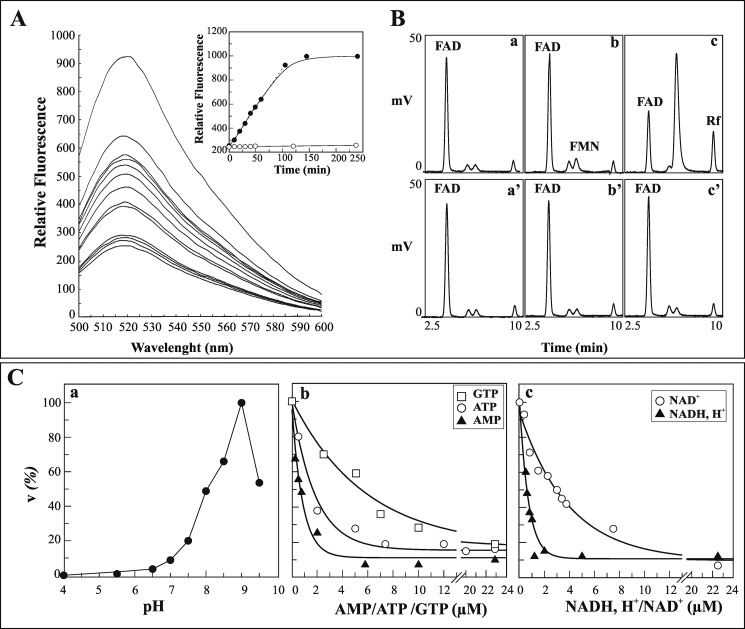
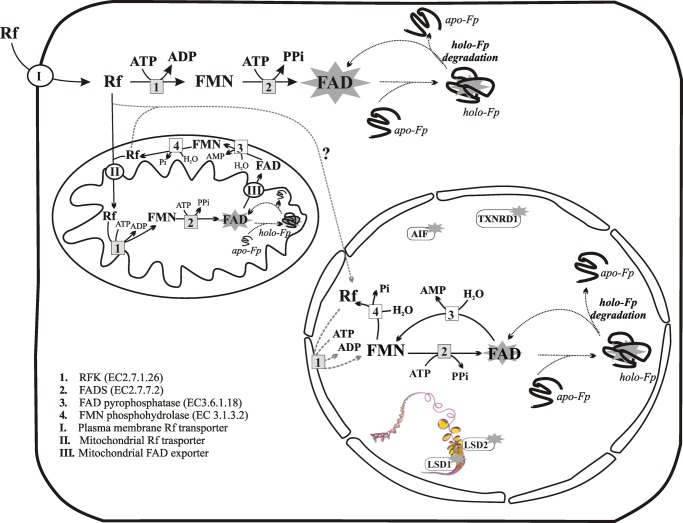
FAD is a redox cofactor ensuring the activity of many flavoenzymes mainly located in mitochondria but also relevant for nuclear redox activities. The last enzyme in the metabolic pathway producing FAD is FAD synthase (EC 2.7.7.2), a protein known to be localized both in cytosol and in mitochondria. FAD degradation to riboflavin occurs via still poorly characterized enzymes, possibly belonging to the NUDIX hydrolase family. By confocal microscopy and immunoblotting experiments, we demonstrate here the existence of FAD synthase in the nucleus of different experimental rat models. HPLC experiments demonstrated that isolated rat liver nuclei contain ∼300 pmol of FAD·mg(-1) protein, which was mainly protein-bound FAD. A mean FAD synthesis rate of 18.1 pmol·min(-1)·mg(-1) protein was estimated by both HPLC and continuous coupled enzymatic spectrophotometric assays. Rat liver nuclei were also shown to be endowed with a FAD pyrophosphatase that hydrolyzes FAD with an optimum at alkaline pH and is significantly inhibited by adenylate-containing nucleotides. The coordinate activity of these FAD forming and degrading enzymes provides a potential mechanism by which a dynamic pool of flavin cofactor is created in the nucleus. These data, which significantly add to the biochemical comprehension of flavin metabolism and its subcellular compartmentation, may also provide the basis for a more detailed comprehension of the role of flavin homeostasis in biologically and clinically relevant epigenetic events.

Keywords: Confocal Microscopy; FAD; FAD Hydrolysis; FAD Synthase; FMN; NUDIX Hydrolase; Nucleus; Rat; Riboflavin.


Figures

FIGURE 1.
FIGURE 1.
Fluorescence microscopy and immunoblotting evidence of FADS localization in BHK-21 cell nuclei. A, fixed and permeabilized BHK-21 cells were incubated with the polyclonal anti-FADS antiserum followed by incubation with an Alexa Fluor 488-conjugated anti-mouse antibody (green). B, nuclei were stained with Hoechst 33658 (blue, B). C, colocalization of FADS with the nuclear marker is depicted in white. Scale bar, 50 μm. D, immunoblotting of different anti-FADS-immunoreactive bands in BHK-21 cells. BHK-21 cells were lysed using 1% Triton X-100 as described under “Experimental Procedures.” Both the Triton X-100-soluble (TX sol) and Triton X-100-insoluble (TX ins) fractions were analyzed by immunoblotting with the anti-FADS antiserum. His6-hFADS2 (0.03 μg) was also loaded (hFADS2, first lane) as a control. The same PVDF membrane was tested with the anti-β-actin antibody. The arrows indicate the position of the main anti-FADS-immunoreactive bands.
FIGURE 2.
FIGURE 2.
Confocal evidence of mitochondrial and nuclear localization of FADS in primary cultures of neonatal rat ventricular cardiomyocytes. A, fixed and permeabilized neonatal rat cardiomyocytes were incubated with the polyclonal anti-FADS antiserum followed by incubation with an Alexa Fluor 568-conjugated anti-rabbit antibody (red). B, mitochondria were revealed with the monoclonal anti-Hsp60 antibody and an Alexa Fluor 488-conjugated anti-mouse antibody (green). C, nuclei were counterstained with Hoechst 33658 (blue). D and E, the colocalization of FADS with mitochondria (D) and nuclei (E) is depicted in white. Scale bar, 50 μm.
FIGURE 3.
FIGURE 3.
Confocal evidence of a nuclear FADS localization in rat primary culture and cell lines. Fixed and permeabilized rat neonatal astrocytes (row A) and insulin secreting INS-1E β-cells (row B) were incubated with the polyclonal anti-FADS antiserum followed by incubation with an Alexa Fluor 568-conjugated anti-rabbit antibody (red). Nuclei were stained with Hoechst 33658 (blue). In the last panel of each row, the colocalization between FADS and the nuclear marker is depicted in white. Scale bar, 50 μm.
FIGURE 4.
FIGURE 4.
Confocal microscopy and immunoblotting evidence of FADS localization in the nucleus of neonatal rat ventricular fibroblasts. A, fixed and permeabilized neonatal rat ventricular fibroblasts were incubated with the polyclonal anti-FADS antiserum followed by incubation with an Alexa Fluor 568-conjugated anti-rabbit antibody (red). B, nuclei were stained with Hoechst 33658 (blue). C, the colocalizion of FADS with Hoechst is depicted in white. Scale bar, 50 μm. Subcellular fractions of cardiac fibroblasts were obtained as described under “Experimental Procedures.” D, The cytosolic (Cyt) and nuclear (Ncl) fractions were analyzed by immunoblotting with the anti-FADS antiserum. After stripping, the same PVDF membrane was tested with anti-tubulin and anti-succinate dehydrogenase antibodies (anti-SDH), used as cytosolic and mitochondrial markers, respectively. The arrows indicate the position of the main anti-FADS-immunoreactive bands.
FIGURE 5.
FIGURE 5.
Nuclear localization of FADS in rat liver. Pure nuclei (pNcl) were isolated from rat liver homogenate (Homo) as described under “Experimental Procedures.” A, distribution of the enzymatic activities of the cytosolic marker LDH and the nuclear marker nicotinamide-mononucleotide adenylyltransferase (NMNAT) between homogenate and nuclei. B, immunoblotting of rat liver homogenate and pure nuclei (0.03 mg protein each). The same PVDF membrane tested with the anti-FADS antiserum was tested with anti-tubulin, anti-lamin A/C, and anti-dimethylglycine dehydrogenase (DMGDH) antibodies.
FIGURE 6.
FIGURE 6.
Chromatographic and enzymatic evidence of nuclear FAD synthesis. A, upper panel, typical HPLC chromatogram of neutralized perchloric acid extracts of isolated nuclei from rat liver showing flavin content (see “Experimental Procedures”). Lower panel, time course of FAD synthesis catalyzed by rat liver nuclei added to 2 μm FMN, 5 mm ATP, and 5 mm MgCl2 in 50 mm Tris-Cl (pH 7.5) at 37 °C, in the absence (●) or in the presence (○) of 50 μm HgCl2. B, the amount of FAD in ultrafiltered rat liver nuclei was enzymatically assayed by using the FAD detecting system (FADS D.S.), here schematized and described in greater detail under “Experimental Procedures.” Ultrafiltered nuclei (0.06 mg of protein) were incubated at 37 °C for 5 min in 100 μl of 50 mm Tris-HCl (pH 7.5) in the absence (dotted line, −FMN & ATP) or in the presence of the substrate pair 2 μm FMN and 1 mm ATP (straight lines). The effect of 5 mm MgCl2 on FAD synthesis was also evaluated.
FIGURE 7.
FIGURE 7.
FAD hydrolysis by isolated rat liver nuclei. A, rat liver nuclei (0.1 mg of protein) were incubated for 1 min as described under “Experimental Procedures,” and then 5 μm FAD was added. Flavin fluorescence emission spectra were monitored at different incubation times. In the inset, the fluorescence measured at 520 nm, as obtained either in the absence (●) or presence (○) of 5 mm EDTA, was plotted against time. B, chromatographic evidence of FAD hydrolysis catalyzed by pure nuclei. FAD, FMN, and Rf were revealed by HPLC in nuclear extracts obtained after 0 min (chromatograms a and a′), 4 min (chromatograms b and b′), and 120 min (chromatograms c and c′) of incubation with FAD, either in the absence (chromatograms a–c) or in the presence (chromatograms a′–c′) of 5 mm EDTA. C, some features of FAD hydrolysis are reported. The rate of FAD hydrolysis by pure nuclei (0.4 mg of proteins) was measured fluorimetrically. In chromatogram a, the pH profile of the rate of FAD (5 μm) hydrolysis is shown. 100 mm acetate/acetic acid and 50 mm Tris-HCl (with 5 mm MgCl2) at different pH values were used as buffering mixtures. A specific calibration curve was obtained at each pH value as described under “Experimental Procedures.” The values are reported as percentages of the maximum rate (6.3 nmol·min−1·mg−1 of protein) arbitrarily set equal to 100%. The inhibition by externally added GTP, ATP, and AMP (chromatogram b) or NADH and NAD+ (chromatogram c) on the rate of FAD (0.6 μm) hydrolysis is shown. The data shown in chromatograms b and c were fitted according to a single exponential decay equation using the Grafit software (version 3.00; Erithacus Software).
FIGURE 8.
FIGURE 8.
FAD homeostasis in mammalian cells. FAD cofactor is represented in this drawing by a star. Flavin transporters are indicated with circles (circled I, plasma membrane Rf transporter, i.e., RFVT1–3 described in Ref. ; circled II, mitochondrial Rf transporter, still uncharacterized; circled III, mitochondrial FAD exporter). The question mark indicates the unknown origin of Rf in the nucleus. FAD-synthesizing enzymes are indicated with gray boxes (box 1, riboflavin kinase; box 2, FADS). FAD degrading enzymes are indicated with white boxes (box 3, FAD pyrophosphatase; box 4, FMN phosphohydrolase). Apo-flavoprotein (apo-Fp) into holoflavoprotein (holo-Fp) transition and FAD recycling are indicated with dotted lines. Some nuclear flavoenzymes are indicated with white boxes with a star. AIF, apoptosis inducing factor1; LSD1/2, lysine-specific demethylase 1/2; TXNRD1, thioredoxin reductase. The scheme summarizes the functional studies described in this and other previous papers (18, 61, 62).

References

    1. Massey V. (1995) Introduction. Flavoprotein structure and mechanism. FASEB J. 9, 473–475 - PubMed
    1. Massey V. (2000) The chemical and biological versatility of riboflavin. Biochem. Soc. Trans. 28, 283–296 - PubMed
    1. McCormick D. B. (1989) Two interconnected B vitamins. Riboflavin and pyridoxine. Physiol. Rev. 69, 1170–1198 - PubMed
    1. Macheroux P., Kappes B., Ealick S. E. (2011) Flavogenomics. A genomic and structural view of flavin-dependent proteins. FEBS J. 278, 2625–2634 - PubMed
    1. Joosten V., van Berkel W. J. (2007) Flavoenzymes. Curr. Opin. Chem. Biol. 11, 195–202 - PubMed

Publication types

Substances

LinkOut - more resources