A novel function for the conserved glutamate residue in the walker B motif of replication factor C
- PMID: 23946885
- PMCID: PMC3740443
- DOI: 10.3390/genes4020134
A novel function for the conserved glutamate residue in the walker B motif of replication factor C
Abstract
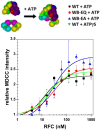
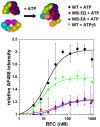
In all domains of life, sliding clamps tether DNA polymerases to DNA to increase the processivity of synthesis. Clamp loaders load clamps onto DNA in a multi-step process that requires ATP binding and hydrolysis. Like other AAA+ proteins, clamp loaders contain conserved Walker A and Walker B sequence motifs, which participate in ATP binding and hydrolysis, respectively. Mutation of the glutamate residue in Walker B motifs (or DExx-boxes) in AAA+ proteins typically reduces ATP hydrolysis by as much as a couple orders of magnitude, but has no effect on ATP binding. Here, the Walker B Glu in each of the four active ATP sites of the eukaryotic clamp loader, RFC, was mutated to Gln and Ala separately, and ATP binding- and hydrolysis-dependent activities of the quadruple mutant clamp loaders were characterized. Fluorescence-based assays were used to measure individual reaction steps required for clamp loading including clamp binding, clamp opening, DNA binding and ATP hydrolysis. Our results show that the Walker B mutations affect ATP-binding-dependent interactions of RFC with the clamp and DNA in addition to reducing ligand-dependent ATP hydrolysis activity. Here, we show that the Walker B glutamate is required for ATP-dependent ligand binding activity, a previously unknown function for this conserved Glu residue in RFC.
Keywords: AAA+ ATPase; ATP hydrolysis; DNA replication; Walker B motif; clamp loader; sliding clamp.
Figures


Similar articles
-
The ATP sites of AAA+ clamp loaders work together as a switch to assemble clamps on DNA.J Biol Chem. 2014 Feb 28;289(9):5537-48. doi: 10.1074/jbc.M113.541466. Epub 2014 Jan 16. J Biol Chem. 2014. PMID: 24436332 Free PMC article.
-
Linchpin DNA-binding residues serve as go/no-go controls in the replication factor C-catalyzed clamp-loading mechanism.J Biol Chem. 2017 Sep 22;292(38):15892-15906. doi: 10.1074/jbc.M117.798702. Epub 2017 Aug 14. J Biol Chem. 2017. PMID: 28808059 Free PMC article.
-
Evolutionary clues to eukaryotic DNA clamp-loading mechanisms: analysis of the functional constraints imposed on replication factor C AAA+ ATPases.Nucleic Acids Res. 2005;33(11):3614-28. doi: 10.1093/nar/gki674. Nucleic Acids Res. 2005. PMID: 16082778 Free PMC article.
-
Loading clamps for DNA replication and repair.DNA Repair (Amst). 2009 May 1;8(5):570-8. doi: 10.1016/j.dnarep.2008.12.014. Epub 2009 Feb 11. DNA Repair (Amst). 2009. PMID: 19213612 Free PMC article. Review.
-
The RFC clamp loader: structure and function.Subcell Biochem. 2012;62:259-79. doi: 10.1007/978-94-007-4572-8_14. Subcell Biochem. 2012. PMID: 22918590 Free PMC article. Review.
Cited by
-
Uncovering novel polyhydroxyalkanoate biosynthesis genes and unique pathway in yeast hanseniaspora valbyensis for sustainable bioplastic production.Sci Rep. 2024 Nov 8;14(1):27162. doi: 10.1038/s41598-024-77382-x. Sci Rep. 2024. PMID: 39511267 Free PMC article.
-
Allosteric communication in DNA polymerase clamp loaders relies on a critical hydrogen-bonded junction.Elife. 2021 Apr 13;10:e66181. doi: 10.7554/eLife.66181. Elife. 2021. PMID: 33847559 Free PMC article.
-
Multistep loading of a DNA sliding clamp onto DNA by replication factor C.Elife. 2022 Aug 8;11:e78253. doi: 10.7554/eLife.78253. Elife. 2022. PMID: 35939393 Free PMC article.
-
The ATP sites of AAA+ clamp loaders work together as a switch to assemble clamps on DNA.J Biol Chem. 2014 Feb 28;289(9):5537-48. doi: 10.1074/jbc.M113.541466. Epub 2014 Jan 16. J Biol Chem. 2014. PMID: 24436332 Free PMC article.
-
Structural Insights into Bortezomib-Induced Activation of the Caseinolytic Chaperone-Protease System in Mycobacterium tuberculosis.Nat Commun. 2025 Apr 11;16(1):3466. doi: 10.1038/s41467-025-58410-4. Nat Commun. 2025. PMID: 40216758 Free PMC article.
References
-
- Stukenberg P.T., Studwell-Vaughan P.S., O’Donnell M. Mechanism of the sliding b-clamp of DNA polymerase iii holoenzyme. J. Biol. Chem. 1991;266:11328–11334. - PubMed
Grants and funding
LinkOut - more resources
Full Text Sources
Other Literature Sources
