. 2013 Aug 16:14:557.
doi: 10.1186/1471-2164-14-557.

Transcriptional analysis of abdominal fat in genetically fat and lean chickens reveals adipokines, lipogenic genes and a link between hemostasis and leanness

Affiliations

Transcriptional analysis of abdominal fat in genetically fat and lean chickens reveals adipokines, lipogenic genes and a link between hemostasis and leanness

Christopher W Resnyk et al. BMC Genomics. .

Abstract

Background: This descriptive study of the abdominal fat transcriptome takes advantage of two experimental lines of meat-type chickens (Gallus domesticus), which were selected over seven generations for a large difference in abdominal (visceral) fatness. At the age of selection (9 wk), the fat line (FL) and lean line (LL) chickens exhibit a 2.5-fold difference in abdominal fat weight, while their feed intake and body weight are similar. These unique avian models were originally created to unravel genetic and endocrine regulation of adiposity and lipogenesis in meat-type chickens. The Del-Mar 14K Chicken Integrated Systems microarray was used for a time-course analysis of gene expression in abdominal fat of FL and LL chickens during juvenile development (1-11 weeks of age).

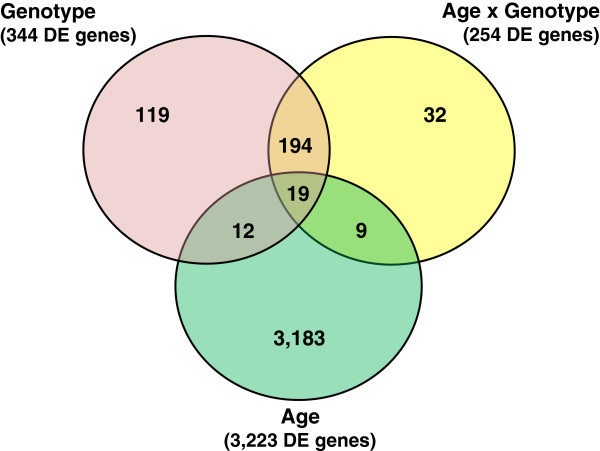
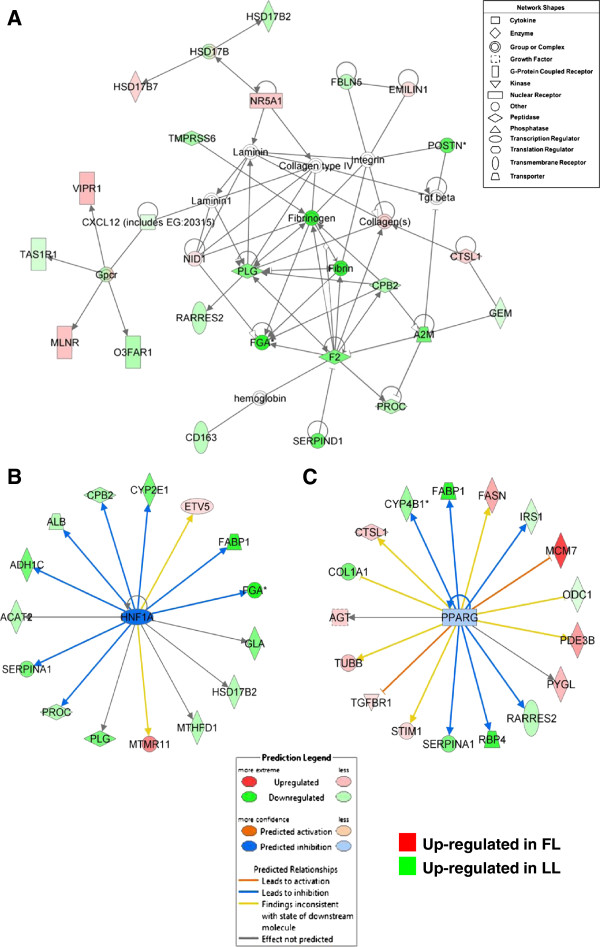
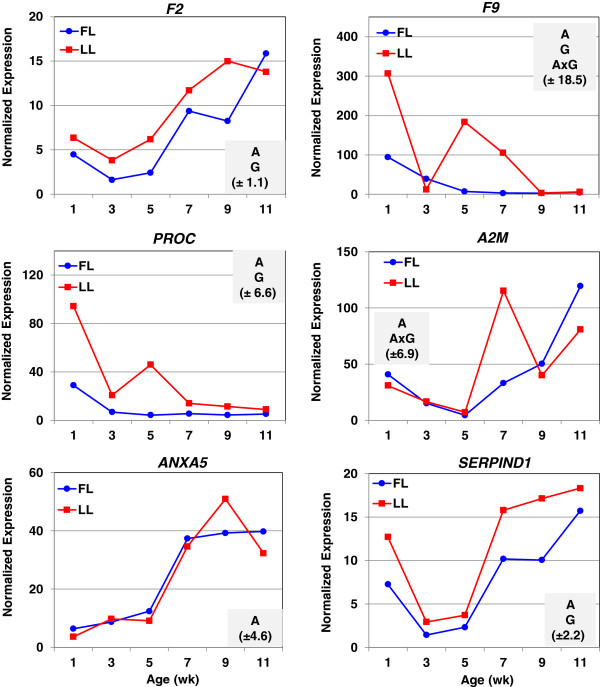
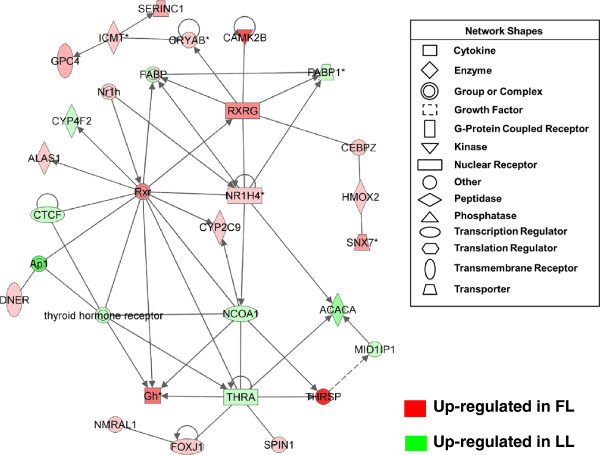
Results: Microarray analysis of abdominal fat in FL and LL chickens revealed 131 differentially expressed (DE) genes (FDR≤0.05) as the main effect of genotype, 254 DE genes as an interaction of age and genotype and 3,195 DE genes (FDR≤0.01) as the main effect of age. The most notable discoveries in the abdominal fat transcriptome were higher expression of many genes involved in blood coagulation in the LL and up-regulation of numerous adipogenic and lipogenic genes in FL chickens. Many of these DE genes belong to pathways controlling the synthesis, metabolism and transport of lipids or endocrine signaling pathways activated by adipokines, retinoid and thyroid hormones.

Conclusions: The present study provides a dynamic view of differential gene transcription in abdominal fat of chickens genetically selected for fatness (FL) or leanness (LL). Remarkably, the LL chickens over-express a large number of hemostatic genes that could be involved in proteolytic processing of adipokines and endocrine factors, which contribute to their higher lipolysis and export of stored lipids. Some of these changes are already present at 1 week of age before the divergence in fatness. In contrast, the FL chickens have enhanced expression of numerous lipogenic genes mainly after onset of divergence, presumably directed by multiple transcription factors. This transcriptional analysis shows that abdominal fat of the chicken serves a dual function as both an endocrine organ and an active metabolic tissue, which could play a more significant role in lipogenesis than previously thought.


Figures

Figure 1
Figure 1
Venn diagram showing unique and shared genes among main effect of age (A) or genotype (G), and their interaction (A × G). This diagram shows the number of differentially expressed (DE) genes that are common across contrasts and those that are unique to G (P≤0.05), A (P≤0.001), or the A × G interaction (P≤0.05).
Figure 2
Figure 2
Gene interaction network in abdominal fat of LL chickens associated with hemostasis. Functional gene interactions networks were identified by Ingenuity Pathway Analysis (IPA®) software. This network shows direct gene interactions mainly in abdominal fat of LL chickens related to “Hematological System Development and Function” (A). The IPA® Upstream Regulator Analysis identified transcription factors with direct actions on differentially expressed target genes in abdominal fat of FL and LL chickens. This analysis of upstream regulators (based on expected responses from literature and observed responses in the data set) predicts inhibition (blue color) of hepatic nuclear factor 1A (HNF1A) (B) and peroxisome proliferator-activated receptor gamma (PPARG) (C), which would lead to inhibition (blue edges or lines) of target gene expression. Red gene symbols indicate higher expression in the FL and green gene symbols indicate higher expression in the LL.
Figure 3
Figure 3
Verification of differential expression of hemostatic genes by qRT-PCR analysis. The abundance of six genes associated with blood coagulation was determined by quantitative reverse transcription PCR (qRT-PCR) analysis. Data points represent Least Squares Means (LSMEANS; n = 4 birds/genotype) of normalized expression values generated by the general linear models (GLM) procedure in Statistical Analysis System (SAS) software. A two-factor (genotye and age) analysis of variance (ANOVA) was used to determine significance (P≤0.05). The shaded box in each panel indicates significant effects of age (A), genotype (G) and/or the A x G interaction; the parenthesis shows the common standard error (SE) of LSMEANS for that gene as determined by the GLM procedure in SAS.
Figure 4
Figure 4
Verification of differential expression of adipokines by qRT-PCR analysis. The abundance of eight adipokines was determined by quantitative reverse transcription PCR (qRT-PCR) analysis. Data points represent LSMEANS (n = 4 birds/genotype) of normalized expression values. A two-factor ANOVA was used to determine significance (P≤0.05). The shaded box in each panel indicates significant effects of age (A), genotype (G) and/or the A × G interaction; the parenthesis shows the common standard error (SE) of LSMEANS for that gene determined by the GLM procedure in SAS.
Figure 5
Figure 5
Transcriptional regulation of gene interaction network in abdominal fat of FL and LL chickens controlling lipogenesis. Functional gene interactions and up-stream regulators were identified by IPA (gene symbols and color schemes as described in Figure 2). Direct interactions (solid lines) were found among transcription regulators [JUN, SREBF1, SIRT2, MID1IP1, NR1H2 (LXRB) and THRSP] and lipogenic genes (A). ✝THRSP and its paralog MID1IP1 (or THRSP-like, THRSPL) were not con sidered as transcription regulators by IPA software. THRSPA was added to this network based on microarray and qRT-PCR analysis (Additional files 3 and 7) and known involvement of THRSP in regulating expression of lipogenic enzymes across multiple species of birds and mammals. This analysis of upstream regulators predicts activation of JUN (B) and sterol response element binding factor 1 (SREBF1) (C), which would lead to inhibition or activation [orange edges (lines)] expression of DE target genes. Gene symbol color indicates higher expression in the FL (red) or higher expression (green) in the LL.
Figure 6
Figure 6
Expression of genes associated with lipid metabolism by qRT-PCR analysis. mRNA expressions of eight genes involved in lipid metabolism were determined by quantitative reverse transcription PCR (qRT-PCR). Each data point represents LSMEANS (n = 4 birds/genotype) of normalized expression values. A two-factor ANOVA was used to determine significance (P≤0.05). The shaded box in each panel indicates significant effects of age (A), genotype (G) and/or the A × G interaction; the parenthesis shows the common standard error (SE) of LSMEANS for that gene determined by the GLM procedure in SAS.
Figure 7
Figure 7
Transcriptional regulators of DE genes controlling lipogenesis in abdominal fat of FL and LL chickens. A large number of DE lipogenic genes interact with two transcriptional regulators, SIRT2 and PPARD(A). The IPA Upstream Regulator Analysis (B) predicts that the up-regulation of SIRT2 leads to activation of five lipogeneic genes (orange-edged arrows), whereas, the predicted inhibition of PPARD would lead to down regulation (blue-edged arrows) of seven DE target genes in the FL [or up-regulation (green gene symbols) in the LL]. The predicted activation of major lipogenic genes (ALDH2, CCL13, FASN and SCD) would be blocked (blunt orange arrow) by PPARD.
Figure 8
Figure 8
Gene interaction network of nuclear receptors, co-activators and regulators of gene transcription in abdominal fat of juvenile FL and LL chickens. This gene network shows direct interactions of seven transcriptional regulators [CEBPZ, RXRG, NR1H4 or farnesoid X receptor (FXR), NCOA1 or steroid receptor coactivator 1 (SRC-1), THRA, THRSP and MID1IP1 (or THRSP-like, THRSPL)] and their target genes. Gene symbol color indicates higher expression in the FL (red) or higher expression (green) in the LL.
Figure 9
Figure 9
Upstream regulators of gene transcription in abdominal fat of juvenile FL and LL chickens. Ingenuity® Upstream Regulator Analysis revealed a large number of transcriptional regulators (see Table 4) controlling lipid metabolism genes in abdominal fat (A). This IPA analysis shows “up-stream regulators” and their downstream targets found among DE fatty acid metabolism genes identified in abdominal fat of the FL and LL chickens. Differentially expressed gene targets regulated by six additional transcription factors are shown (B). The IPA prediction of activation (orange lines and symbols) or (blue lines and symbols) inhibition states is based on prior knowledge accrued by Ingenuity® Knowledge Base and expression values of differentially expressed genes identified by microarray analysis of abdominal fat in juvenile FL and LL chickens. Gene symbol color indicates higher expression in the FL (red) or higher expression (green) in the LL.

Similar articles

Cited by

References

    1. International Chicken Genome Sequencing Consortium. Sequence and comparative analysis of the chicken genome provide unique perspectives on vertebrate evolution. Nature. 2004;432:695–716. doi: 10.1038/nature03154. - DOI - PubMed
    1. Burt DW. Emergence of the chicken as a model organism: implications for agriculture and biology. Poult Sci. 2007;86:1460–1471. - PubMed
    1. Cogburn LA, Porter TE, Duclos MJ, Simon J, Burgess SC, Zhu JJ, Cheng HH, Dodgson JB, Burnside J. Functional genomics of the chicken–a model organism. Poult Sci. 2007;86:2059–2094. - PubMed
    1. Dodgson JB. The chicken genome: some good news and some bad news. Poult Sci. 2007;86:1453–1459. - PubMed
    1. Stern CD. The chick: a great model system becomes even greater. Dev Cell. 2005;8:9–17. - PubMed

Publication types

MeSH terms

LinkOut - more resources