. 2013 Aug 12;26(3):266-78.
doi: 10.1016/j.devcel.2013.07.007.

Exo70 generates membrane curvature for morphogenesis and cell migration

Affiliations

Exo70 generates membrane curvature for morphogenesis and cell migration

Yuting Zhao et al. Dev Cell. .

Abstract

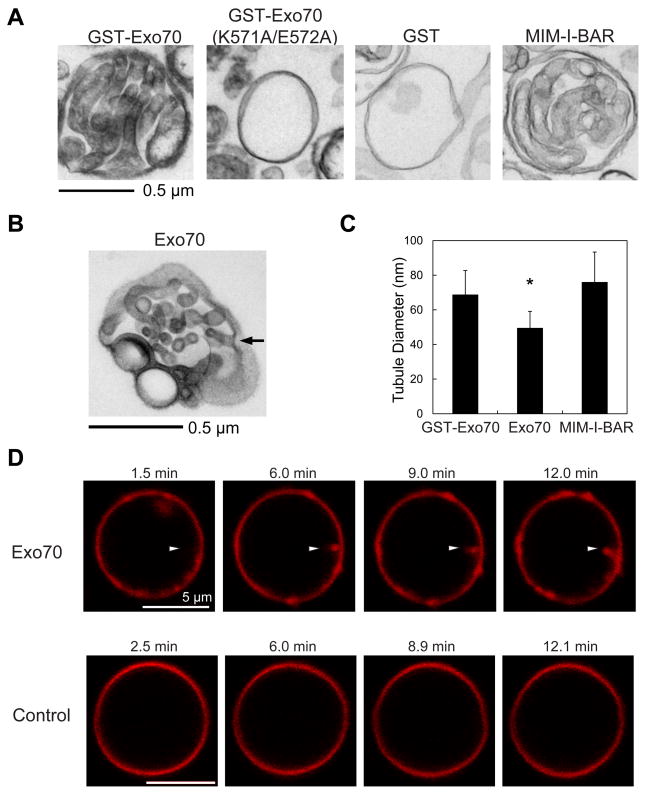
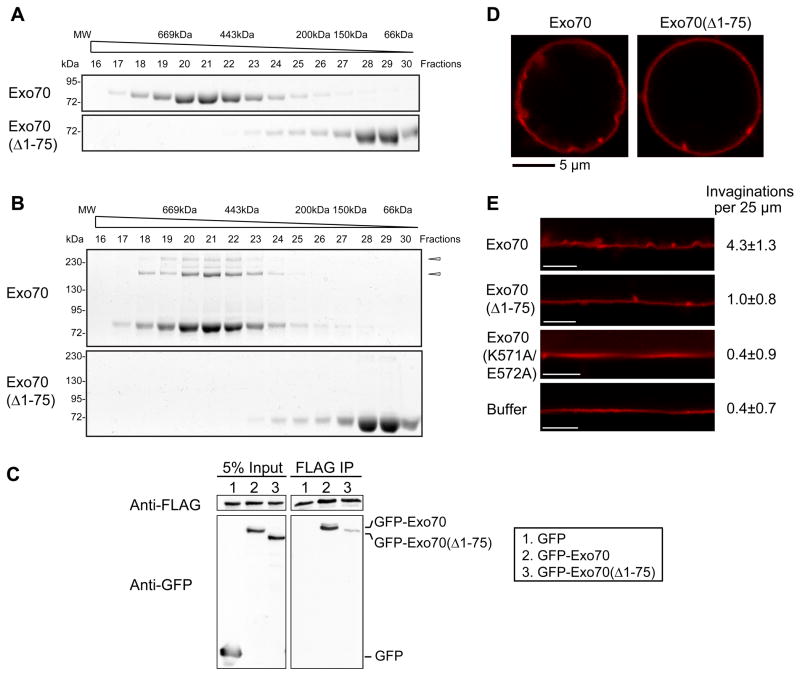
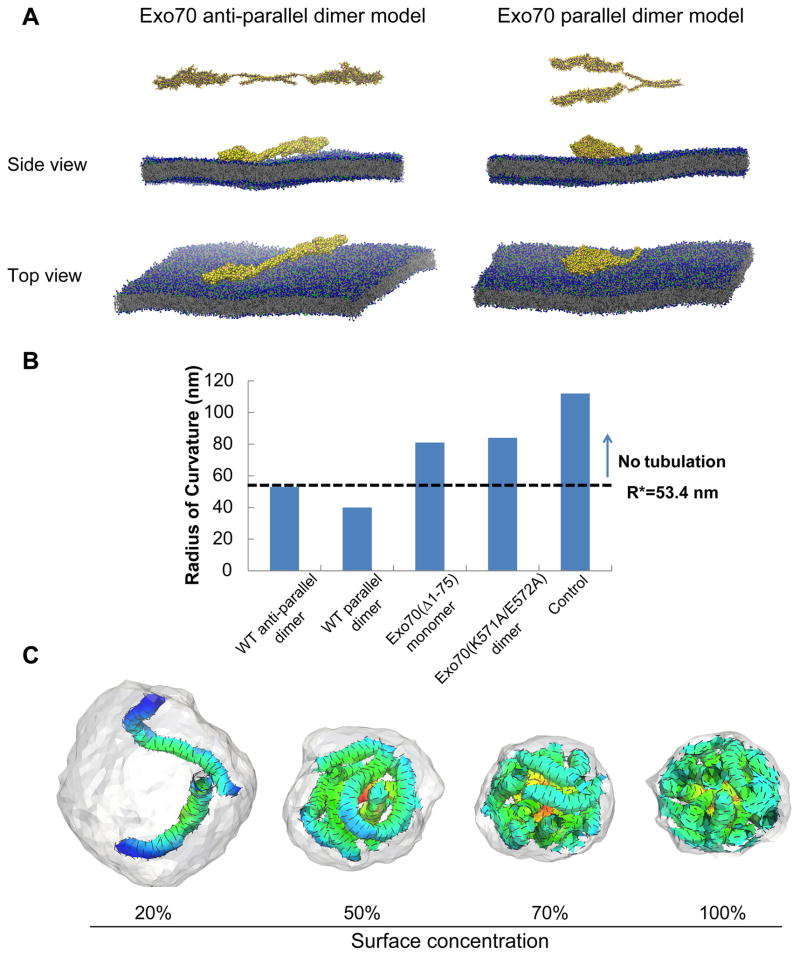
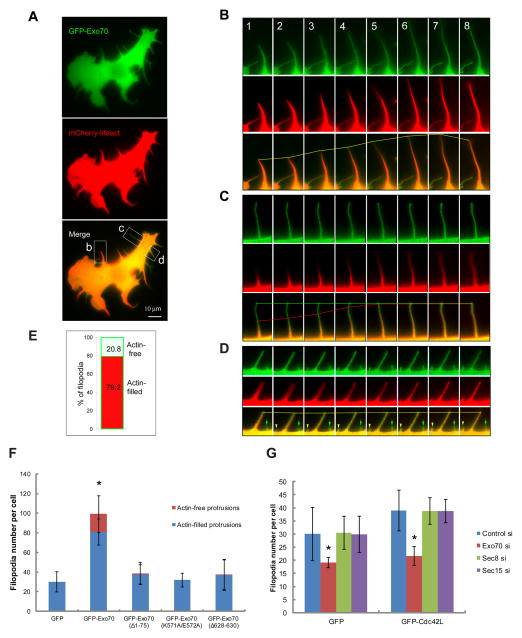
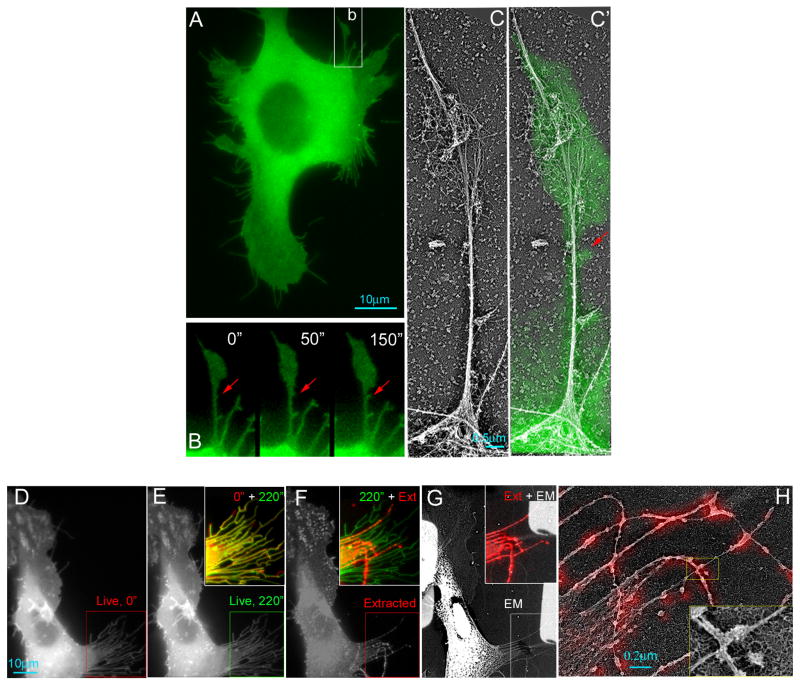
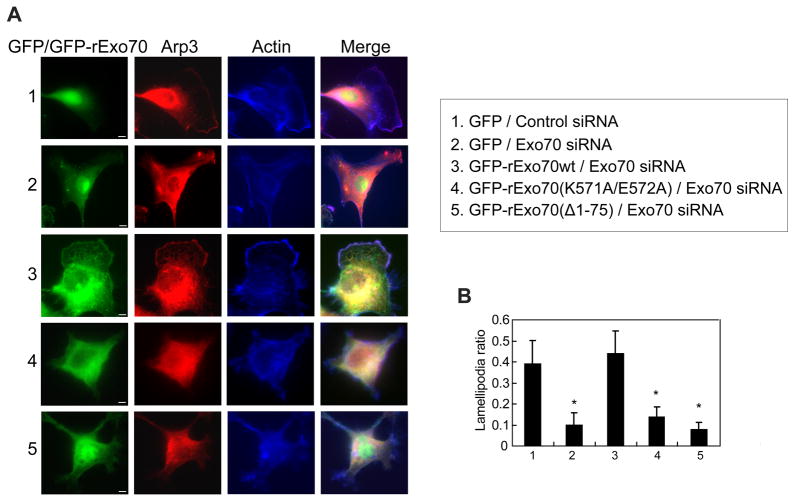
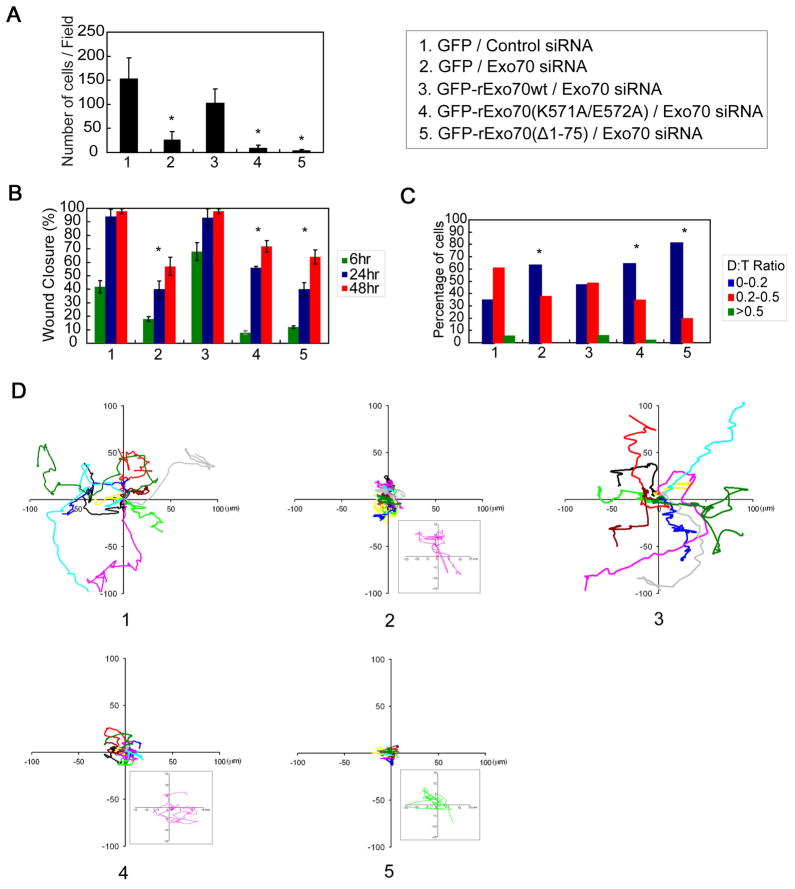
Dynamic shape changes of the plasma membrane are fundamental to many processes, ranging from morphogenesis and cell migration to phagocytosis and viral propagation. Here, we demonstrate that Exo70, a component of the exocyst complex, induces tubular membrane invaginations toward the lumen of synthetic vesicles in vitro and generates protrusions on the surface of cells. Biochemical analyses using Exo70 mutants and independent molecular dynamics simulations based on Exo70 structure demonstrate that Exo70 generates negative membrane curvature through an oligomerization-based mechanism. In cells, the membrane-deformation function of Exo70 is required for protrusion formation and directional cell migration. Exo70 thus represents a membrane-bending protein that may couple actin dynamics and plasma membrane remodeling for morphogenesis.


Figures

Figure 1
Figure 1. Exo70 induces tubular invaginations on synthetic vesicles
(A) Transmission EM showing that GST-Exo70 induced tubular invaginations towards the interior of the lumen of LUVs similar to the MIM I-BAR domain. GST, GST-Exo70(K571A/E572A) did not induce any membrane tubules. See EXPERIMENTAL PROCEDURES for details. Scale bar, 0.5 μm. (B) Untagged Exo70 induced membrane invaginations. The arrow shows a representative region where the tubular invagination was connected to the exterior. See also Supplemental Movie 1a for 3-D tomography of this LUV. (C) Comparison of the diameters of the membrane tubules induced by different proteins. Error bars represent standard deviation (SD). n=80; *, p<0.01. (D) Confocal microscopy of fluorescence-labeled Giant Unilamellar Vesicles (GUVs) incubated with Exo70 (upper panel) or buffer control (lower panel). Sequential frames show the inward growth of a tubule (arrowhead) from a GUV incubated with Exo70. Scale bar, 5 μm.
Figure 2
Figure 2. Oligomerization of Exo70 is required for membrane deformation
(A) Recombinant Exo70 proteins were loaded onto a Superdex 200 10/300GL column and eluted fractions were subjected to SDS-PAGE. Exo70, but not Exo70(Δ1–75), was eluted in high MW fractions. (B) Gel-filtration fractions were lightly treated with cross-linker BM(PEG)2, which links proteins in vicinity. High MW species were observed in Exo70 but not in Exo70(Δ1–75) fractions. Arrowheads: Exo70 oligomers. (C) Lysates of HEK293T cell expressing Exo70-FLAG together with GFP, GFP-Exo70, or GFP-Exo70(Δ1–75) were incubated with anti-FLAG (M2) beads. The inputs and bound proteins were analyzed by Western blotting using anti-FLAG (upper panels) and anti-GFP monoclonal antibodies (lower panels). Exo70-FLAG was able to pull down GFP-Exo70, but to a much lesser extent, GFP-Exo70(Δ1–75). (D) Exo70 or Exo70(Δ1–75) was incubated with GUVs and subjected to confocal microscopy. Exo70(Δ1–75) induced much fewer invaginations than Exo70. (E) The contours of GUV membranes were linearized. The numbers of invaginations per 25 μm were calculated (average ± SD). Exo70(Δ1–75) and Exo70(K571A/E572A) induced much fewer invaginations than the full-length Exo70 (n=10; p<0.01). Scale bar, 5 μm.
Figure 3
Figure 3. Molecular dynamics and mesoscale simulations demonstrate that Exo70 induces negative membrane curvature
(A) Molecular dynamics simulation of modeled Exo70 anti-parallel (left) and parallel (right) dimers on a DOPC/DOPS bilayer. Top and side views of the simulation snapshots show negative curvature formed in both directions. All snapshots were rendered with VMD (Humphrey et al., 1996). See also Supplemental Movie 2 for a more comprehensive view and Supplemental Movie 3 for analysis of negative curvature recorded in the simulations. (B) Comparison of the radius of curvature estimates (here R = 〈2Hmax−1) for different Exo70 variants on the membrane. Dashed line at 53.4 nm represents the threshold above which no inward membrane tubulation was detected in mesoscale simulations. (C) Snapshots from mesoscale simulations of inward growing tubules for model Exo70 domains at different surface concentration (from 20% to 100%); a0=14 nm, H0||=−1.0/a0 and εLL =1kBT. The extent of tubulation is Exo70 concentration-dependent. Exo70 proteins on the outer surface of the membrane are not shown in order to enhance the visibility of the tubules. See also Supplemental Figure 1.
Figure 4
Figure 4. Characterization of Exo70-induced membrane protrusions on the cell surface
(A) Overview of a B16F1 cell co-expressing GFP-Exo70 and mCherry-Lifeact (labeling F-actin). (B-D) Time-lapse microscopy showing dynamics of individual filopodia in Box b, c, d, of (A). Time interval between frames is 42 seconds. The lines mark the most distal points of GFP-Exo70 (green) and actin (red) signals in the filopodia over time; the yellow lines indicate the coincidence of these signals. (B) For a regular filopodium, the dynamics of GFP-Exo70 and F-actin were indistinguishable. (C) While GFP-Exo70 signal was stationary, F-actin lagged behind and gradually filled the filopodium. (D) GFP-Exo70 and F-actin co-localized in the long stationary filopodium, whereas the nascent GFP-Exo70-positive filopodium (green arrow) was actin-free. In the same field, a new membrane protrusion (yellow arrowhead) was emerging and gradually filled with F-actin. (E) The percentage of filopodia completely filled with F-actin (red) and lacking F-actin (blue) in the interior. A total of 1687 filopodia in 31 cells were counted. (F) B16F1 cells expressing GFP-Exo70 variants were stained for F-actin. GFP-Exo70 induced significantly more filopodia than GFP or GFP-Exo70 mutants. In addition, approximately 20% of the GFP-Exo70-induced membrane protrusions were actin-free. Much lower percentages of the protrusions in cells expressing GFP or GFP-Exo70 mutants (see text for description of the mutants) were actin-free. Error bars, SD. n=10; *, p<0.01. See also Supplemental Figure 2E. (G) B16F1 cells treated with siRNA targeting Exo70, Sec8 or Sec15 were transfected with GFP or GFP-Cdc42L. The expression of GFP-Cdc42L induced more filopodia comparing to GFP cells. The number of filopodia was significantly reduced upon Exo70 knockdown. Knockdown of Sec8 or Sec15 did not affect the filopodia formation in GFP-Cdc42L or GFP cells. Error bars, SD. n=10; *, p<0.01. See also Supplemental Figure 3B for Western blot showing the knockdown efficiency.
Figure 5
Figure 5. Dynamics and ultrastructures of Exo70-induced membrane protrusions
(A-C) Correlative fluorescence and platinum replica EM showing the organization of actin in protrusive structures in a GFP-Exo70-expressing cell. (A) Overview of a B16F1 cell expressing GFP-Exo70. Scale bar, 10 μm. (B) Frames from the time-lapse sequence showing dynamics of a protruding filopodium (corresponding to box b in A). Correlative EM of region B is shown in C or with overlaid GFP-Exo70 fluorescence (green) (C′). The red arrows show a newly generated membrane protrusion that was devoid of actin. (D-H) Correlative fluorescence and platinum replica EM of a GFP-Exo70-expressing cell shown by GFP fluorescence (D-F) or EM (G) at the beginning (D) and the end (E and F) of the 220 sec time-lapse sequence and after detergent extraction (“Ext”, with 1% Triton X-100 in PEM buffer containing 2 μM phalloidin without 2% PEG) (F, G). Inset in E is an overlay of boxed regions from D and E, showing that most of filopodial protrusions marked by GFP-Exo70 was barely changed. Inset in F is an overlay of boxed regions from E and F showing that half of membrane protrusions were removed by detergent extraction, while others remained (shown in red), which contained actin filaments as shown by EM (inset in G). (H) Correlative EM showing that each detergent-resistant filopodia contained only 2–4 actin filaments, which are superimposed with GFP-Exo70 signals (colored red).
Figure 6
Figure 6. The function of Exo70 in membrane deformation is required for lamellipodia formation
(A) MDA-MB-231 cells expressing indicated siRNA and GFP-tagged rat Exo70 variants were stained for Arp3 (red) and F-actin (blue) to detect lamellipodia. Control siRNA-treated cells (Panel 1) had clear and extended lamellipodia. In Exo70-knockdown cells (Panel 2), the formation of lamellipodia was impaired. Expression of GFP-rExo70 (Panel 3) rescued lamellipodia formation, whereas the expression of Exo70 mutants failed to rescue the defect (Panel 4–5). Scale bar, 5 μm. (B) The ratios between the length of the lamellipodia and the total cell perimeters (“lamellipodia ratio”) were compared for each group. The mutant groups have lower lamellipodia ratios. Error bars, SD. n=25; *, p<0.01.
Figure 7
Figure 7. The function of Exo70 in membrane deformation is required for directional cell migration
(A) Transwell assays were performed using cells described in Figure 6. The bars indicate the average number of migrated cells per field for each group. Error bars, SD. n=3; *, p<0.01. (B) Wound-healing assays were performed. The percentage of wound closure (closure distance over initial opening) after 6, 24, and 48 hours of migration was calculated for each group. Error bars, SD. n=3; *, p<0.01. See also Supplemental Figure 5B for wound healing images. (C) Single cell movement was tracked using time-lapse microscopy. Directional persistence of individual cells was calculated as D:T ratio (see text). The percentage of cells with different D:T ratios (0–0.2; 0.2–0.5; >0.5) is indicated. n=60; *, p<0.01. (D) The trajectories of 10 representative cells at 5 min intervals during a 400-min migration period are presented for each group. The origins of each track were superimposed at position (0, 0). The boxed regions in corresponding treatments showed 7× magnified migration track from one representative cell in each group, which indicates that the cells were not stationary.

References

    1. Agrawal NJ, Nukpezah J, Radhakrishnan R. Minimal mesoscale model for protein-mediated vesiculation in clathrin-dependent endocytosis. PLoS Comput Biol. 2010;6:e1000926. - PMC - PubMed
    1. Angelova MI, Dimitrov DS. Liposome electroformation. Faraday Discuss Chem Soc. 1986;81:303–311.
    1. Arkhipov A, Yin Y, Schulten K. Four-scale description of membrane sculpting by BAR domains. Biophys J. 2008;95:2806–2821. - PMC - PubMed
    1. Ayton GS, Voth GA. Systematic multiscale simulation of membrane protein systems. Curr Opin Struct Biol. 2009;19:138– 144. - PMC - PubMed
    1. Bereiter-Hahn J. Mechanics of crawling cells. Med Eng Phys. 2005;27:743–753. - PubMed

Publication types

MeSH terms