. 2013 Aug 12;24(2):197-212.
doi: 10.1016/j.ccr.2013.07.007.

Amplification of distant estrogen response elements deregulates target genes associated with tamoxifen resistance in breast cancer

Affiliations

Amplification of distant estrogen response elements deregulates target genes associated with tamoxifen resistance in breast cancer

Pei-Yin Hsu et al. Cancer Cell. .

Abstract

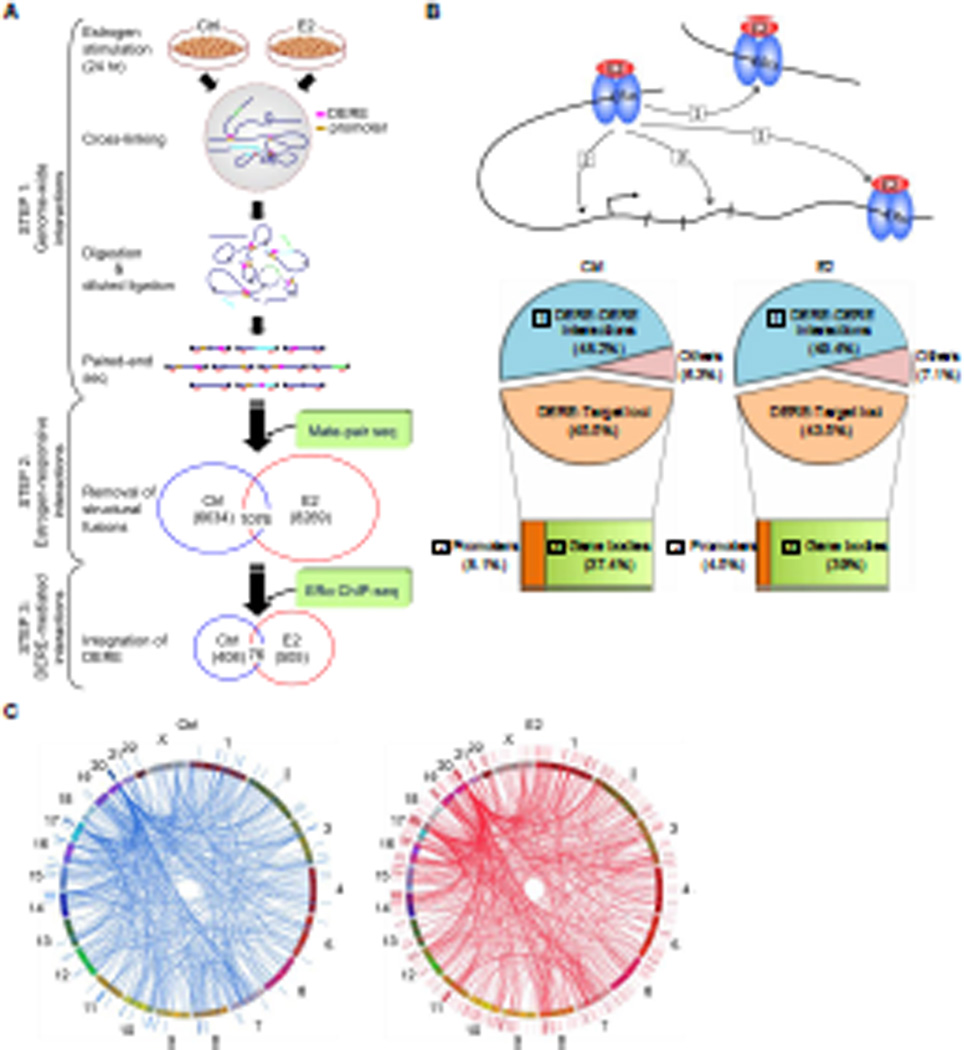
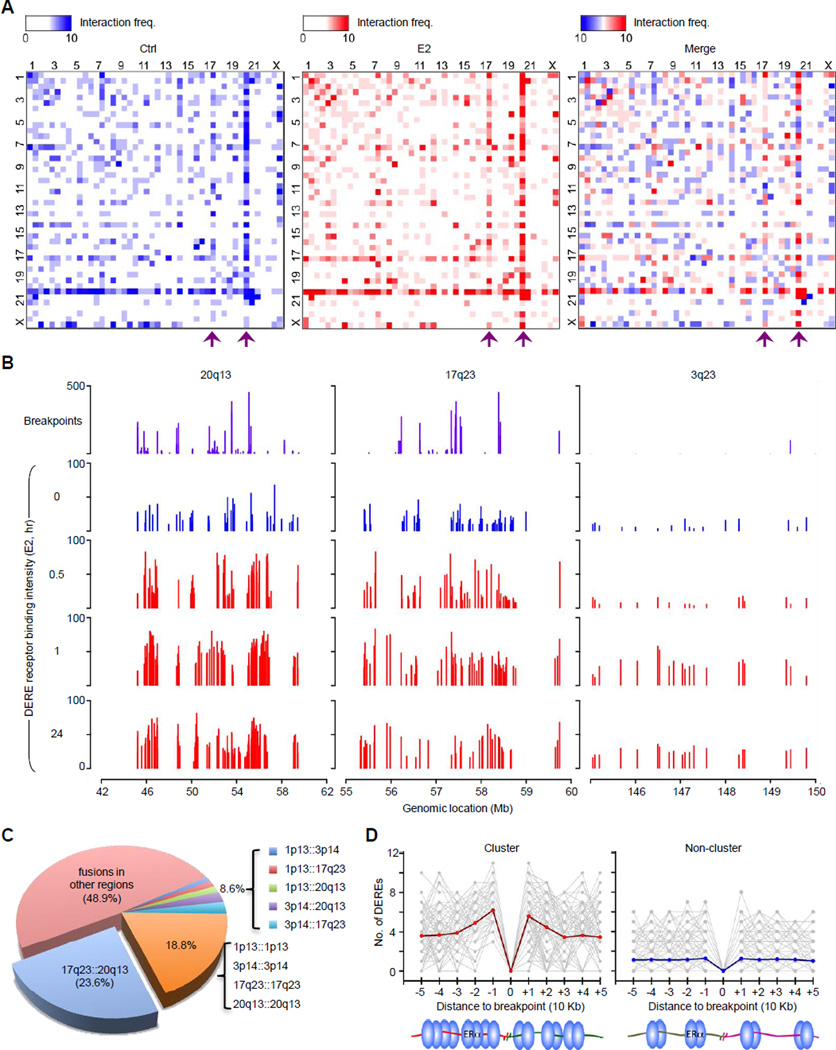
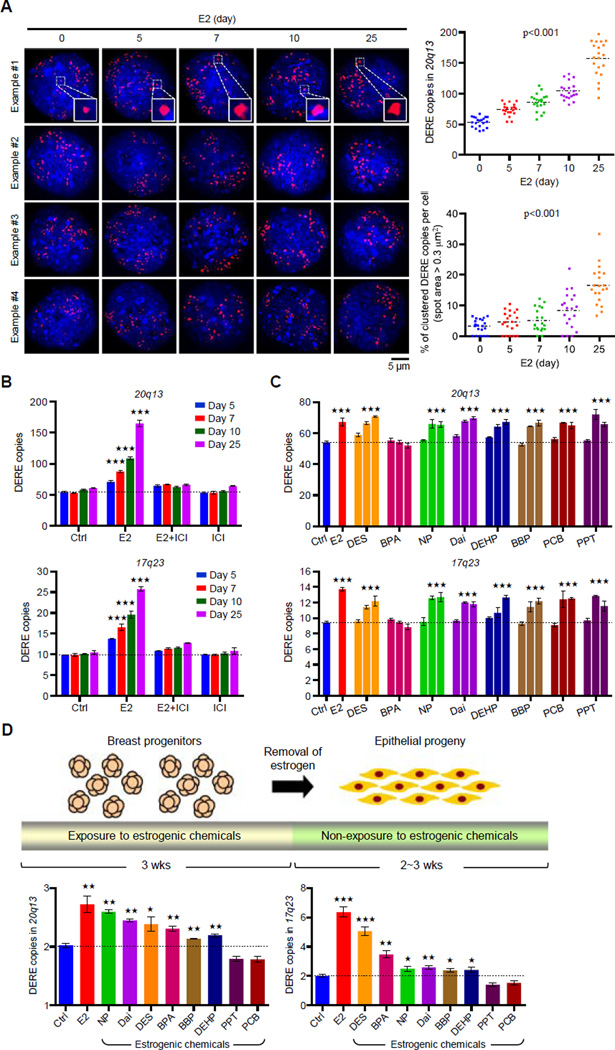
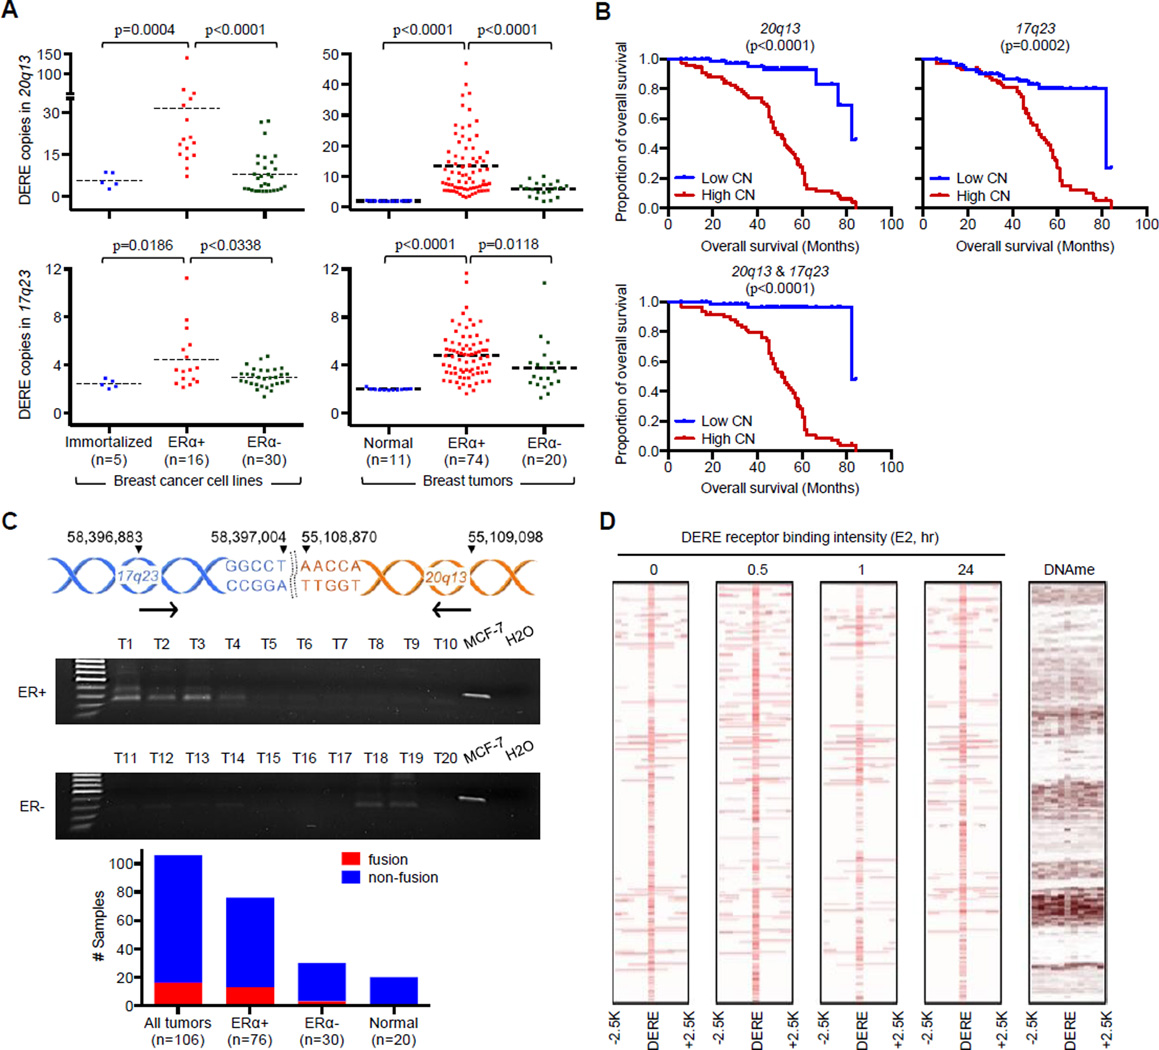
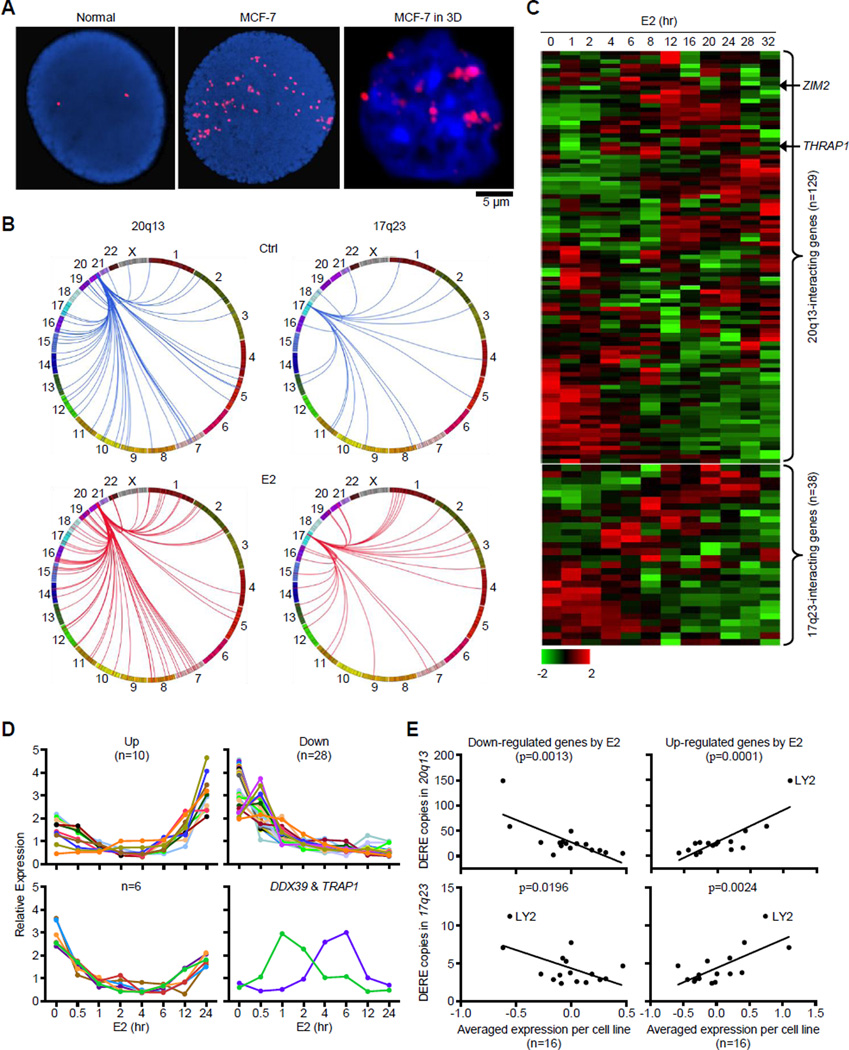
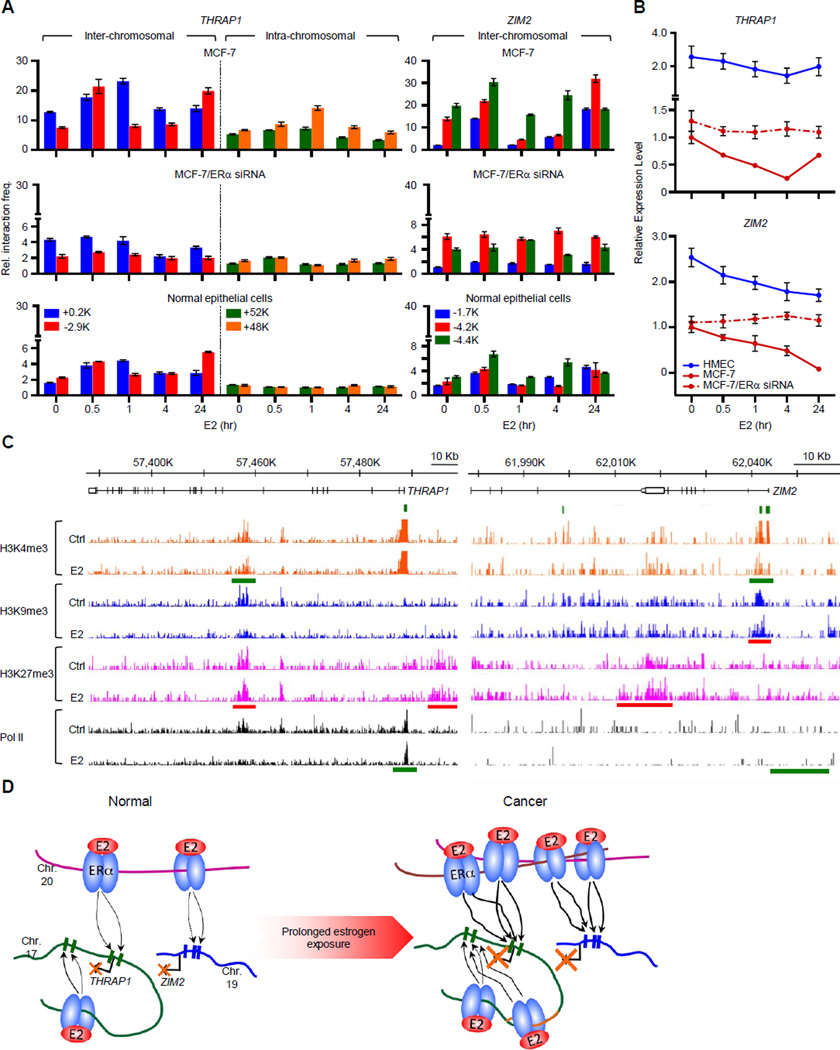
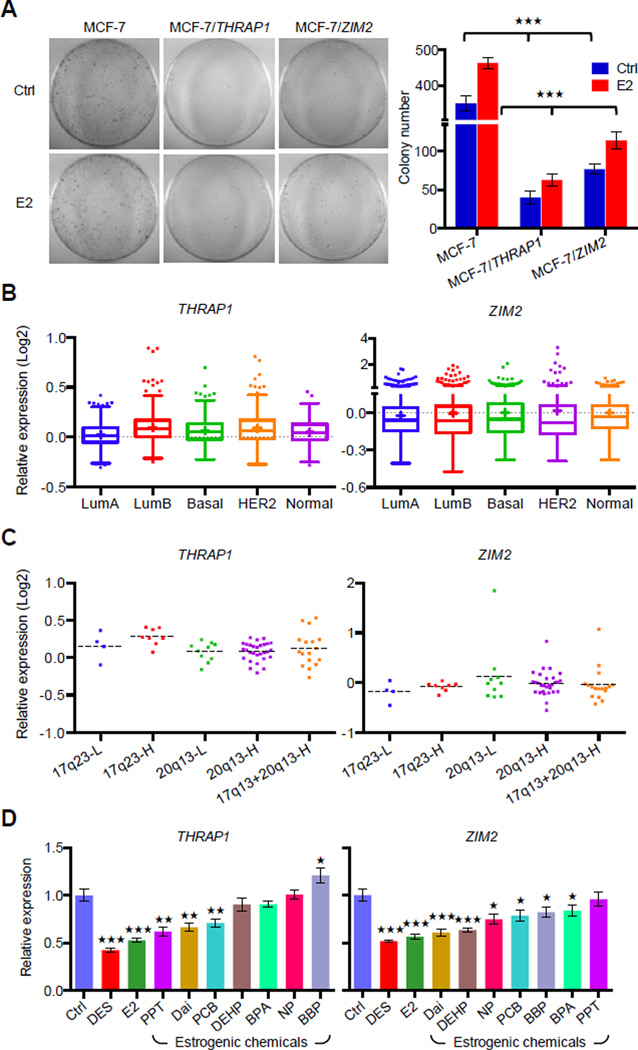
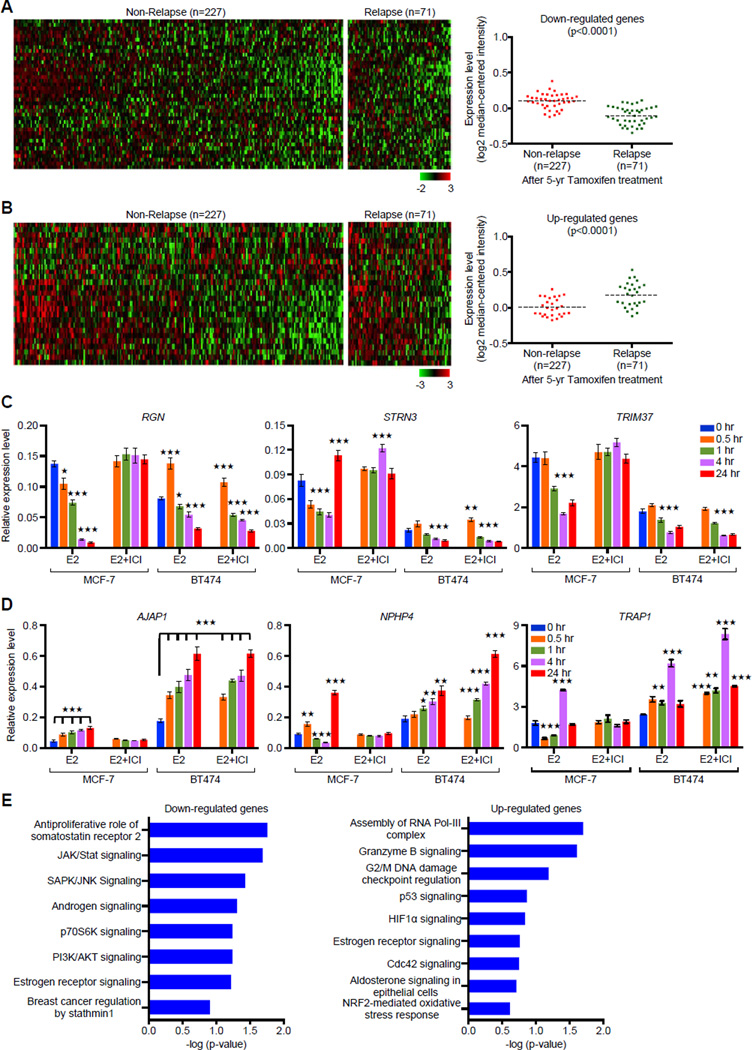
A causal role of gene amplification in tumorigenesis is well known, whereas amplification of DNA regulatory elements as an oncogenic driver remains unclear. In this study, we integrated next-generation sequencing approaches to map distant estrogen response elements (DEREs) that remotely control the transcription of target genes through chromatin proximity. Two densely mapped DERE regions located on chromosomes 17q23 and 20q13 were frequently amplified in estrogen receptor-α-positive luminal breast cancer. These aberrantly amplified DEREs deregulated target gene expression potentially linked to cancer development and tamoxifen resistance. Progressive accumulation of DERE copies was observed in normal breast progenitor cells chronically exposed to estrogenic chemicals. These findings may extend to other DNA regulatory elements, the amplification of which can profoundly alter target transcriptome during tumorigenesis.


Figures

Figure 1
Figure 1. Integrative Mapping of ERα-mediated Chromatin Interactions Based on Next-generation Sequencing Approaches
(A) Integrative scheme of identifying ERα/DERE-mediated chromatin interaction sites in E2-stimulated MCF-7 human breast cancer cells. Chromosome conformation capture (3C) assay coupled with paired-end sequencing was performed on both untreated (Ctrl) and estrogen-treated (E2, 70 nM) MCF-7 cells to survey chromatin interaction events in a genome-wide manner (STEP 1) (see also Figure S1A–B and Tables S1–2). To identify genuine interaction sites, genomic fusions and self-ligated fragments mapped by mate-pair sequencing were filtered-out from the 3C-seq dataset (STEP 2) (see also Tables S3–6). The filtered data were then integrated with ERα ChIP-seq datasets (0 and 24 hr, respectively) and distant estrogen response elements (DEREs) were mapped to define DERE-associated chromatin interaction events (STEP 3) (see also Tables S7). (B) Genomic distribution of ERα-mediated chromatin interaction sites. ERα-mediated interaction sites mapped within 10-kb regions of DEREs, which have no known target genes, were defined as DERE-DERE interactions. In the target loci category, the regions within 10-kb upstream and 1-kb downstream of the transcription start site (TSS) of a gene were defined as promoters. “Others” were defined as ERα-mediated interaction sites mapped in gene-desert regions. (C) Circular visualization of ERα-mediated interactions upon E2 stimulation. Circular plots depict interactive loci of different chromatin loops using the Circos software (http://mkweb,bcgsc.ca/circos/). Chromosomes are individually colored. The locations of DEREs are represented as lines outside the chromosomes “circle”. Four clustered DEREs were identified in 1p13, 3p14, 17q23, and 20q13 regions (see also Figure S1C).
Figure 2
Figure 2. Co-localization of Densely ERα-bound DEREs and Translocation-susceptible Regions
(A) Heat maps of DERE-DERE chromatin interactions. Frequencies of DERE-DERE interactions in p and q arms of individual chromosomes were plotted. Purple arrows indicate two major sites of DERE-DERE interactions on 20q13 and 17q23, respectively. See also Figure S2C–E for a proposed model of DERE-DERE fusions and amplification. (B) Genomic maps of translocation breakpoints and ERα-bound DEREs in three representative regions (3q23, 17q23, and 20q13) of MCF-7 cells. MCF-7 cells stimulated with E2 (70 nM) in a time-dependent manner (0, 0.5, 1, and 24 hr) were subjected to ChIP-seq for defining ERα-bound DEREs. Fusion frequencies of breakpoint sites are plotted in purple and binding intensities of ERα-bound DEREs in blue (untreated) and red (E2-treated). See also Figure S2A–B for whole-genome and individual chromosome maps, respectively. (C) Pie chart summarizing all fusion events in MCF-7 cells based on mate-pair sequencing data. (D) Distribution of DEREs nearby translocation sites in clustered and non-clustered breakpoints. The number of DEREs per 10-kb span is calculated in each direction relative to each breakpoint site. The red and blue lines are the average value of DEREs.
Figure 3
Figure 3. Prolonged Estrogen Exposure Leads to Amplification of DERE Copies
(A) Interphase fluorescence in situ hybridization (FISH) analysis of amplified 20q13 DERE copies in E2-treated (70 nM) MCF-7 cells for different time periods (0, 5, 7, 10, and 25 days). Representative four images in each condition were shown. Inserted squares: clustered DEREs. Quantification of DERE copies per cell was performed by CellSens software and presented in the scatter plot (n=20). A spot with area size over 0.3 µm2 was counted as the clustered DERE region. p<0.001 (two way ANOVA test), compared to “0” group. (B) Quantitative PCR analysis of two amplified DERE copies located in 20q13 (upper) and 17q23 (lower). MCF-7 cells were continuously exposed to E2 (70 nM) and/or ICI 182,780 (100 nM) for different time periods (5, 7, 10, and 25 days) in charcoal-stripped conditions (n=6 replicates in two biological batches of treatment). Mean ± SD. ***, p<0.001 (Student’s t test), compared to “Ctrl” cells. (C) Dose-dependent gains of 20q13 and 17q23 DERE copy in MCF-7 cells exposed to different estrogenic chemicals. MCF-7 cells were cultured in charcoal-stripped conditions and exposed to ethanol (Ctrl), E2 (70 nM), or estrogenic chemicals with 5-fold different dose, including diethylstilbestrol (DES, 14-70-140 nM), bisphenol A (BPA, 0.5-4–20 nM), 4-nonylphenol (NP, 0.2-1–5 µM), daidzein (Dai, 2-10–50 µM), N-butyl-benzyl phthalate (BBP, 2-10-50 µM), di(2-ethylhexyl)-phthalate (DEHP, 2-10–50 µM), 4,4’-dichloro-biphnyl (PCB, 0.02-0.1–0.5 nM), and 1,3,5-tris(4-hydroxyphenyl)- 4-propyl-1H-pyrazole (PPT, 0.02-0.1–0.5 nM), respectively, for 5 days. These treatment doses were selected and modified based on our previous findings (Hsu et al., 2009 and 2010). Genomic DNA from treated cells was collected for quantitative PCR analysis of 17q23 and 20q13 DERE copies. Mean ± SD (n=6 replicates in two biological batches of treatment). ***, p<0.001 (Student’s t test), compared to “Ctrl” cells. (D) Differential copy changes of 20q13 and 17q23 DEREs in normal epithelial cells preexposed to estrogenic chemicals. Experimental scheme of an in vitro exposure system is shown in the upper panel. Floating mammospheres containing breast progenitor cells were preexposed to dimethyl sulfoxide (DMSO as control, Ctrl), E2 (70 nM), or estrogenic chemicals, including DES (70 nM), BPA (4 nM), NP (1 µM), Dai (10µM), BBP (10µM), DEHP (10µM), PCB (0.1 nM), and PPT (0.1 nM), respectively, for 3 weeks. Differentiated epithelial cells were then subjected to quantitative PCR analysis (lower) of 17q23 and 20q13 DERE copies. Mean ± SD (n=6 replicates in two batches of treatment). ***, p<0.001 (Student’s t test), compared to “Ctrl” cells.
Figure 4
Figure 4. Amplification of DERE Copies Preferentially Occurs in ERα-positive Breast Cancers
(A) Quantitative analysis of 17q23 and 20q13 DERE copies in 51 immortalized and breast cancer cell lines (left) and 105 clinical samples, including 94 breast tumors and 11 normal tissues (right). See also Figure S3A–B for copy number of 20q13 and 17q23 DEREs in luminal breast cancer cell lines; Figure S3D–F and Table S9 for association of TP53-involved signaling network in 20q13 DERE amplification. (B) Kaplan-Meier survival curves of ERα-positive breast cancer patients (n=74) harboring either high (n>2) or low copy (n<2) of the 20q13 (left) or 17q23 (middle) or both (right) DEREs. Wilcoxon test was used to determine statistical significance. See also Figure S3C for overall survival curves of ERα-negative breast cancer patients (n=19). (C) PCR analysis of 17q2320q13 fusion fragment in 106 primary breast tumors and 20 normal tissues. Genomic location of interrogated fusion is shown in upper panel. Gel pictures of PCR results from ten representative ER-positive and -negative tumors, respectively, are shown, plus an MCF-7 positive control and H2O negative control. (D) Intensity maps of DERE receptor binding upon different time periods of E2 treatment and DNA methylation. The flanking regions of DERE (centered) from −2.5-Kb to +2.5-Kb were shown. The heat map of DNA methylation in untreated MCF-7 cells was generated using MeDIP-seq data from our previous study (Hsu et al., 2010).
Figure 5
Figure 5. Amplified DERE Copies Regulate Target Genes through Estrogen-induced Chromatin Interactions
(A) Interphase fluorescence in situ hybridization (FISH) analysis of amplified DERE copies in compressed (left and middle) and intact (right) nuclei. (B) Circos plots depict chromatin interactions of two amplified DERE (20q13 and 17q23) with their respective target genes in untreated (Ctrl) and E2-treated MCF-7. (C) Time-course analysis of gene expression synchronously regulated by either 20q13 (upper) or 17q23 (lower) DEREs. Heat maps generated using a published dataset (Cicatiello et al., 2010) show expression patterns of 20q13- or 17q23-interacting genes in response to E2 stimulation. (D) Independent time-course analysis of 46 estrogen-responsive targets regulated by 20q13 DEREs. Total RNA isolated from E2-treated (70 nM) MCF-7 cells at different time-points was subjected to quantitative RT-PCR analysis. Based on the data obtained from two independent sets of experiments, four different patterns of gene expression were identified in E2-treated MCF-7 cells. Data were summarized in a heat map and shown in 46 bar charts with individual genes (see Figure S4A–B). (E) Correlation analysis of DERE copy changes and DERE-regulated target gene expression in ERα-positive breast cancer cell lines (n=16). Expression microarray data of the ICBP cell lines (Heiser et al., 2009) were integrated with experimental copy-number results to interrogate the correlation between DERE amplification and transcriptional regulation. Down- and up-regulated genes were identified from Figure 5C. See also Figure S4C for correlation analysis in ERα-negative breast cancer cell lines (n=30).
Figure 6
Figure 6. Two Representative Examples of Amplified DERE-regulated Target Genes through Long-range Chromatin Interactions
(A) Chromosome conformation capture coupled with quantitative PCR (3C-qPCR) analysis of two target loci, ZIM2 and THRAP1. Cross-linked chromatin from E2-treated MCF-7 and normal epithelial cells was digested with either BamHI or HindIII and then ligated under diluted conditions. DEREs at 20q13 were designated as “baits”, and digested areas of two candidate loci, ZIM2 and THRAP1, were “interrogated fragments”. Ligated DNA was subjected to the 3C-qPCR. Data are shown as relative interaction frequencies compared to those of GAPDH as an internal control. Mean ± SD (n=6). (B) Expression analyses of THRAP1 and ZIM2 in normal breast epithelial cells (HMEC) or cancer cells (MCF-7) in response to E2 (70 nM) determining using quantitative RT-PCR. Cells with or without ESR1 (ERα) knockdown by siRNA were treated with E2 for the indicated times. See also Figure S5 for the effect of siRNA on ESR1 expression. (C) Genomic landscapes of histone modifications and Pol II occupancy on THRAP1 and ZIM2 loci upon estrogen stimulation. A published ChIP-seq data including three histone marks (H3K4me3, H3K9me3, and H3K27me3) and Pol II was used to investigate the occupancy of epigenetic marks on the two genes from −20-Kb upstream region of transcription start sites to transcription termination sites (Joseph et al., 2010). Red bars, increased occupancy; green bars, reduced occupancy. (D) Proposed coordinate model of DERE-modulated chromatin interactions for transcriptional regulation in response to estrogen. In normal cells, DEREs at 20q13 are brought to THRAP1 (at 17q23.2) and ZIM2 (at 19q13.43), respectively, through chromatin movement to repress expression. During tumor progression under continuous estrogen exposure, genomic fusions and amplifications occur in the 20q13 DEREs attributed to prolonged physical contact between DEREs in an unstable cancer genome. The DEREs from 20q13 are replicated and inserted into different chromosomes, leading to increased interaction frequencies between DEREs and the respective gene loci, which profoundly alter their transcriptional regulation.
Figure 7
Figure 7. Amplified DEREs Repress Candidate Tumor Suppressor Expression for ERα-positive Luminal Cancer Proliferation
(A) Determining tumor-suppressor features of two DERE-regulated loci, THRAP1 and ZIM2, in MCF-7 cells. To determine cell proliferation rate, colony formation assays were conducted in cells transiently expressing THRAP1 or ZIM2, respectively, upon E2 stimulation (70 nM) (see also Figure S6 for expression levels of THRAP1 and ZIM2 in MCF-7 transfectants). Colony numbers of two biological replicates scored by three independent researchers are shown (right). (B–C) In silico analysis of THRAP1 and ZIM2 mRNA expression levels in breast cancer subgroups (B) and ERα-positive breast tumors within differential copies of 20q13 and 17q23 DEREs (C) using a published microarray breast cancer cohort (Curtis et al., 2012). A total of 1986 breast tumors with subgroup information were analyzed in (B); 68 ERα-positive breast tumors within amplification of either 17q23 or 20q13 DEREs were applied in the study. (D) Expression levels of THRAP1 and ZIM2 in normal breast epithelia preexposed to estrogenic chemicals as shown in Figure 3D. THRAP1 and ZIM2 expression was determined by RT-qPCR of differentiated epithelial progeny after preexposure to estrogenic chemicals (see exposure scheme in Figure 3D, upper). Mean ± SD (n=6 replicates in two batches of treatment). ***, p<0.001; **, p<0.01; *, p<0.05 (Student’s t test), comparing to “Ctrl” cells.
Figure 8
Figure 8. Expression Signature of DERE-interacting Genes Correlates with Relapse after Tamoxifen Therapy
(A–B) In silico analysis of DERE-regulated genes in an ERα-positive breast tumor cohort is associated with relapse. A breast cancer cohort including a total of 298 patients with ERα-positive breast tumors and 5-year tamoxifen treatment was used to study the clinical significance of DERE-regulated genes (Symmans 2010). Forty down-regulated (A) and twenty-seven up-regulated (B) genes were significantly associated with relapse after tamoxifen treatment (p<0.0001) (see also Figure S7A–B for validation analysis using another independent cohort within endocrine therapy history). (C–D) Expression analysis of 26 DERE-interacting genes Involved in tamoxifen resistance. Quantitative RT-PCR analysis was performed on MCF-7 and BT474 cells treated with E2 (70 nM) alone/and ERα antagonist- ICI 182,780 (ICI, 1 µM) in five time periods (0, 0.5, 1, 4, and 24 hr). Expression data were shown in 26 bar charts with individual genes (see also Figure S7C–D). Mean ± SD (n=6 replicates in two biological batches). (C) Down-regulated genes; (D) Up-regulated genes. (E) Signaling pathways associated with DERE-regulated genes in tamoxifen resistance. Ingenuity Pathway Analysis was used to determine signaling pathways associated with down- and up-regulated genes (identified from A and B) in tamoxifen resistance. Mean ± SD (n=6 replicates in two batches of treatment). ***, p<0.001; **, p<0.01; *, p<0.05 (Student’s t test), comparing to control cells (time point “0 hr”).

References

    1. Andersen CL, Monni O, Wagner U, Kononen J, Barlund M, Bucher C, Haas P, Nocito A, Bissig H, Sauter G, et al. High-throughput copy number analysis of 17q23 in 3520 tissue specimens by fluorescence in situ hybridization to tissue microarrays. Am. J. Pathol. 2002;161:73–79. - PMC - PubMed
    1. Albertson DG. Gene amplification in cancer. Trends Genet. 2006;22:447–455. - PubMed
    1. Almstrup K, Fernandez MF, Petersen JH, Olea N, Skakkebaek NE, Leffers H. Dual effects of phytoestrogens result in u-shaped dose-response curves. Environ. Health Persepct. 2002;110:743–748. - PMC - PubMed
    1. Berger MF, Lawrence MS, Demichelis F, Drier Y, Cibulskis K, Sivachenko AY, Sboner A, Esqueva R, Pflueger D, Sougnez C, et al. The genomic complexity of primary human prostate cancer. Nature. 2011;470:214–220. - PMC - PubMed
    1. Biankin AV, Waddell N, Kassahn KS, Gingras MC, Muthuswamy LB, Johns AL, Miller DK, Wilson PJ, Patch AM, Wu J, et al. Pancreastic cancer genomes reveal aberrations in axon guidance pathway genes. Nature. 2012;491:399–405. - PMC - PubMed

Publication types