Comparative Study
. 2013 Oct 12;113(9):1054-64.
doi: 10.1161/CIRCRESAHA.113.302052. Epub 2013 Aug 15.

Altered expression of Raet1e, a major histocompatibility complex class 1-like molecule, underlies the atherosclerosis modifier locus Ath11 10b

Affiliations
Comparative Study

Altered expression of Raet1e, a major histocompatibility complex class 1-like molecule, underlies the atherosclerosis modifier locus Ath11 10b

José M Rodríguez et al. Circ Res. .

Abstract

Rationale: Quantitative trait locus mapping of an intercross between C57.Apoe⁻/⁻ and FVB.Apoe⁻/⁻ mice revealed an atherosclerosis locus controlling aortic root lesion area on proximal chromosome 10, Ath11. In a previous work, subcongenic analysis showed Ath11 to be complex with proximal (10a) and distal (10b) regions.

Objective: To identify the causative genetic variation underlying the atherosclerosis modifier locus Ath11 10b.

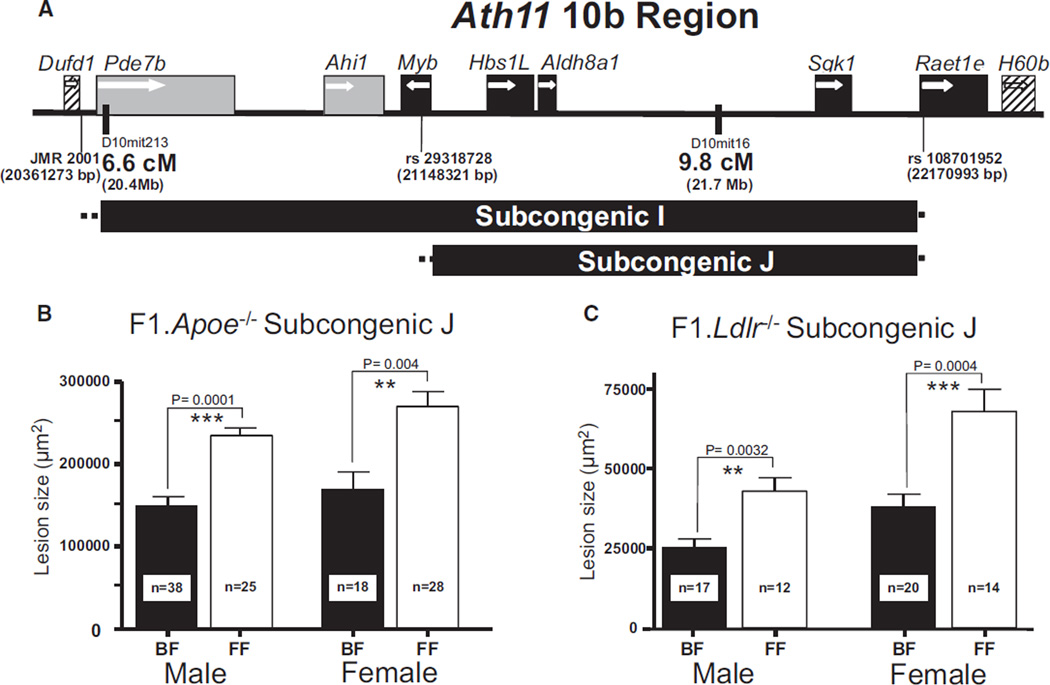
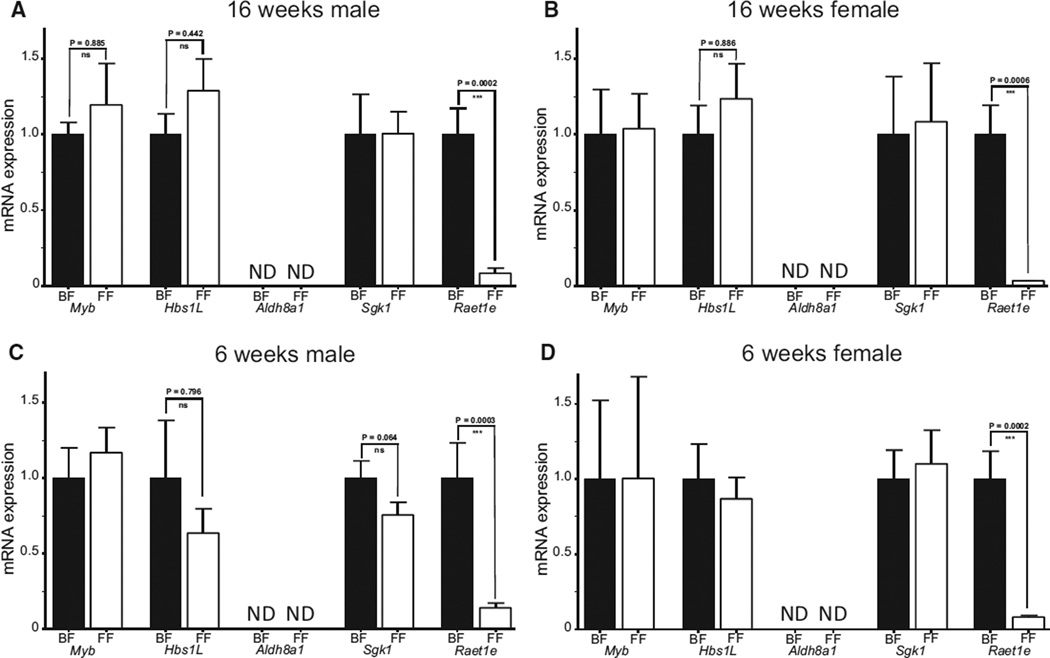
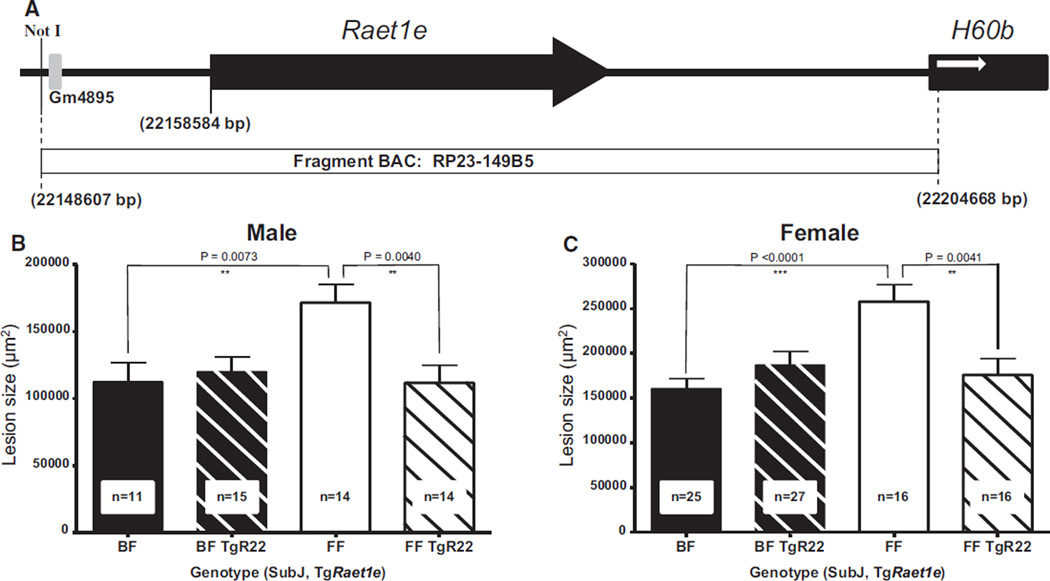
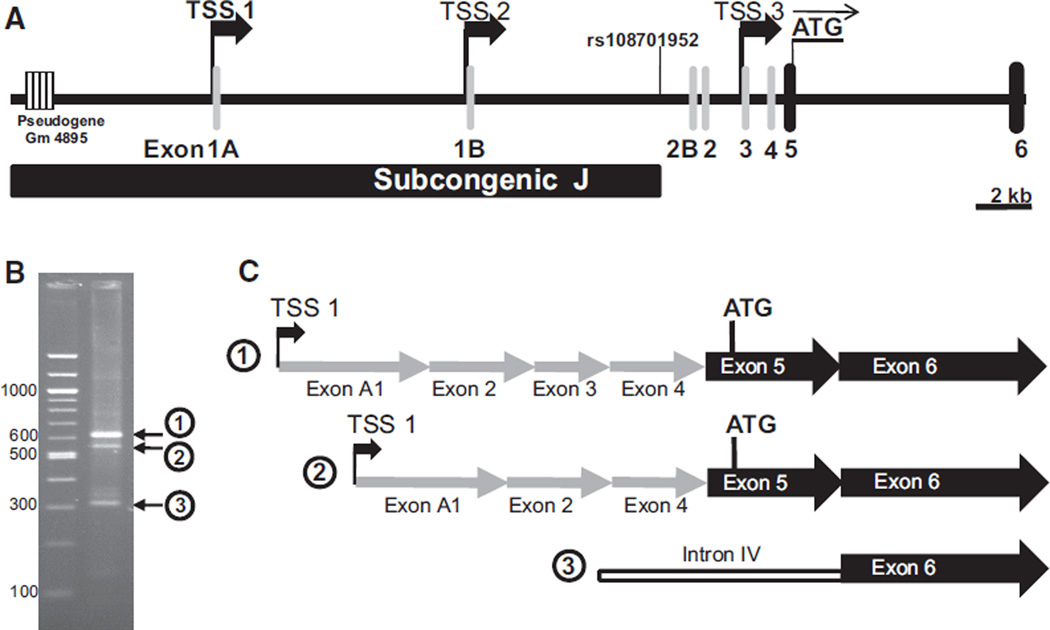
Methods and results: We now report subcongenic J, which narrows the 10b region to 5 genes, Myb, Hbs1L, Aldh8a1, Sgk1, and Raet1e. Sequence analysis of these genes revealed no amino acid coding differences between the parental strains. However, comparing aortic expression of these genes between F1.Apoe⁻/⁻ Chr10SubJ((B/F)) and F1.Apoe⁻/⁻ Chr10SubJ((F/F)) uncovered a consistent difference only for Raet1e, with decreased, virtually background, expression associated with increased atherosclerosis in the latter. The key role of Raet1e was confirmed by showing that transgene-induced aortic overexpression of Raet1e in F1.Apoe⁻/⁻ Chr10SubJ((F/F)) mice decreased atherosclerosis. Promoter reporter constructs comparing C57 and FVB sequences identified an FVB mutation in the core of the major aortic transcription start site abrogating activity.

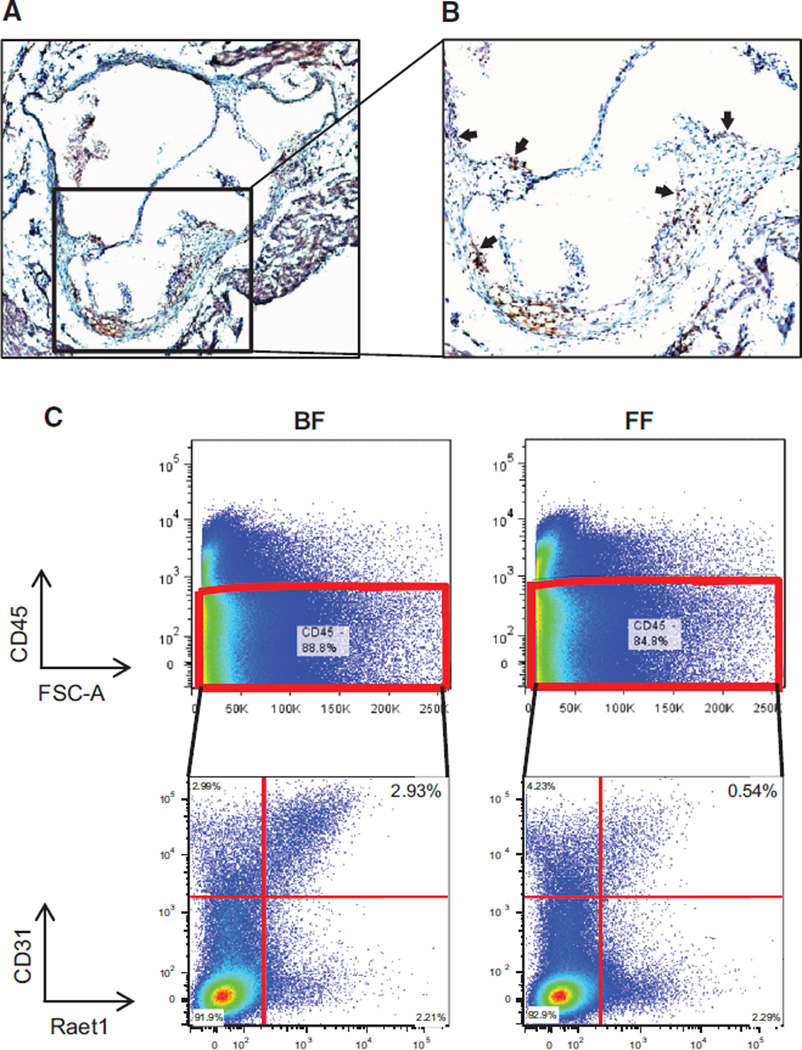
Conclusions: This nonbiased approach has revealed Raet1e, a major histocompatibility complex class 1-like molecule expressed in lesional aortic endothelial cells and macrophage-rich regions, as a novel atherosclerosis gene and represents one of the few successes of the quantitative trait locus strategy in complex diseases.

Keywords: atherosclerosis; gene expression; genetic susceptibility; mice; mouse model; quantitative trait loci.


Figures

Figure 1
Figure 1. Subcongenic J narrows the Ath11 10b region
A, Schematic illustration of the subcongenic strains I and J. The horizontal bar indicates the extent of the genomic interval for each subcongenic strain. The dotted lines at either side of the bar indicate the region in which the recombination occurred. Black boxes indicate genes contained in subcongenic J. Gray boxes denote genes contained in subcongenic I but not subcongenic J. Diagonally striped boxes indicate genes outside both subcongenics. White arrows indicate the transcriptional orientation of the genes, and coordinates are based on genome assembly GRCm38. B, Atherosclerotic lesion area of 16-week-old F1.Apoe−/− Chr10SubJ(B/F) (BF; black column) vs F1.Apoe−/− Chr10SubJ(F/F) (FF; white column) male and female mice. C, Atherosclerotic lesion area of 16-week-old F1.Ldlr−/− Chr10SubJ(B/F) (BF; black column) vs F1.Ldlr−/− Chr10SubJ(F/F) (FF; white column) male and female mice. The numbers of mice studied with each genotype are indicated at the bottom of their respective columns.
Figure 2
Figure 2. Aortic expression of Ath11 10b region genes
Aortic expression of subcongenic J genes (Myb, Hbs1L, Aldh8a1, Sgk1, and Raet1e) in 16-week-old F1.Apoe−/− Chr10SubJ(B/F) (BF; black column) vs F1.Apoe−/− Chr10SubJ(F/F) (FF; white column) male (A) and female (B) mice and in prelesional 6-week-old F1.Apoe−/− Chr10SubJ(B/F) (BF; black column) vs F1.Apoe−/− Chr10SubJ(F/F) (FF; white column) male (C) and female (D) mice. There were 14 mice per group, and the expression of each gene was normalized to the level in F1.Apoe−/− Chr10SubJ(B/F) (BF) mice. ND indicates not detected.
Figure 3
Figure 3. Raet1 protein expression in aorta
A, The ×40 and (B) ×100 sections of aortic root from 16-week-old F1.Apoe−/− Chr10SubJ(B/F) mice immunostained with antibody to Raet1. Brown–red areas indicate regions of Raet1 protein expression (see arrows). C, Fluorescence-activated cell sorting (FACS) analysis of Raet1 expression in aortic endothelial cells. Aortic cell suspensions from 16-week-old F1.Apoe−/− Chr10SubJ(B/F) (BF; left) and F1.Apoe−/− Chr10SubJ(F/F) (FF; right) mice were subjected to FACS analysis. Top, Separation of CD45-positive cells and CD45-negative cells. The latter were analyzed for the presence of CD31 and Raet1, and the results are shown at the bottom. The results shown are representative of ≥3 experiments.
Figure 4
Figure 4. Creation of BAC-Raet1e transgenic mice and assessment of atherosclerosis
A, Not I fragment of C57 BAC RP23-149B5 containing only the Raet1e gene microinjected into FVB oocytes to obtain Raet1e transgenic mice. The black arrow indicates the extent and orientation of the Raet1e gene, the gray box indicates a pseudogene, the black box indicates the neighboring H60b gene not contained in the BAC, and the white arrow indicates its orientation. The coordinates given are based on genome assembly GRCm38. B and C, Effect of BAC-Raet1e transgene–driven overexpression of Raet1e on atherosclerosis. Atherosclerotic lesion area of F1.Apoe−/− Chr10SubJ(B/F) (BF; black column), F1.Apoe−/− Chr10SubJ(B/F) TgRaet1e22 (BF TgR22; diagonally striped black column), F1.Apoe−/− Chr10SubJ(F/F) (FF; white column), and F1.Apoe−/− Chr10SubJ(F/F) TgRaet1e22 (FF TgR22; diagonally striped white column) male (B) and female (C) mice. The numbers of mice studied with each genotype are indicated at the bottom of their respective columns.
Figure 5
Figure 5. Identification of the Raet1e aortic promoter by rapid amplification of 5′ end of cDNA (5′RACE)
A, Promoter, 5′-untranslated region (UTR) and the beginning of the translated region of the Raet1e gene. The black bar indicates the distal end of subcongenic J delimited by the single nucleotide polymorphism rs108701952, the gray columns indicate 5′-UTR exons, the black columns indicate translated exons, the thick black arrows indicate potential transcription start sites (TSS) determined based on the expression sequence tag (EST) database, the thin black arrow indicates the translation initiation ATG codon, and the striped box indicates a pseudogene. The coordinates given are based on genome assembly GRCm38. B, Agarose gel electrophoresis of size markers (left lane) and products of the aortic Raet1e 5′RACE (right lane). The circled numbers indicate the 3 major DNA products, which were isolated and sequenced to determine the TSS. C, Sequence comparison of the 3 major aortic Raet1e 5′RACE products. The gray arrows indicate 5′-UTR exons, the black arrows indicate translated exons, and the white bar indicates an intron. Aortic Raet1e transcripts 1 and 2 begin at TSS1 but differ by the absence of exon 3 in the latter. Aortic Raet1e transcript 3 begins in the middle of the intron IV and is likely an experimental artifact.
Figure 6
Figure 6. Analysis of functional differences in the Raet1e promoter between C57 and FVB
Based on the results shown in Online Figure XIII, it seems that the major difference in the aortic expression of Raet1e is determined by sequence differences between C57 and FVB in the promoter D fragment. A, Top, Locations of sequence differences between C57 and FVB in the promoter D fragment. Below are the different forms of promoter D analyzed. The black bars indicate C57 sequence, the white bars indicate FVB sequence, and the vertical lines indicate sequence variations introduced by site-directed mutagenesis. The horizontal bar graph indicates the ratio of luciferase/renilla activity for each promoter construct. The black bar indicates the activity of a construct with only C57 sequence, the white bar indicates the activity of a construct with only FVB sequence, and the gray bars designate the activity of modified forms of the Raet1e promoter D. The activity ratio of luciferase/renilla is given as mean±SEM. B, Chromatographic representation of the sequence difference between C57 and FVB in the region of the culprit single nucleotide polymorphism (SNP) rs50817078 (arrow). C, SNP rs50817078 (JMRv10073) localizes to the core of the aortic Raet1e TSS1 based on the sequence obtained for transcript number 1 in Figure 5.

Comment in

Similar articles

Cited by

References

    1. Go AS, Mozaffarian D, Roger VL, et al. Heart disease and stroke statistics— 2013 update: a report from the American Heart Association. Circulation. 2013;127:e6–e245. - PMC - PubMed
    1. Libby P, Ridker PM, Hansson GK. Progress and challenges in translating the biology of atherosclerosis. Nature. 2011;473:317–325. - PubMed
    1. Lusis AJ. Genetics of atherosclerosis. Trends Genet. 2012;28:267–275. - PMC - PubMed
    1. Welch CL. Beyond genome-wide association studies: the usefulness of mouse genetics in understanding the complex etiology of atherosclerosis. Arterioscler Thromb Vasc Biol. 2012;32:207–215. - PMC - PubMed
    1. Getz GS, Reardon CA. Animal models of atherosclerosis. Arterioscler Thromb Vasc Biol. 2012;32:1104–1115. - PMC - PubMed

Publication types

MeSH terms