. 2013 Nov;24(11):1901-12.
doi: 10.1681/ASN.2013020126. Epub 2013 Oct 10.

Metabolomics reveals signature of mitochondrial dysfunction in diabetic kidney disease

Affiliations

Metabolomics reveals signature of mitochondrial dysfunction in diabetic kidney disease

Kumar Sharma et al. J Am Soc Nephrol. 2013 Nov.

Abstract

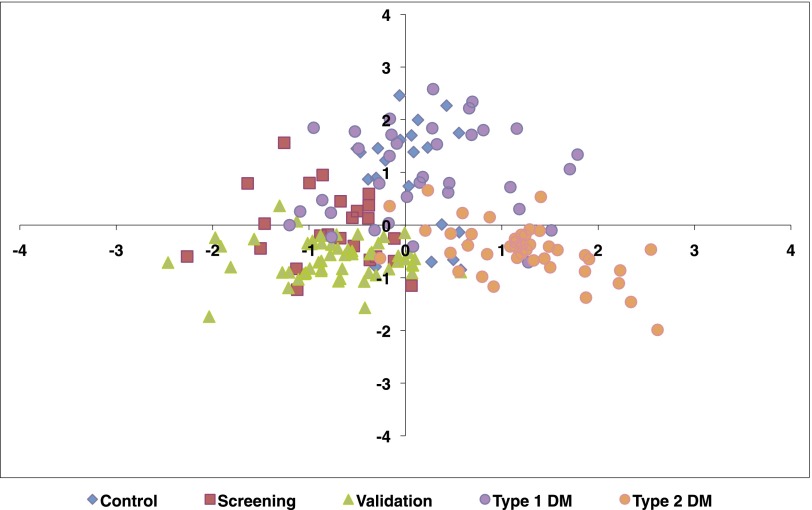
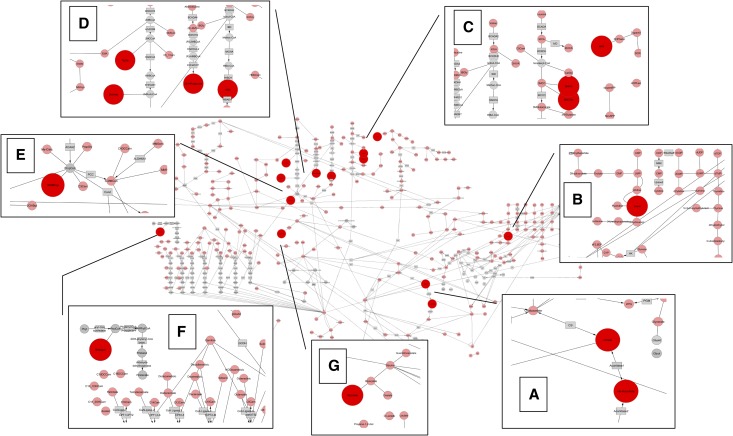
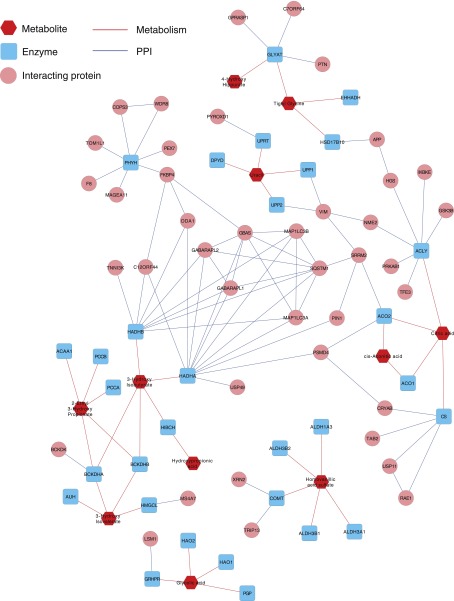
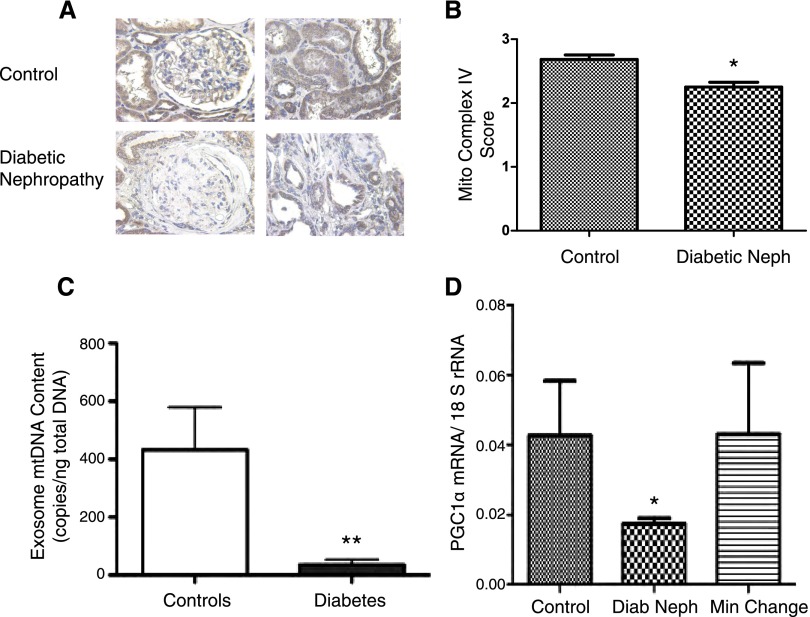
Diabetic kidney disease is the leading cause of ESRD, but few biomarkers of diabetic kidney disease are available. This study used gas chromatography-mass spectrometry to quantify 94 urine metabolites in screening and validation cohorts of patients with diabetes mellitus (DM) and CKD(DM+CKD), in patients with DM without CKD (DM-CKD), and in healthy controls. Compared with levels in healthy controls, 13 metabolites were significantly reduced in the DM+CKD cohorts (P≤0.001), and 12 of the 13 remained significant when compared with the DM-CKD cohort. Many of the differentially expressed metabolites were water-soluble organic anions. Notably, organic anion transporter-1 (OAT1) knockout mice expressed a similar pattern of reduced levels of urinary organic acids, and human kidney tissue from patients with diabetic nephropathy demonstrated lower gene expression of OAT1 and OAT3. Analysis of bioinformatics data indicated that 12 of the 13 differentially expressed metabolites are linked to mitochondrial metabolism and suggested global suppression of mitochondrial activity in diabetic kidney disease. Supporting this analysis, human diabetic kidney sections expressed less mitochondrial protein, urine exosomes from patients with diabetes and CKD had less mitochondrial DNA, and kidney tissues from patients with diabetic kidney disease had lower gene expression of PGC1α (a master regulator of mitochondrial biogenesis). We conclude that urine metabolomics is a reliable source for biomarkers of diabetic complications, and our data suggest that renal organic ion transport and mitochondrial function are dysregulated in diabetic kidney disease.


Figures

Figure 1.
Figure 1.
Principal components analysis reveals separation of diabetic CKD from healthy controls and diabetes without CKD. The figure shows the plot of principal component 1 (x-axis) versus principal component 2 (y-axis). Blue diamonds represent the control group, red squares represent the screening group, green triangles represent the validation group, purple circles represent the type 1 diabetes group without CKD, and orange circles represent the type 2 diabetes group without CKD.
Figure 2.
Figure 2.
Biochemical pathway analysis reveals prominent role of Krebs cycle and amino acid metabolites in urine signature of diabetic kidney disease. Pink nodes represent chemicals that are measured, and large red nodes represent metabolites that are altered in diabetic renal disease. Gray nodes represent compounds that are not measured and gray rectangles represent enzymes. Compounds whose concentrations are significantly altered are shown in the magnified inserts, falling in the following areas of metabolism: (A) Krebs cycle (citrate, aconitate). (B) Pyrimidine metabolism (uridine). (C) Leucine catabolism (3-hydroxyisovaleric acid [3HIVA], 3-methylcrotonylglycine [3MCGly]) and tyrosine metabolism (vanillylmandelic acid [VMA]). (D) Valine catabolism (3-hydroxyisobutyric acid [HIBA]) and the isoleucine catabolism L-pathway (tiglylglycine [TigGly], 2-methylacetoacetic acid [2MAcAc]) and R-pathway (2-ethyl-3-hydroxypropionate [2E3Hpropionate]). (E) Propionate metabolism (3-hydroxypropionate [3OHProp]). (F) Branched-chain fatty acid metabolism (3-methyladipic acid [3MAdipic]). (G) Oxalate metabolism (glycolic acid).
Figure 3.
Figure 3.
Network analysis of metabolites with enzymes reveals connectivity of 11/13 metabolites in large network. Proteins that interact with these enzymes are also shown (i.e., first neighbors of the enzymes on protein-protein interaction [PPI] network). The map was drawn using Cytoscape.
Figure 4.
Figure 4.
Mitochondrial biogenesis reduced in diabetic nephropathy. (A) Representative immunostaining of cytochrome C oxidase (complex IV) subunit II staining in normal and diabetic kidney (original magnification ×40). (B) Semi-quantitative analysis (n=5 per group; P<0.05). (C) Copy number of exosome-protected, deoxyribonuclease I–resistant mtDNA in urinary exosomes from patients with diabetic kidney disease (diabetes) versus healthy controls (controls) (controls, 432±147 copies/ng; diabetes, 36±18 copies/ng; P≤0.01; n=16 per group). (D) Gene expression of PGC1α from samples from patients who underwent pretransplant biopsies (controls, n=8), patients with diabetic nephropathy (diab neph, n=14), and patients with minimal-change disease (min change, n=6).

References

    1. Rosolowsky ET, Skupien J, Smiles AM, Niewczas M, Roshan B, Stanton R, Eckfeldt JH, Warram JH, Krolewski AS: Risk for ESRD in type 1 diabetes remains high despite renoprotection. J Am Soc Nephrol 22: 545–553, 2011 - PMC - PubMed
    1. Groop PH, Thomas MC, Moran JL, Wadèn J, Thorn LM, Mäkinen VP, Rosengård-Bärlund M, Saraheimo M, Hietala K, Heikkilä O, Forsblom C, FinnDiane Study Group : The presence and severity of chronic kidney disease predicts all-cause mortality in type 1 diabetes. Diabetes 58: 1651–1658, 2009 - PMC - PubMed
    1. Susztak K, Böttinger E, Novetsky A, Liang D, Zhu Y, Ciccone E, Wu D, Dunn S, McCue P, Sharma K: Molecular profiling of diabetic mouse kidney reveals novel genes linked to glomerular disease. Diabetes 53: 784–794, 2004 - PubMed
    1. Ewens KG, George RA, Sharma K, Ziyadeh FN, Spielman RS: Assessment of 115 candidate genes for diabetic nephropathy by transmission/disequilibrium test. Diabetes 54: 3305–3318, 2005 - PubMed
    1. Sharma K, Lee S, Han S, Lee S, Francos B, McCue P, Wassell R, Shaw MA, RamachandraRao SP: Two-dimensional fluorescence difference gel electrophoresis analysis of the urine proteome in human diabetic nephropathy. Proteomics 5: 2648–2655, 2005 - PubMed

Publication types

Substances