

Inferring gene expression from ribosomal promoter sequences, a crowdsourcing approach
- PMID: 23950146
- PMCID: PMC3814892
- DOI: 10.1101/gr.157420.113
Inferring gene expression from ribosomal promoter sequences, a crowdsourcing approach
Abstract
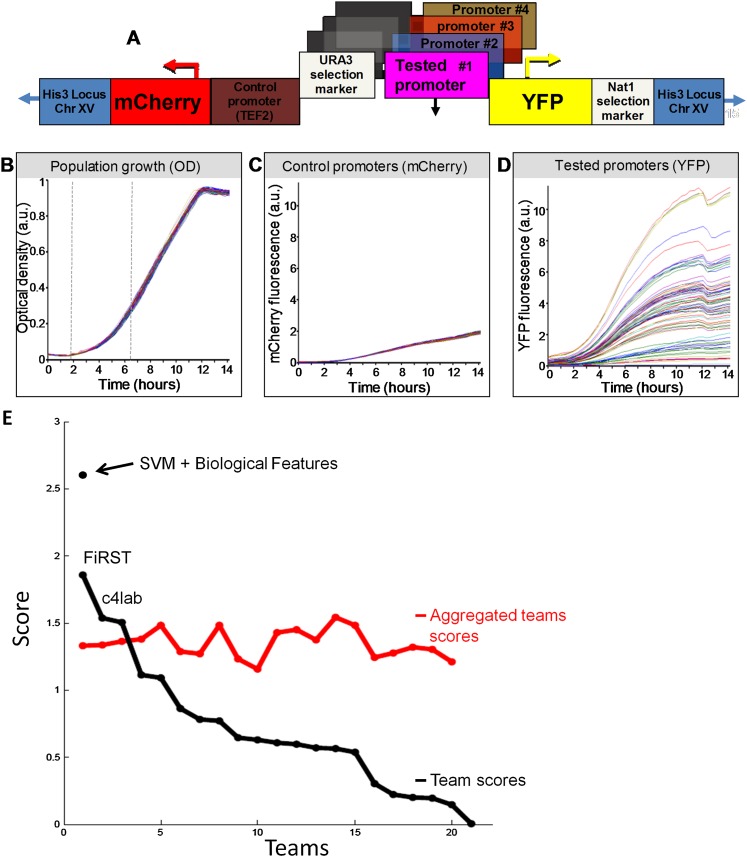
The Gene Promoter Expression Prediction challenge consisted of predicting gene expression from promoter sequences in a previously unknown experimentally generated data set. The challenge was presented to the community in the framework of the sixth Dialogue for Reverse Engineering Assessments and Methods (DREAM6), a community effort to evaluate the status of systems biology modeling methodologies. Nucleotide-specific promoter activity was obtained by measuring fluorescence from promoter sequences fused upstream of a gene for yellow fluorescence protein and inserted in the same genomic site of yeast Saccharomyces cerevisiae. Twenty-one teams submitted results predicting the expression levels of 53 different promoters from yeast ribosomal protein genes. Analysis of participant predictions shows that accurate values for low-expressed and mutated promoters were difficult to obtain, although in the latter case, only when the mutation induced a large change in promoter activity compared to the wild-type sequence. As in previous DREAM challenges, we found that aggregation of participant predictions provided robust results, but did not fare better than the three best algorithms. Finally, this study not only provides a benchmark for the assessment of methods predicting activity of a specific set of promoters from their sequence, but it also shows that the top performing algorithm, which used machine-learning approaches, can be improved by the addition of biological features such as transcription factor binding sites.
Figures
 , where
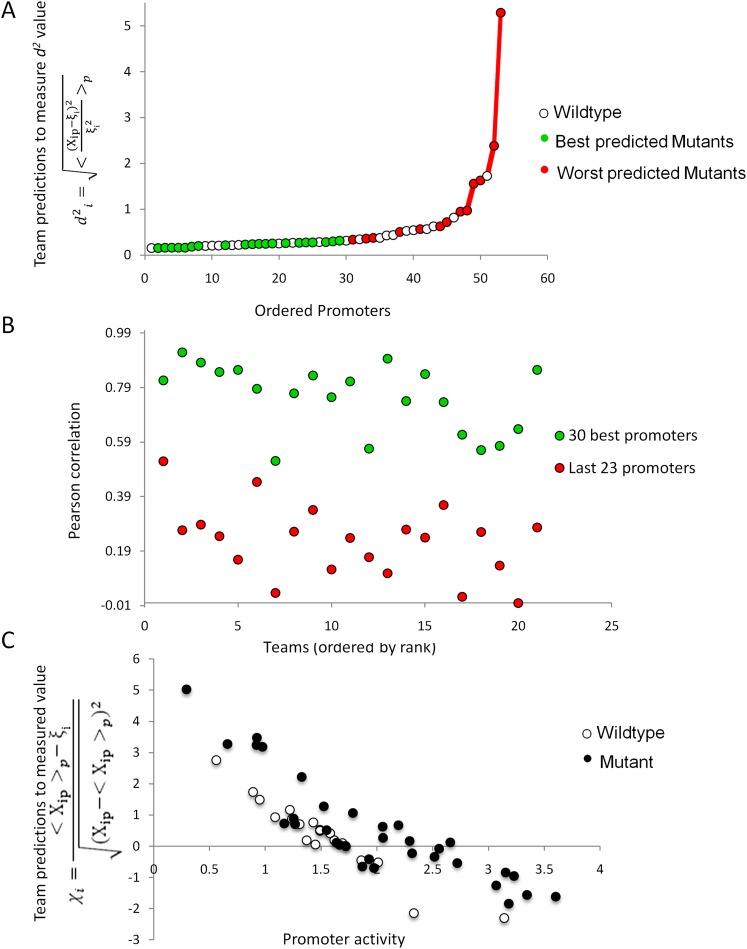
  is the predicted value of promoter i and participant p = 1,2…21 , and
  is the measured value for promoter i = 1,2…53. Green dots represent the 30 best predictions, and red dots the 23 worst predictions. Empty dots represent the 20 wild-type promoters; full dots represent the 33 mutated promoters. (B) The Pearson correlation of each of the participating teams is shown in green dots for the best predictions and in red dots for the worst predictions as defined in A. Teams are ordered by rank based on their final score. (C) For each promoter, χi is plotted in logarithmic scale against the promoter activity value. Empty dots represent wild-type promoters and full dots mutant promoters.
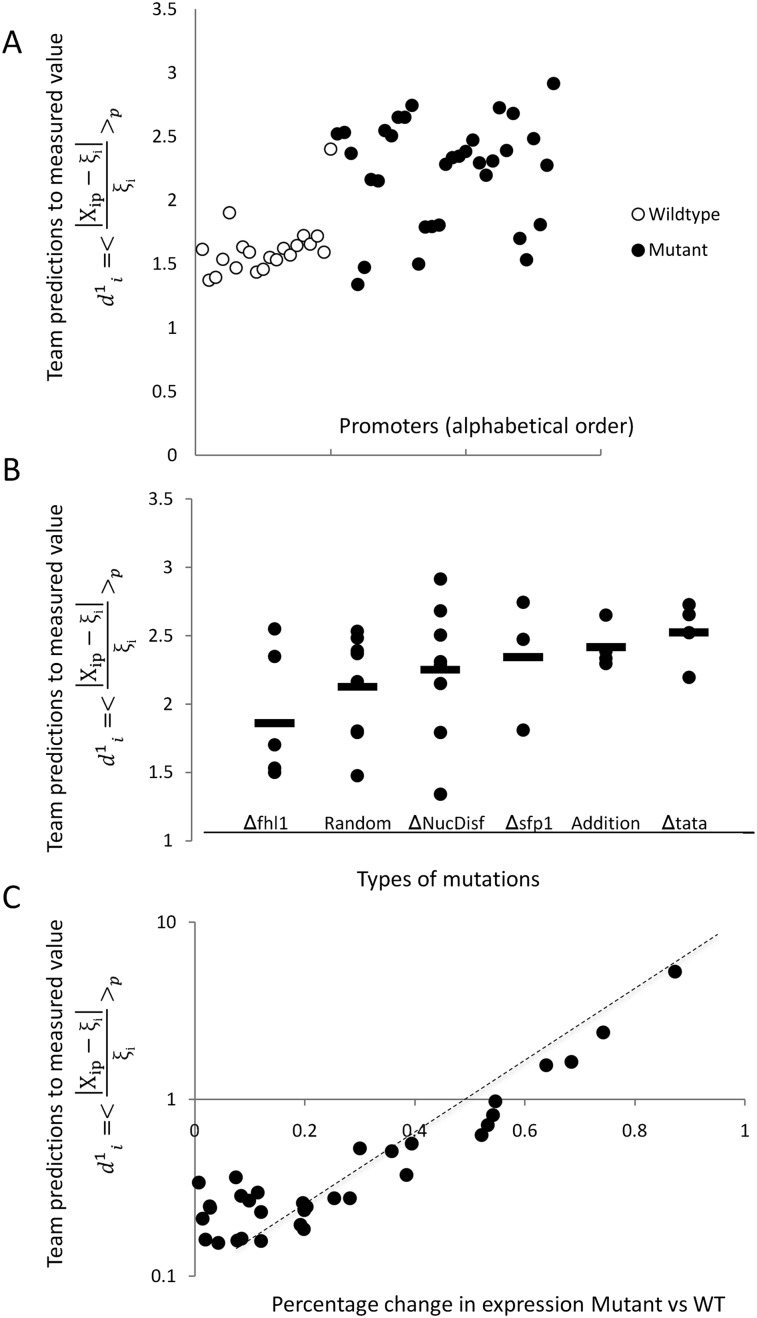
 , where
  is the predicted value of promoter i and participant p = 1,2…21, and
  is the measured value for promoter i = 1,2…53. (B) Mutant promoter expression values were grouped according to the nature of the mutation and ordered by mean
  value for each group. The six groups consist of mutations of TATA boxes (Δtata), of binding sites for Fhl1 (Δfhl1) and Sfp1 (Δsfp1), mutations to nucleosome disfavoring sequences (ΔNucDisf), random mutations (Random), and finally, sequences mutated intentionally with additional random mutations (Addition). The
  value for each promoter is indicated by full dots; the mean value of
  for each of the six grouped mutations is indicated by a thick bar. (C) For each mutated promoter i,
  is plotted as a function of the percentage of expression value change induced in the wild-type promoter by the mutation. The vertical scale is logarithmic.
References
-
- Basehoar AD, Zanton SJ, Pugh BF 2004. Identification and distinct regulation of yeast TATA box-containing genes. Cell 116: 699–709 - PubMed
-
- Beer MA, Tavazoie S 2004. Predicting gene expression from sequence. Cell 117: 185–198 - PubMed
-
- Gietz RD, Schiestl RH 2007. Microtiter plate transformation using the LiAc/SS carrier DNA/PEG method. Nat Protoc 2: 5–8 - PubMed
MeSH terms
Substances
Grants and funding
LinkOut - more resources
Full Text Sources
Other Literature Sources
Molecular Biology Databases
Research Materials