. 2013 Oct;163(2):815-29.
doi: 10.1104/pp.113.221937. Epub 2013 Aug 15.

Effect of temperature on photosynthesis and growth in marine Synechococcus spp

Affiliations

Effect of temperature on photosynthesis and growth in marine Synechococcus spp

Katherine R M Mackey et al. Plant Physiol. 2013 Oct.

Abstract

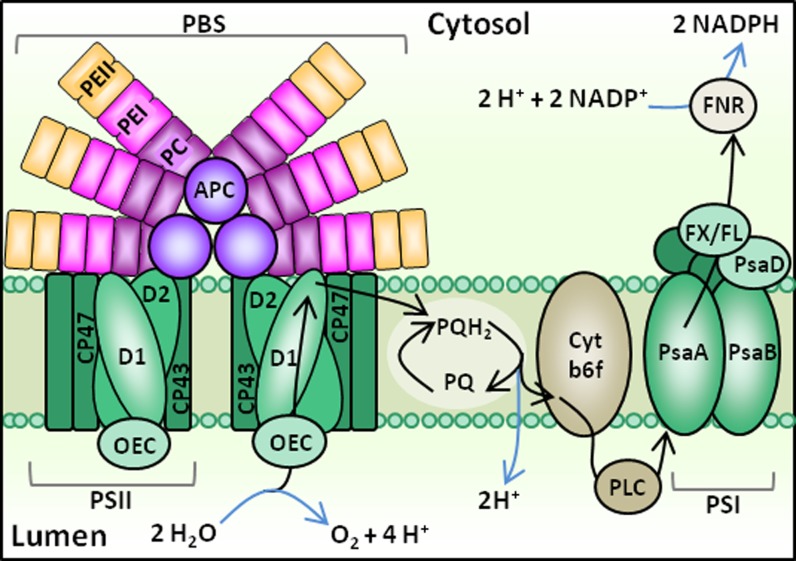
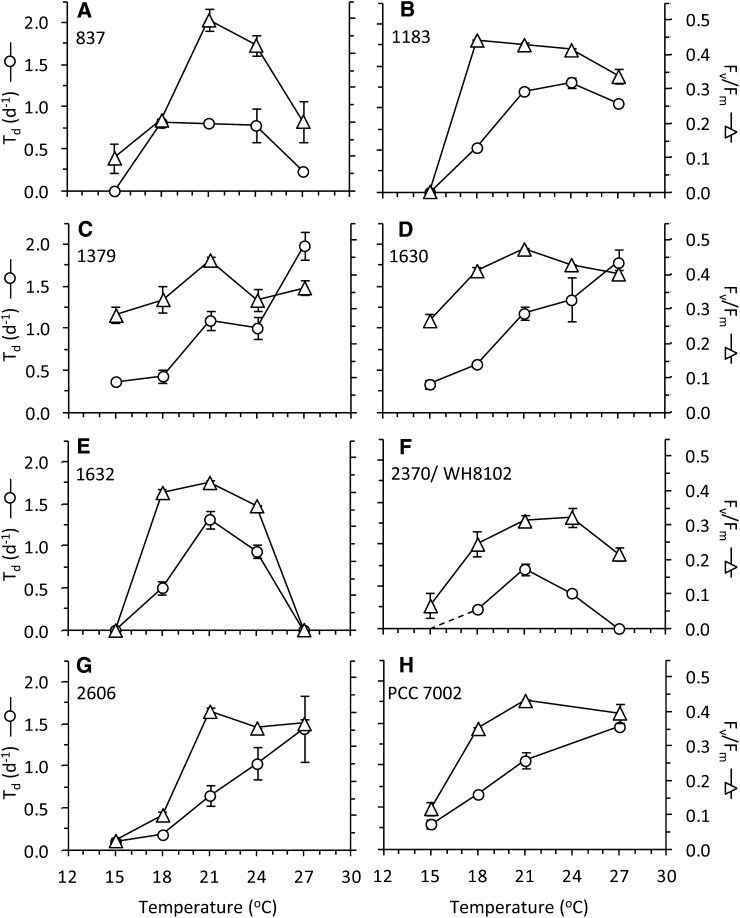
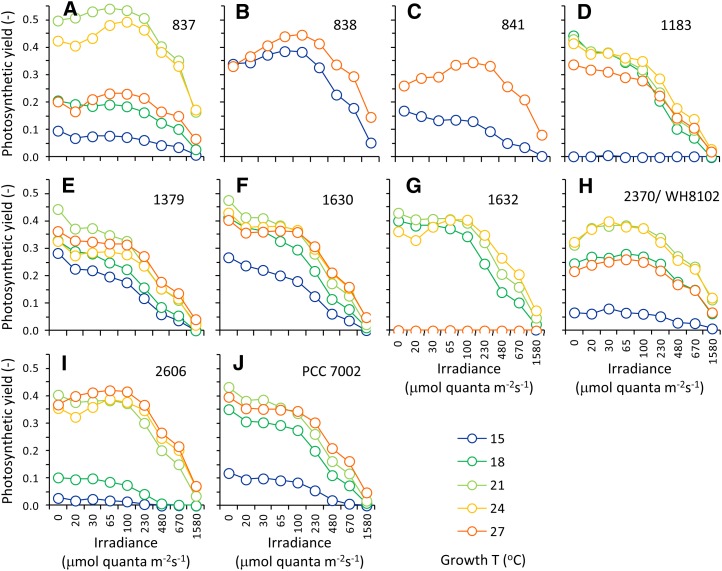
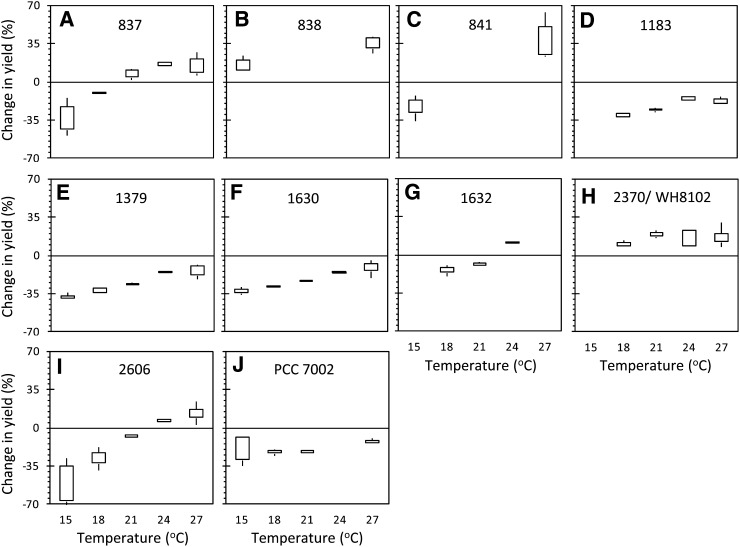
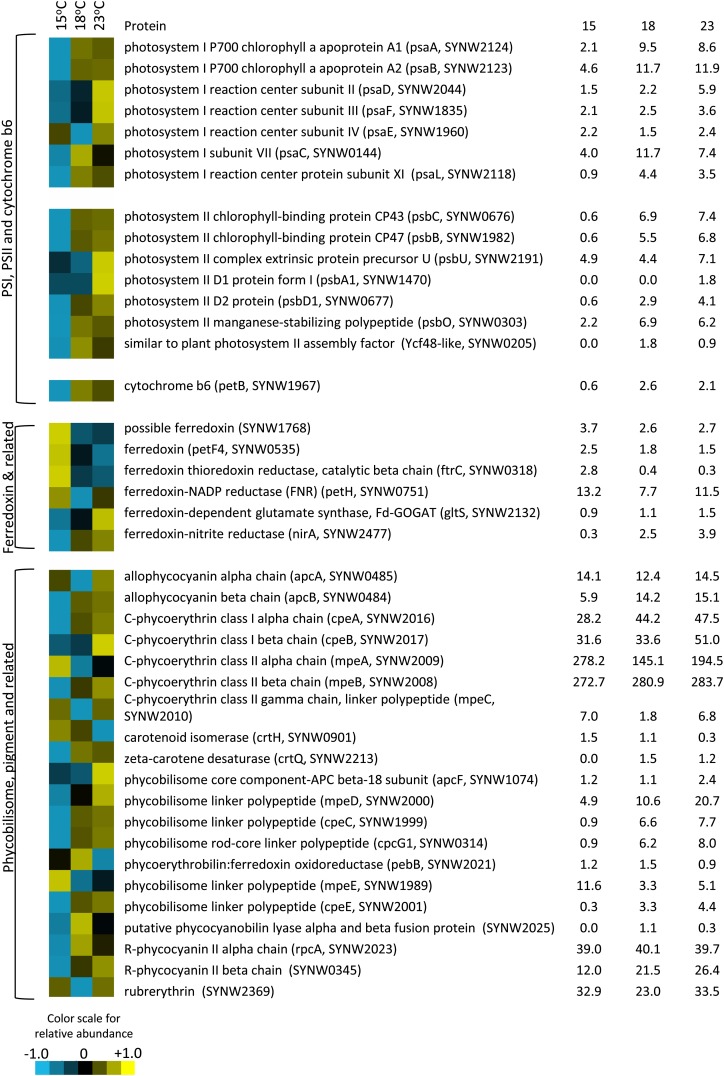
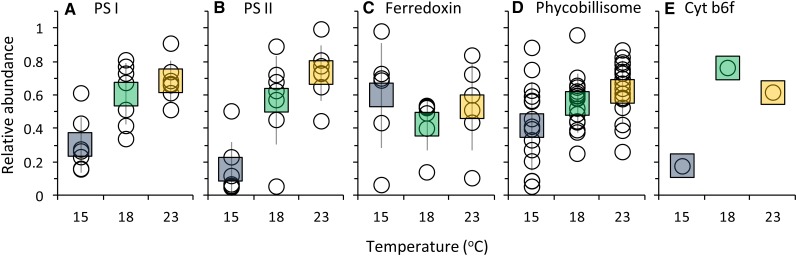
In this study, we develop a mechanistic understanding of how temperature affects growth and photosynthesis in 10 geographically and physiologically diverse strains of Synechococcus spp. We found that Synechococcus spp. are able to regulate photochemistry over a range of temperatures by using state transitions and altering the abundance of photosynthetic proteins. These strategies minimize photosystem II (PSII) photodamage by keeping the photosynthetic electron transport chain (ETC), and hence PSII reaction centers, more oxidized. At temperatures that approach the optimal growth temperature of each strain when cellular demand for reduced nicotinamide adenine dinucleotide phosphate (NADPH) is greatest, the phycobilisome (PBS) antenna associates with PSII, increasing the flux of electrons into the ETC. By contrast, under low temperature, when slow growth lowers the demand for NADPH and linear ETC declines, the PBS associates with photosystem I. This favors oxidation of PSII and potential increase in cyclic electron flow. For Synechococcus sp. WH8102, growth at higher temperatures led to an increase in the abundance of PBS pigment proteins, as well as higher abundance of subunits of the PSII, photosystem I, and cytochrome b6f complexes. This would allow cells to increase photosynthetic electron flux to meet the metabolic requirement for NADPH during rapid growth. These PBS-based temperature acclimation strategies may underlie the larger geographic range of this group relative to Prochlorococcus spp., which lack a PBS.


Figures

Figure 1.
Figure 1.
PBS structure and linear photosynthetic electron flow in cyanobacteria. In this schematic, the PBS is in “state 1,” indicating it is associated with a PSII dimer. Photosynthetic electron flow pathways are indicated by black arrows, and chemical reactions are indicated by blue arrows. Major ETC components include PSII, PSI, PQ/plastoquinol (PQH2), cytochrome b6f (Cyt b6f), plastocyanin (PLC), ferredoxin (FX), flavodoxin (FL), and ferredoxin/flavodoxin NADP reductase (FNR). Other proteins depicted include the phycobiliproteins APC, PC, two forms of PE (PE I and PE II), PSII chlorophyll-binding proteins CP47 and CP43, the PSII core polypeptides D1 and D2, the PSI chlorophyll-binding core proteins PsaA and PsaB, and the PSI reaction center subunit PsaD. [See online article for color version of this figure.]
Figure 2.
Figure 2.
Map of strain origins. Exact latitude and longitude are given in Table I. (CCMP2370 and WH8102 are strain synonyms.)
Figure 3.
Figure 3.
Example fluorescence traces showing PSII fluorescence for strain CCMP841 at 27°C (A) and 15°C (B). Actinic irradiances are indicated in the rectangles below each trace, and exposure to each irradiance lasted 60 s. A saturating pulse 800 ms in duration was used to temporarily close all PSII reaction centers and eliminate photochemical quenching such that maximum fluorescence levels at each irradiance could be determined. The dark-adapted steady-state fluorescence (Fo), the fluorescence level following a saturating flash in the dark with no actinic light (Fm), the steady state fluorescence at a given actinic intensity (Fs), and the fluorescence level following a saturating flash in the presence of background actinic light (Fm′) are also labeled. Each actinic irradiance level has its own unique value of Fs and Fm′, but only the values for the actinic irradiance level of 100 μmol quanta m–2 s–1 are labeled in the figure. A strong state transition is apparent at 27°C for this strain at all actinic irradiances and can be identified from the higher Fm′ values as compared with the Fm value. This indicates movement of the PBS from PSI in the dark to PSII in the light, causing increased PSII fluorescence. The effect is much less pronounced for cells grown at 15°C, where Fm and Fm′ levels are more similar.
Figure 4.
Figure 4.
Annual cycle of SST for each strain’s site of origin. The black line shows average temperature for each week, gray lines show minimum and maximum values for each week over the entire period of record, and error bars show sd for weekly mean SST values over the period January 1990 to December 2011.
Figure 5.
Figure 5.
Growth and photosynthesis of strains over a range of growth temperatures. The number of doublings per day (Td, white circles) is plotted on the left axes, and the dark-adapted photochemical yield (Fv/Fm, white triangles) is plotted on the right axes. Error bars show se. WH8102 grew very slowly at 15°C, approaching the limit of its temperature range under our conditions. The uncertainty in growth rate is indicated by the dashed line in panel F.
Figure 6.
Figure 6.
Photosynthetic yields (Fv/Fm and ΦPSII) versus irradiance for strains grown over a range of temperatures. Legend is shown at lower right. Strains CCMP838 and CCMP841 were only cultured at 15°C and 27°C.
Figure 7.
Figure 7.
State transitions increase with temperature. Data show the percentage change in yield measured during exposure to 100 μmol quanta m–2 s–1 background light (ΦPSII-100) compared with yield measured in the dark (Fv/Fm). More positive values indicate the yield increased following exposure to light relative to the dark-adapted condition. Strains 838 and 841 were only cultured at 15°C and 27°C, and strain PCC 7002 was not cultured at 24°C. Missing boxes in other plots indicate that strains did not grow at that temperature (e.g. CCMP1632 at 15°C and 27°C) or that the average of photosynthetic yields was too low to calculate meaningful percentage changes (e.g. WH8102 at 15°C).
Figure 8.
Figure 8.
Cluster analysis of photosynthetic proteins from the Synechococcus sp. WH8102 (CCMP2370) global proteome at 15°C, 18°C, and 23°C. Color indicates higher (yellow) or lower (blue) relative abundance relative to the centered mean value (black). Raw spectral counts are shown at right.
Figure 9.
Figure 9.
Normalized relative abundance of photosynthetic proteins in the Synechococcus sp. WH8102 (CCMP2370) global proteome grouped by location in the photosynthetic apparatus, including PSI (A), PSII (B), ferredoxin (and associated proteins; C), PBS (D), and cytochrome b6f (E). White circles show the relative abundances of individual peptides as indicated in Figure 8, squares show the mean for each temperature, and error bars show sd (except for cytochrome b6f, where only one peptide was identified). [See online article for color version of this figure.]

References

    1. Agusti S. (2004) Viability and niche segregation of Prochlorococcus and Synechococcus cells across the Central Atlantic Ocean. Aquat Microb Ecol 36: 53–59
    1. Aro EM, Virgin I, Andersson B. (1993) Photoinhibition of photosystem II. Inactivation, protein damage, and turnover. Biochim Biophys Acta 1143: 113–134 - PubMed
    1. Bailey S, Grossman A. (2008) Photoprotection in cyanobacteria: regulation of light harvesting. Photochem Photobiol 84: 1410–1420 - PubMed
    1. Bailey S, Melis A, Mackey KR, Cardol P, Finazzi G, van Dijken G, Berg GM, Arrigo K, Shrager J, Grossman A. (2008) Alternative photosynthetic electron flow to oxygen in marine Synechococcus. Biochim Biophys Acta 1777: 269–276 - PubMed
    1. Bald D, Kruip J, Rogner M. (1996) Supramolecular architecture of cyanobacterial thylakoid membranes: how is the phycobilisome connected with the photosystems? Photosynth Res 49: 103–118 - PubMed

Publication types

MeSH terms