. 2013;9(8):e1003167.
doi: 10.1371/journal.pcbi.1003167. Epub 2013 Aug 8.

Shape similarity, better than semantic membership, accounts for the structure of visual object representations in a population of monkey inferotemporal neurons

Affiliations

Shape similarity, better than semantic membership, accounts for the structure of visual object representations in a population of monkey inferotemporal neurons

Carlo Baldassi et al. PLoS Comput Biol. 2013.

Abstract

The anterior inferotemporal cortex (IT) is the highest stage along the hierarchy of visual areas that, in primates, processes visual objects. Although several lines of evidence suggest that IT primarily represents visual shape information, some recent studies have argued that neuronal ensembles in IT code the semantic membership of visual objects (i.e., represent conceptual classes such as animate and inanimate objects). In this study, we investigated to what extent semantic, rather than purely visual information, is represented in IT by performing a multivariate analysis of IT responses to a set of visual objects. By relying on a variety of machine-learning approaches (including a cutting-edge clustering algorithm that has been recently developed in the domain of statistical physics), we found that, in most instances, IT representation of visual objects is accounted for by their similarity at the level of shape or, more surprisingly, low-level visual properties. Only in a few cases we observed IT representations of semantic classes that were not explainable by the visual similarity of their members. Overall, these findings reassert the primary function of IT as a conveyor of explicit visual shape information, and reveal that low-level visual properties are represented in IT to a greater extent than previously appreciated. In addition, our work demonstrates how combining a variety of state-of-the-art multivariate approaches, and carefully estimating the contribution of shape similarity to the representation of object categories, can substantially advance our understanding of neuronal coding of visual objects in cortex.


Conflict of interest statement

The authors have declared that no competing interests exist.

Figures

Figure 1
Figure 1. Recording locations.
The blue dots show the projections of the recording chamber grid-point locations from the top of the skull to the ventral bank of the superior temporal sulcus (STS) and the ventral surface lateral to the anterior middle temporal sulcus (AMTS). The projections are shown over a sequence of MRI images (spanning a 13–17 anteroposterior range; Horsley-Clarke coordinates) that were collected, for one of the monkeys, before the chamber implant surgery. Only the grid locations in which the electrode was inserted at least once are shown. The red-shaded areas highlight the estimated cortical span that was likely sampled during recording, given that: 1) each electrode penetration usually spanned the whole depth of the targeted cortical bank (either STS or AMTS); and 2) the upper bound of the variability of each recording location along the mediolateral axis (due to bending of the electrode during insertion) can be estimated as ±2 mm . The figure also shows the range of possible locations of the three anterior face patches (AL, AF and AM) according to , so as to highlight their potential overlap with the recording locations.
Figure 2
Figure 2. The stimulus set.
The full set of 213 objects used in our study. The set consists of: i) 188 images of real-world objects belonging to 94 different categories (e.g., two hats, two accordions, two monkey faces, etc.); ii) 5 cars, 5 human faces, and 5 abstract silhouettes; iii) 5 patches of texture (e.g., random dots and oriented bars); iv) a blank frame; v) 4 low contrast (10%, 3%, 2% and 1.5%) images of one of the objects (a camera).
Figure 3
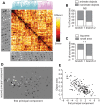
Figure 3. Similarity matrix, hierarchical clustering and PCA of IT population responses to visual objects.
(A) Each pixel in the matrix color-codes the correlation (i.e., similarity) between the neuronal population vectors representing a pair of visual objects. The order of the objects along the axes is defined by the dendrogram produced by hierarchical clustering of the population vectors (to avoid crowding, one every three objects is shown; the complete object set is shown in Fig. 2). The first two branches of the dendrogram (shown at the top) are colored in cyan and magenta. (B) The fraction of animate and inanimate objects is not significantly different in the first two branches of the dendrogram (NS, p>0.1, χ 2 test). (C) The proportion of large and small objects is significantly different in the first two branches of the dendrogram (**, p<0.001, χ 2 test), (D) Layout of visual objects in the two-dimensional space defined by the first two principal components of the IT population responses (to avoid crowding, only some of the objects are shown). (E) Object area and object ranking along the first principal component are linearly related (r = −0.69, p<0.001, t-test).
Figure 4
Figure 4. Overlap between k-means clusters in the IT neuronal space and object categories of the clustering hypotheses.
(A) Fifteen object clusters obtained by a typical run of the k-means algorithm over the IT neuronal representation space. The clusters' arrangement was determined by applying a hierarchical clustering algorithm to their centroids (see the dendrogram on the top; the same approach was used to arrange the shape-based categories shown in C, which resulted from the k-means object clustering in the output layer of an object recognition model [44]). (B–D) The semantic (B), shape-based (C) and low-level (D) categories that significantly overlapped with some of the neuronal-based clusters shown in A. Overlapping neuronal-based clusters and categories are indicated by matching names (e.g., faces) in A and B–D, with the objects in common between a cluster and a category enclosed by either a yellow (semantic), a red (shape-based) or a cyan (low-level) frame. (E) Average number of significant overlaps between neuronal-based clusters and semantic (first bar), shape-based (second bar) and low-level (third bar) categories across 1,000 runs of the k-means algorithm over both the neuronal representation space and the model representation space. The yellow, red and cyan striped portion of the first bar indicates the number of neuronal-based clusters that significantly overlapped with both a semantic category and either a shape-based or a low-level category.
Figure 5
Figure 5. Overlap between D-MST clusters in the IT neuronal space and object categories of the clustering hypotheses.
The five most stable clusters resulting from applying the D-MST clustering algorithm to the IT object representation (see also Fig. S2). The colored frames indicate the subsets of objects that, within each cluster, significantly overlapped with a semantic, a shape-based or a low-level category. The name of the overlapping category is reported near to each frame, together with the overlap's significance level (same overlap score and significance level symbols as in Table 1). The width and shade of the links connecting the images reflect the robustness of the links across different runs of the D-MST algorithm: thinner/lighter links appeared less frequently in the D-MST outcome with respect to thicker/darker links.
Figure 6
Figure 6. Fisher Linear Discriminant (FLD) analysis of IT population activity.
(A) Each gray bar reports the average performance of a binary FLD at correctly classifying members of a given object category (e.g., faces) from all other objects in the set. For each binary classification task, the standard deviation of the performance (error bars), and the mean and standard deviation of the null distribution (gray circles and their error bars), against which significant deviation of performance from chance was assessed (same significance level symbols as in Table 1), are also reported (see Materials and Methods for a description of the cross-validation and permutation procedures yielding these summary statistics). (B) Examples of “pruned” semantic, shape-based and low-level categories that were obtained by subsampling the original object categories (shown in Fig. S1), so as to minimize the overlap between semantic and visual information (see Materials and Methods for details). (C) Performance of the FLDs at correctly classifying members of the pruned categories (same symbols as in A).

References

    1. Logothetis NK, Sheinberg DL (1996) Visual object recognition. Ann Rev Neurosci 19: 577–621. - PubMed
    1. Tanaka K (1996) Inferotemporal cortex and object vision. Annual Review of Neuroscience 19: 109–139. - PubMed
    1. Rolls ET (2000) Functions of the primate temporal lobe cortical visual areas in invariant visual object and face recognition. Neuron 27: 205–218. - PubMed
    1. Connor CE, Brincat SL, Pasupathy A (2007) Transformation of shape information in the ventral pathway. Current Opinion in Neurobiology 17: 140–147. - PubMed
    1. Orban GA (2008) Higher Order Visual Processing in Macaque Extrastriate Cortex. Physiological Reviews 88: 59. - PubMed

Publication types

LinkOut - more resources