

Genome-wide DNA methylation analysis of systemic lupus erythematosus reveals persistent hypomethylation of interferon genes and compositional changes to CD4+ T-cell populations
- PMID: 23950730
- PMCID: PMC3738443
- DOI: 10.1371/journal.pgen.1003678
Genome-wide DNA methylation analysis of systemic lupus erythematosus reveals persistent hypomethylation of interferon genes and compositional changes to CD4+ T-cell populations
Abstract
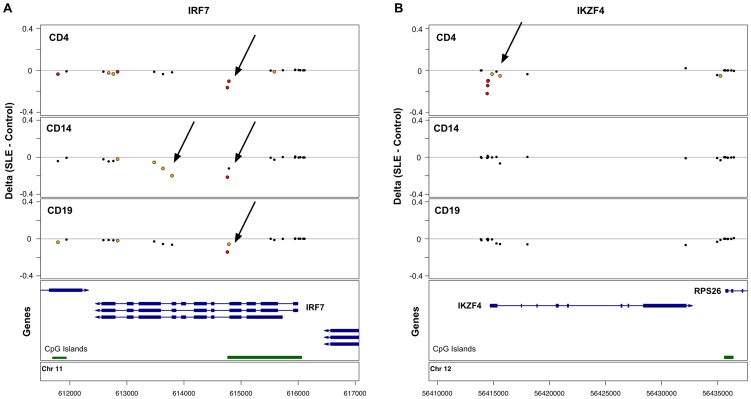
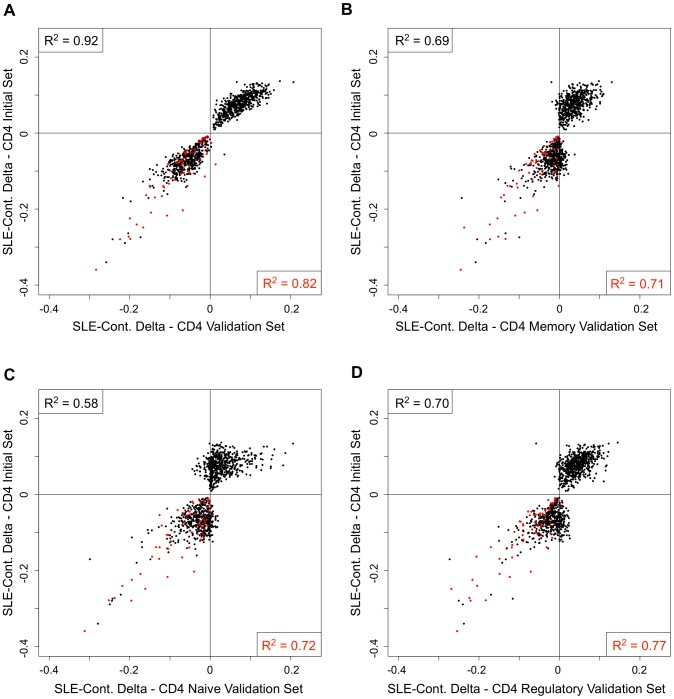
Systemic lupus erythematosus (SLE) is an autoimmune disease with known genetic, epigenetic, and environmental risk factors. To assess the role of DNA methylation in SLE, we collected CD4+ T-cells, CD19+ B-cells, and CD14+ monocytes from 49 SLE patients and 58 controls, and performed genome-wide DNA methylation analysis with Illumina Methylation 450 microarrays. We identified 166 CpGs in B-cells, 97 CpGs in monocytes, and 1,033 CpGs in T-cells with highly significant changes in DNA methylation levels (p < 1 × 10(-8)) among SLE patients. Common to all three cell-types were widespread and severe hypomethylation events near genes involved in interferon signaling (type I). These interferon-related changes were apparent in patients collected during active and quiescent stages of the disease, suggesting that epigenetically-mediated hypersensitivity to interferon persists beyond acute stages of the disease and is independent of circulating interferon levels. This interferon hypersensitivity was apparent in memory, naïve and regulatory T-cells, suggesting that this epigenetic state in lupus patients is established in progenitor cell populations. We also identified a widespread, but lower amplitude shift in methylation in CD4+ T-cells (> 16,000 CpGs at FDR < 1%) near genes involved in cell division and MAPK signaling. These cell type-specific effects are consistent with disease-specific changes in the composition of the CD4+ population and suggest that shifts in the proportion of CD4+ subtypes can be monitored at CpGs with subtype-specific DNA methylation patterns.
Conflict of interest statement
The authors have declared that no competing interests exist.
Figures


References
-
- Hiraki LT, Feldman CH, Liu J, Alarcón GS, Fischer MA, et al. (2012) Prevalence, incidence, and demographics of systemic lupus erythematosus and lupus nephritis from 2000 to 2004 among children in the US medicaid beneficiary population. Arthritis Rheum 64: 2669–2676 doi:10.1002/art.34472 - DOI - PMC - PubMed
-
- Alarcón-Segovia D, Alarcón-Riquelme ME, Cardiel MH, Caeiro F, Massardo L, et al. (2005) Familial aggregation of systemic lupus erythematosus, rheumatoid arthritis, and other autoimmune diseases in 1,177 lupus patients from the GLADEL cohort. Arthritis Rheum 52: 1138–1147 doi:10.1002/art.20999 - DOI - PubMed
-
- Deapen D, Escalante A, Weinrib L, Horwitz D, Bachman B, et al. (1992) A revised estimate of twin concordance in systemic lupus erythematosus. Arthritis Rheum 35: 311–318. - PubMed
-
- Lawrence JS, Martins CL, Drake GL (1987) A family survey of lupus erythematosus. 1. Heritability. J Rheumatol 14: 913–921. - PubMed
-
- Gateva V, Sandling JK, Hom G, Taylor KE, Chung SA, et al. (2009) A large-scale replication study identifies TNIP1, PRDM1, JAZF1, UHRF1BP1 and IL10 as risk loci for systemic lupus erythematosus. Nat Genet 41: 1228–1233 doi:10.1038/ng.468 - DOI - PMC - PubMed
Publication types
MeSH terms
Substances
LinkOut - more resources
Full Text Sources
Other Literature Sources
Medical
Molecular Biology Databases
Research Materials
