. 2013 Aug 7;8(8):e70515.
doi: 10.1371/journal.pone.0070515. eCollection 2013.

miR-105 inhibits prostate tumour growth by suppressing CDK6 levels

Affiliations

miR-105 inhibits prostate tumour growth by suppressing CDK6 levels

D Rice Honeywell et al. PLoS One. .

Abstract

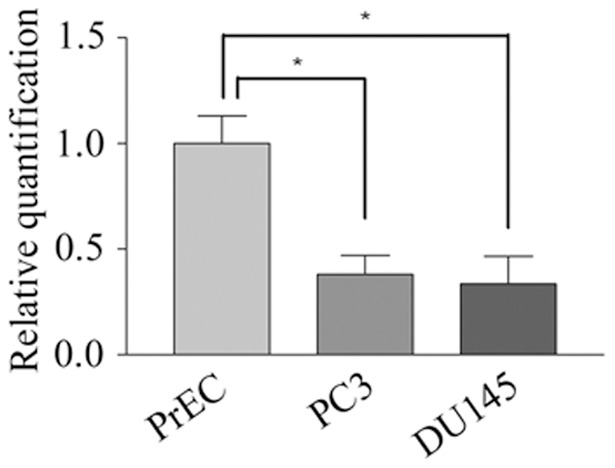
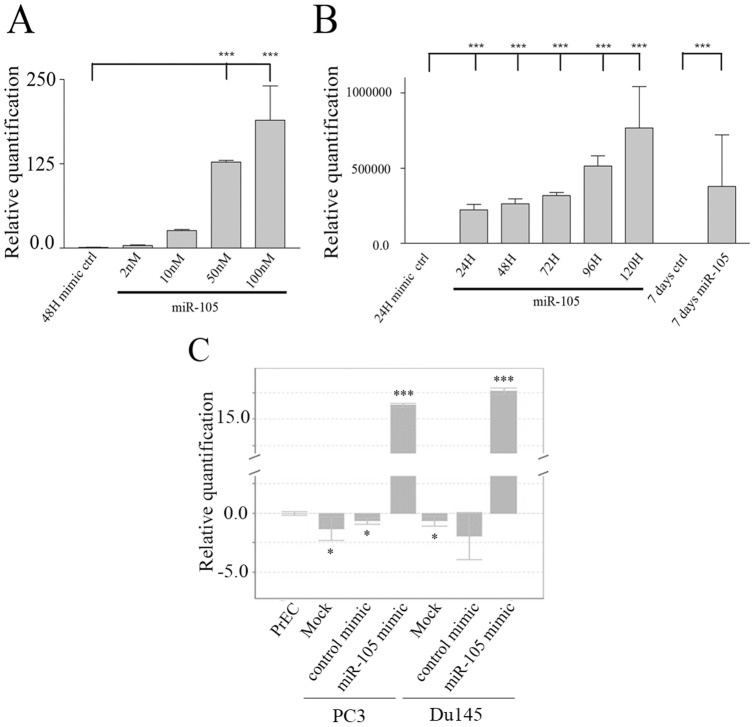
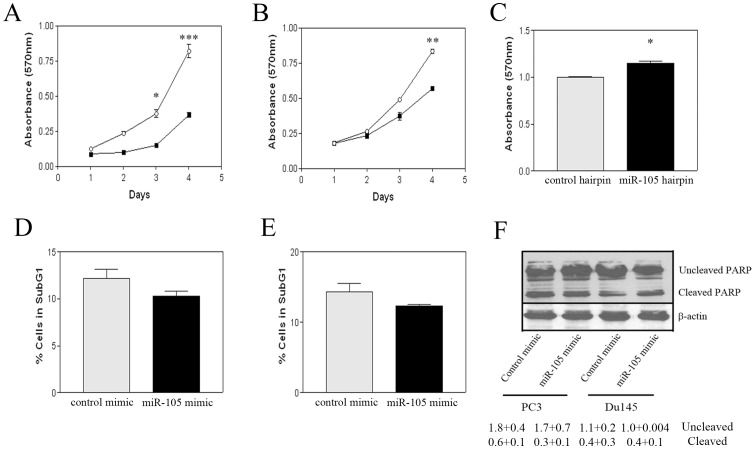
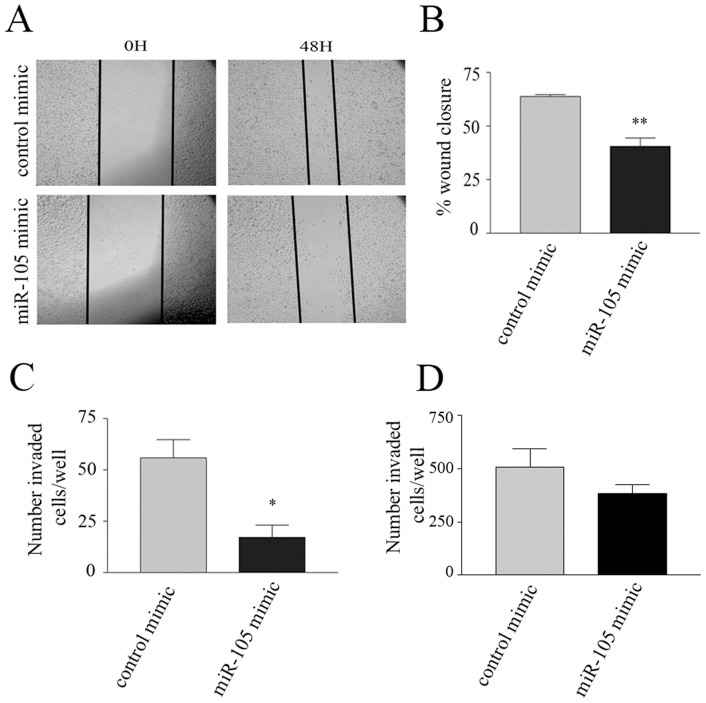
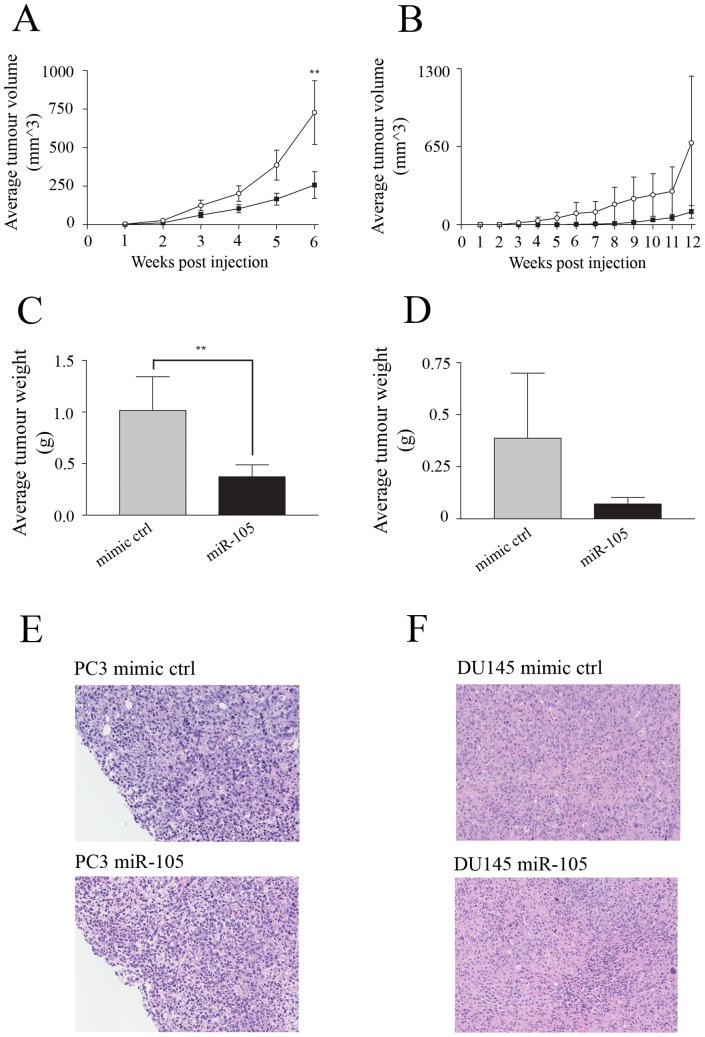
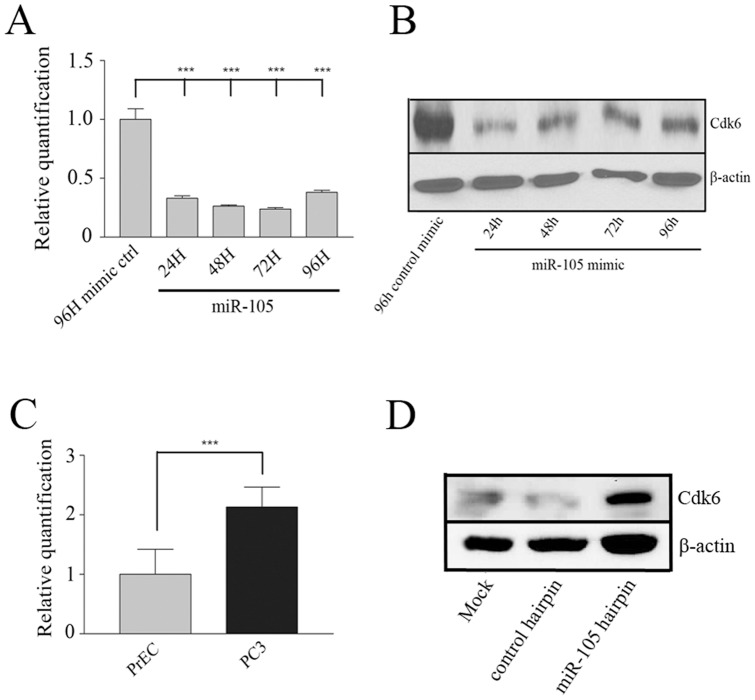
A significant role for micro (mi)RNA in the regulation of gene expression in tumours has been recently established. In order to further understand how miRNA expression may contribute to prostate tumour growth and progression, we evaluated expression of miRNA in two invasive prostate tumour lines, PC3 and DU145, and compared it to that in normal prostate epithelial cells. Although a number of miRNAs were differentially expressed, we focused our analysis on miR-105, a novel miRNA not previously linked to prostate cancer. miR-105 levels were significantly decreased in both tumour cell lines in comparison to normal prostate epithelial cells. To determine its potential role in prostate cancer pathogenesis, we overexpressed miR-105 in both PC3 and DU145 cells and determined its effect on various tumourigenic properties. miR-105 overexpression inhibited tumour cell proliferation, tumour growth in anchorage-independent three-dimensional conditions and tumour invasion in vitro, properties of highly aggressive tumour cells. Of potential clinical significance, miR-105 overexpression inhibited tumour growth in vivo in xenograft models using these cell lines. We further identified CDK6 as a putative target of miR-105 which is likely a main contributor to the inhibition of tumour cell growth observed in our assays. Our results suggest that miR-105 inhibits tumour cell proliferation and hence may represent a novel therapeutically relevant cellular target to inhibit tumour growth or a marker of aggressive tumours in prostate cancer patients.


Conflict of interest statement

Competing Interests: The authors have declared that no competing interests exist.

Figures

Figure 1
Figure 1. miR-105 levels are reduced in prostate tumour cells compared to normal prostate epithelial cells.
Levels of miR-105 were quantified in PrEC, PC3 and DU145 using TaqMan qRT-PCR. Relative levels of miR-105 were normalized to endogenous levels of RNU24 as a control. Graphs represent the pooled mean and standard error of 8 replicates for each cell line from two independent experiments. The relative levels of miR-105 were significantly decreased in PC3 and DU145 cells compared to normal PrEC cells (* represents p<0.05).
Figure 2
Figure 2. Evaluation of efficacy of MIRIDIAN mimics for modulation of miR-105 levels.
(A) PC3 cells were treated with increasing concentrations (2, 10, 50, 100 nM) of miR-105 specific or 100 nM control (cel-miR-67) mimics (Dharmacon). After 48 hours samples were evaluated for relative levels of miR-105 using TaqMan qRT-PCR. miR-105 levels specifically increased in a dose-dependent fashion in miR-105 compared to control mimic transfected cells. The graph represents the mean and standard error of 8 replicates from one experiment. Similar trends were observed in other independent experiments. (B) PC3 cells were treated with 50 nM of miR-105 or control cel-miR-67 mimics, and relative levels of expression of miR-105 were assessed using TaqMan qRT-PCR. miR-105 expression increased over time, and peaked at 120 hours post-transfection before declining, while miR-105 levels remained similar in control mimic-transfected cells over time. In all cases levels were normalized to endogenous levels of RNU24 as an internal control. The graph represents the mean and standard error of 3 replicates from one experiment. Similar results were observed in other independent experiments. *** represents p<0.001 as compared to control mimic-transfected cells for panels A and B. (C) Levels of miR-105 were determined in untransfected PrEC, PC3 or DU145 cells and compared to levels in PC3 or DU145 cells transfected with 50 nM miR-105 or cel-miR-67 mimics. In all cases levels were normalized to endogenous levels of RNU24 as an internal control, and to endogenous levels in PrEC. Bars represent the mean and standard error of 3 replicates from one experiment. Similar results were observed in other independent experiments. * represents p<0.05 and *** represents p<0.001.
Figure 3
Figure 3. Overexpression of miR-105 inhibits tumour cell growth but does not induce apoptosis.
(A–B) Tumour cells were transfected with either 50 nM miR-105 (closed squares) or control (open circles) mimics and subsequently seeded into 96-well plates in replicates of 8. Cell viability was assessed over time using the MTT assay as described in materials and methods. Graphs represent the pooled mean and standard error of 8 replicates from three independent experiments. Both miR-105 overexpressing PC3 (A) and DU145 (B) cells showed a significant decrease in cell number/viability over time (* represents p<0.05, ** represents p<0.01 and *** represents p<0.001 respectively) as compared to control mimic transfected cells. (C) PrEC were transfected with 50 nM of miR-105 or control hairpin inhibitors, and 24 hours later, equal numbers of transfected cells were seeded in 96 well microtiter plates. Cell growth was assessed 48 hours later as described in materials and methods. A modest increase in the mean number of viable cells (plotted with associated standard error) was observed. Graphs represent the pooled mean and standard error of 8 replicates in each of two independent experiments. (D–F) To analyze apoptosis, cells were transfected with 50 nM of miR-105 or control mimic (50 nM) as described in materials and methods and then serum-starved for an additional 48 hours. Apoptotic cells were determined as the percentage cells in sub-G1 as assessed by flow cytometry of propidium iodide stained cells as described. Bars represent the pooled mean and standard error of triplicate dishes from two independent experiments. There was no significant difference in the number of apoptotic cells between the miR-105 and control mimic-treated populations for either PC3 (D) or DU145 (E) cells. (F) Serum starved cells as described above, were also analyzed for PARP cleavage by specific western blot analysis. There were no significant differences in the levels of cleaved PARP noted between the miR-105 and control mimic-transfected cell populations. β-actin was used as a loading control for equivalent amounts of total protein. Mean intensity of bands in western blots (n = 2) and associated standard error for uncleaved and cleaved PARP relative to β-actin levels are indicated below image.
Figure 4
Figure 4. Overexpression of miR-105 mimic inhibits anchorage-independent growth of prostate tumour cells.
(A–D) PC3 (A) and DU145 (B) cells were transfected with either 50 nM miR-105 or control mimic and 24 hours post-transfection were seeded in soft-agarose. The number of colonies was then counted in triplicate wells generated from the 1000 cell/well dilution. Bars represent the pooled mean and standard error for triplicate wells from three independent experiments. There was a significant decrease in colony formation in cells treated with miR-105 as compared to control mimic-transfected cells for both PC3 (** represents p<0.01) and DU145 (* represents p<0.05) cells. (C–D) Representative photos showing reduced colony formation in soft-agarose for miR-105 versus control mimic-transfected PC3 (C) and DU145 (D) cells.
Figure 5
Figure 5. Overexpression of miR-105 mimic inhibits tumour cell migration and invasion.
(A) Representative photos of scratch wound assays at 0 and 48 hours post wounding for miR-105 compared to control mimic-transfected PC3 cells showing impaired wound closure in miR-105 mimic-overexpressing cells. Photos were taken at 40× magnification. (B) PC3 migration was measured as percentage wound closure in assays in (A) as described in materials and methods. Average wound closure measurements at three different points along wound edge were quantified in each of two independent wells. Bars represent pooled mean and standard error of duplicate dishes in each of two independent experiments. Wound closure after 48 hours was significantly less (** represents p<0.01) in the miR-105 mimic-expressing compared to control mimic-transfected cells. (C) PC3 or (D) DU145 cell invasion was measured over 24 hours using Matrigel-coated transwells as described. The total number of invasive cells on the underside of each filter were counted and expressed in the graph as the pooled mean and standard error from duplicate wells in three independent experiments. There were significantly less (* represents p<0.05) miR-105 mimic-overexpressing invaded PC3 cells compared to control mimic-transfected cells, and a similar trend was observed for DU145 cells.
Figure 6
Figure 6. Overexpression of miR-105 inhibits in vivo subcutaneous tumour growth.
(A–G) PC3 and DU145 cells were transfected with either 50 nM miR-105 or control mimics and injected subcutaneously in the hind flanks of 5-week old CD1 nude mice as described in materials and methods. For each condition, data is representative of 16 bilateral tumours from 8 mice. (A–B) Tumour size was measured by calipers over time for PC3 (A) and DU145 (B) derived tumours until humane endpoints were reached. Tumours derived from miR-105 overexpressing PC3 cells were significantly smaller than tumours derived from control mimic-transfected PC3 cells while tumours derived from miR-105 mimic-transfected DU145 cells trended to be smaller than their respective controls. (C–D) Tumour wet weight at experimental endpoint was also measured for PC3 (C) and DU145 (D) derived tumours. The mean weight in grams and associated standard error is plotted, and shows that at endpoint miR-105 mimic-transfected PC3 were significantly smaller compared with control mimic-transfected cells. DU145 tumours showed similar trends but did not quite reach statistical significance. (E–F) At endpoint tumour sections were histologically analyzed. No significant differences in tumour morphology were observed between miR-105 versus control mimic-transfected cell derived tumours for either PC3 (E) or DU145 (F) tumours. In all cases ** represents p<0.01.
Figure 7
Figure 7. miR-105 results in decreased Cdk6 expression at both the mRNA and protein levels.
(A–B) PC3 cells were transfected with 50 nM miR-105 or control mimics as described in materials and methods and relative levels of Cdk6 expression were assessed over time. Both the mRNA and protein samples were isolated from paired dishes of transfected cells for each condition. (A) Relative levels of CDK6 mRNA were determined following qRT-PCR analysis and normalization to endogenous levels of β-actin as a control. The graph represents the mean and standard error of triplicate dishes from one experiment. Similar trends were observed in other independent experiments. *** represents p<0.001. (B) Cdk6 protein levels were assessed by western blot analysis. Blots were reprobed for levels of β-actin as a loading control for total protein. We observed a significant decrease in both Cdk6 mRNA and protein expression in miR-105 overexpressing as compared to control mimic-transfected PC3 cells. Blots were repeated a minimum of three independent times. (C) CDK6 mRNA levels were also compared between normal PrEC cells and cancerous PC3 cells using qRT-PCR and normalization to endogenous β-actin levels as a control. Consistent with expressing reduced endogenous miR-105 levels, PC3 cells had higher CDK6 expression when compared to PrEC. The graph represents the mean and standard error of triplicate samples from one experiment. Similar trends were observed in other independent experiments. *** represents p<0.001. (D) PrEC were either mock transfected or transfected with hsa-miR-105 or cel-miR-67 hairpin inhibitors, and Cdk6 levels assessed by western blot analysis. Blots were reprobed for β-actin as a loading control for total protein. Cdk6 levels were significantly elevated in PrEC transfected with miR-105 as compared to controls. Blots were repeated two independent times with similar results.

References

    1. Lee RC, Feinbaum RL, Ambros V (1993) The C. elegans heterochronic gene lin-4 encodes small RNAs with antisense complementarity to lin-14. Cell 75: 843–854. - PubMed
    1. Wightman B, Ha I, Ruvkun G (1993) Posttranscriptional regulation of the heterochronic gene lin-14 by lin-4 mediates temporal pattern formation in C. elegans. Cell 75: 855–862. - PubMed
    1. Winter J, Jung S, Keller S, Gregory RI, Diederichs S (2009) Many roads to maturity: microRNA biogenesis pathways and their regulation. Nat Cell Biol 11: 228–234. - PubMed
    1. Lee Y, Ahn C, Han J, Choi H, Kim J, et al. (2003) The nuclear RNase III Drosha initiates microRNA processing. Nature 425: 415–419. - PubMed
    1. Lund E, Guttinger S, Calado A, Dahlberg JE, Kutay U (2004) Nuclear export of microRNA precursors. Science 303: 95–98. - PubMed

Publication types

MeSH terms