

Deep-sea benthic footprint of the deepwater horizon blowout
- PMID: 23950956
- PMCID: PMC3737147
- DOI: 10.1371/journal.pone.0070540
Deep-sea benthic footprint of the deepwater horizon blowout
Abstract
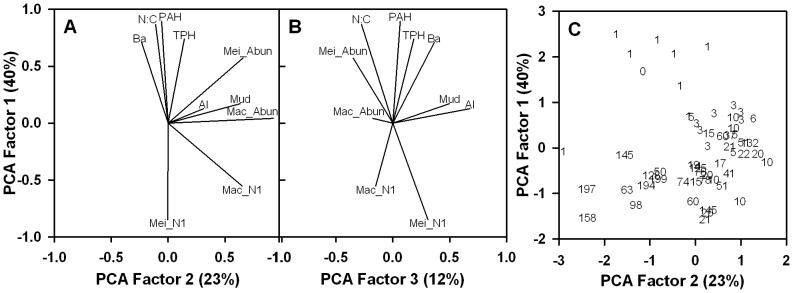
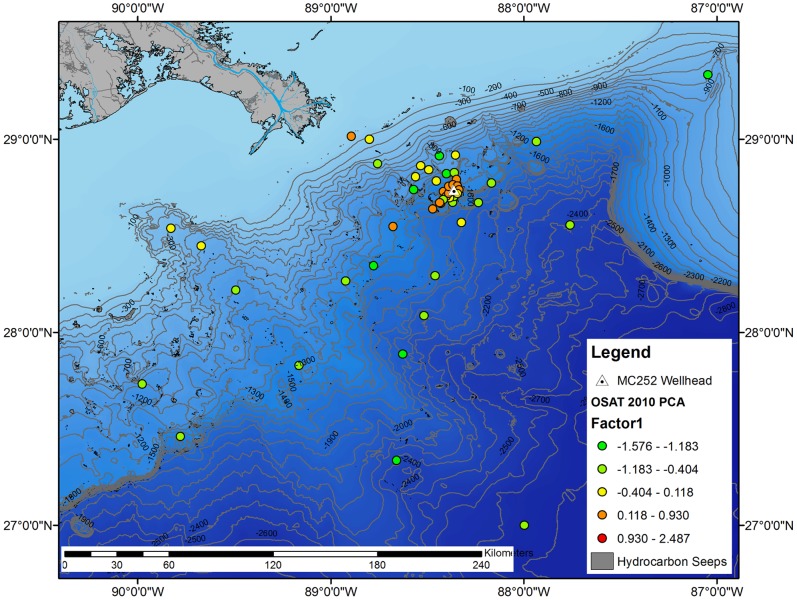
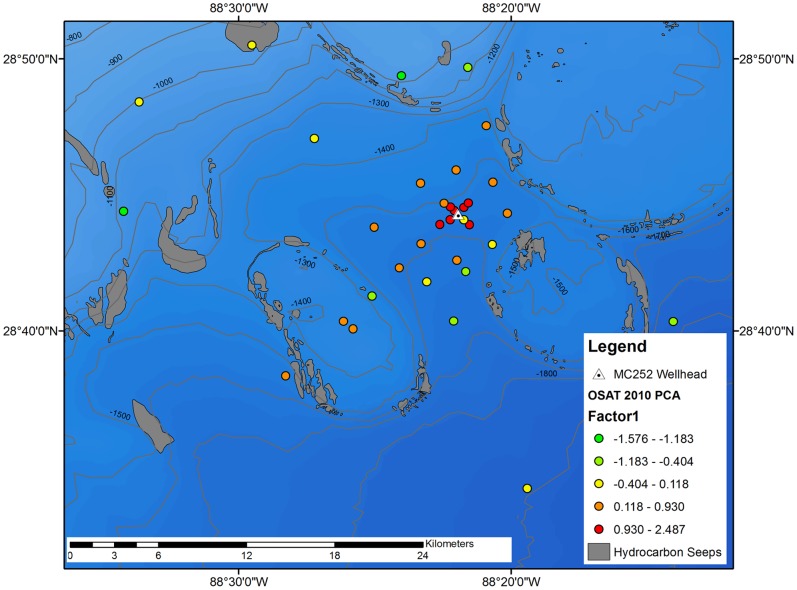
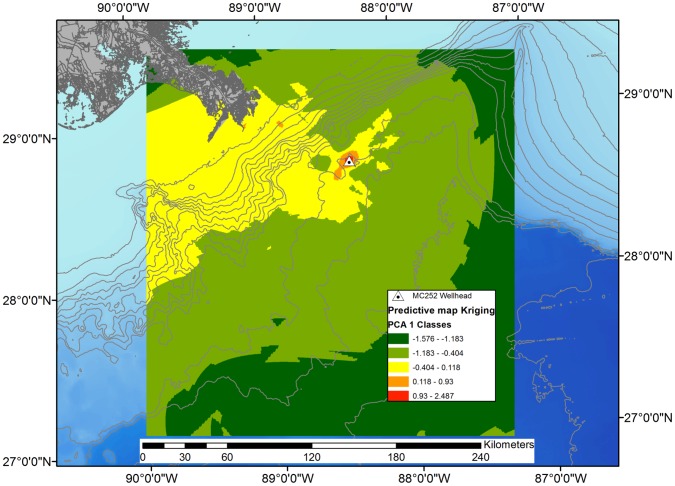
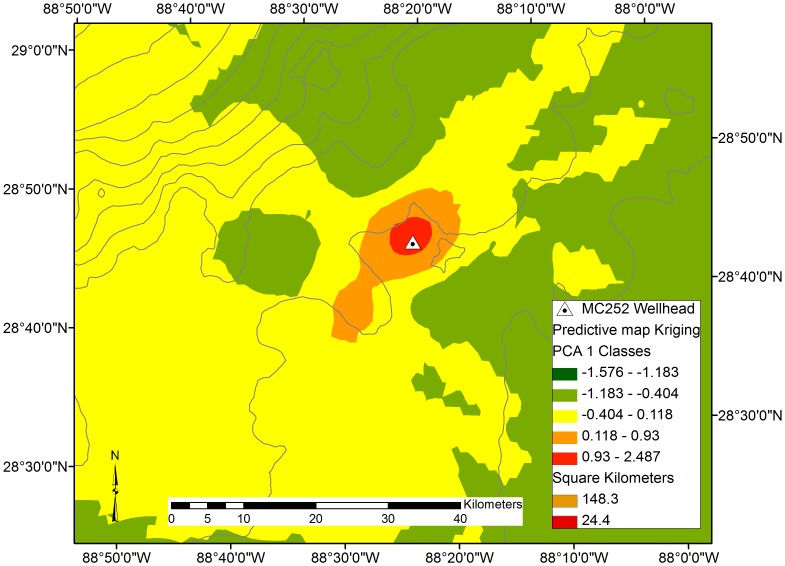
The Deepwater Horizon (DWH) accident in the northern Gulf of Mexico occurred on April 20, 2010 at a water depth of 1525 meters, and a deep-sea plume was detected within one month. Oil contacted and persisted in parts of the bottom of the deep-sea in the Gulf of Mexico. As part of the response to the accident, monitoring cruises were deployed in fall 2010 to measure potential impacts on the two main soft-bottom benthic invertebrate groups: macrofauna and meiofauna. Sediment was collected using a multicorer so that samples for chemical, physical and biological analyses could be taken simultaneously and analyzed using multivariate methods. The footprint of the oil spill was identified by creating a new variable with principal components analysis where the first factor was indicative of the oil spill impacts and this new variable mapped in a geographic information system to identify the area of the oil spill footprint. The most severe relative reduction of faunal abundance and diversity extended to 3 km from the wellhead in all directions covering an area about 24 km(2). Moderate impacts were observed up to 17 km towards the southwest and 8.5 km towards the northeast of the wellhead, covering an area 148 km(2). Benthic effects were correlated to total petroleum hydrocarbon, polycyclic aromatic hydrocarbons and barium concentrations, and distance to the wellhead; but not distance to hydrocarbon seeps. Thus, benthic effects are more likely due to the oil spill, and not natural hydrocarbon seepage. Recovery rates in the deep sea are likely to be slow, on the order of decades or longer.
Conflict of interest statement
Figures
References
-
- Griffiths SK (2012) Oil release from Macondo Well MC252 following the Deepwater Horizon Accident. Environ Sci Technol 46: 5616–5622. - PubMed
-
- NOAA USGS(2010) BP Deepwater Horizon Oil Budget: What Happened to the Oil? www.noaanews.noaa.gov/stories2010/PDFs/OilBudget_description_%2083final.pdf.
-
- Peterson CH, Anderson SS, Cherr GN, Ambrose RF, Anghera S, et al. (2012) A tale of two spills: novel science and policy implications of an emerging new oil spill model. Bioscience 62: 461–469.
-
- UAC (Unified Area Command) (2010) Deepwater Horizon MC 252 Response Unified Area Command – Strategic Plan for Sub-Sea and Sub-Surface Oil and Dispersant Detection, Sampling, and Monitoring. November 13, 2010 Final, U.S. Coast Guard and BP Exploration and Production, Inc. New Orleans, LA. USA.
Publication types
MeSH terms
Substances
LinkOut - more resources
Full Text Sources
Other Literature Sources
Medical
Research Materials
Miscellaneous
