

Contribution of 32 GWAS-identified common variants to severe obesity in European adults referred for bariatric surgery
- PMID: 23950990
- PMCID: PMC3737377
- DOI: 10.1371/journal.pone.0070735
Contribution of 32 GWAS-identified common variants to severe obesity in European adults referred for bariatric surgery
Abstract
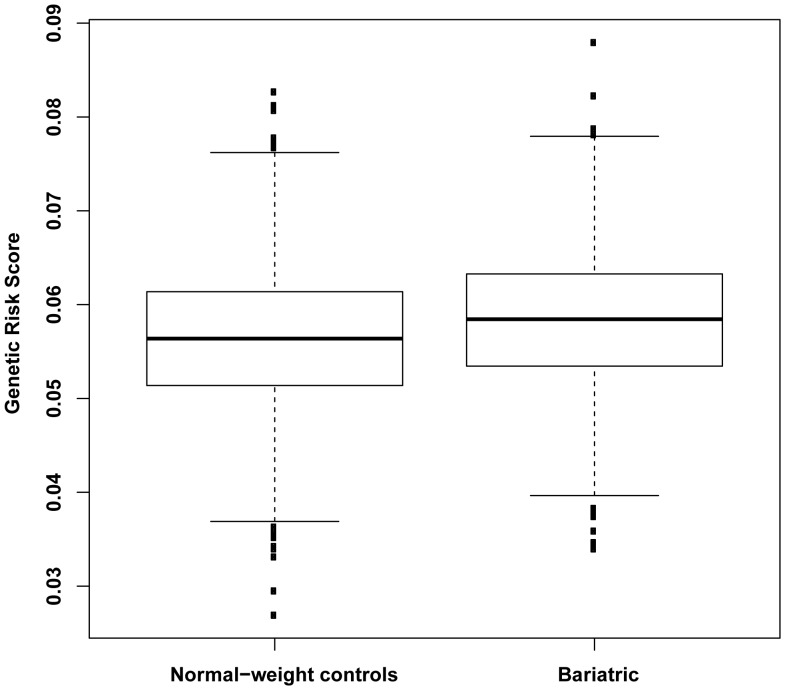
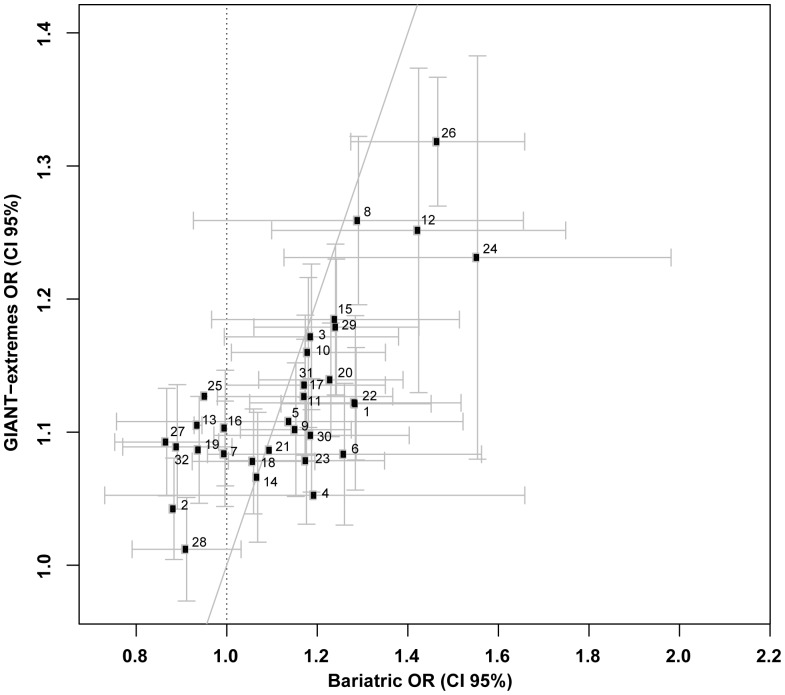
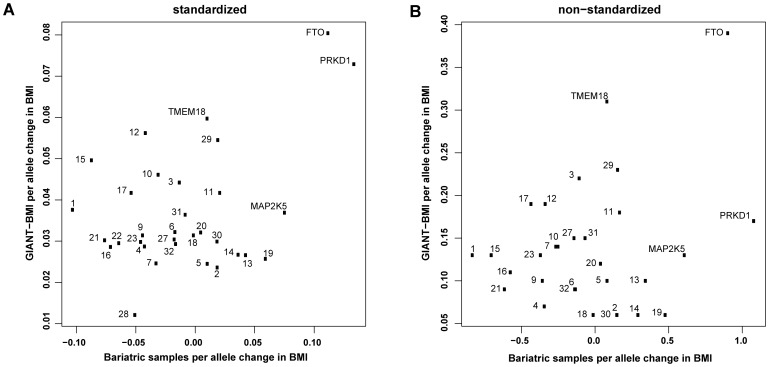
The prevalence of severe obesity, defined as body mass index (BMI) ≥ 35.0 kg/m(2), is rising rapidly. Given the disproportionately high health burden and healthcare costs associated with this condition, understanding the underlying aetiology, including predisposing genetic factors, is a biomedical research priority. Previous studies have suggested that severe obesity represents an extreme tail of the population BMI variation, reflecting shared genetic factors operating across the spectrum. Here, we sought to determine whether a panel of 32 known common obesity-susceptibility variants contribute to severe obesity in patients (n = 1,003, mean BMI 48.4 ± 8.1 kg/m(2)) attending bariatric surgery clinics in two European centres. We examined the effects of these 32 common variants on obesity risk and BMI, both as individual markers and in combination as a genetic risk score, in a comparison with normal-weight controls (n = 1,809, BMI 18.0-24.9 kg/m(2)); an approach which, to our knowledge, has not been previously undertaken in the setting of a bariatric clinic. We found strong associations with severe obesity for SNP rs9939609 within the FTO gene (P = 9.3 × 10(-8)) and SNP rs2815752 near the NEGR1 gene (P = 3.6 × 10(-4)), and directionally consistent nominal associations (P<0.05) for 12 other SNPs. The genetic risk score associated with severe obesity (P = 8.3 × 10(-11)) but, within the bariatric cohort, this score did not associate with BMI itself (P = 0.264). Our results show significant effects of individual BMI-associated common variants within a relatively small sample size of bariatric patients. Furthermore, the burden of such low-penetrant risk alleles contributes to severe obesity in this population. Our findings support that severe obesity observed in bariatric patients represents an extreme tail of the population BMI variation. Moreover, future genetic studies focused on bariatric patients may provide valuable insights into the pathogenesis of obesity at a population level.
Conflict of interest statement
Figures
References
-
- Finucane MM, Stevens GA, Cowan MJ, Danaei G, Lin JK, et al. (2011) National, regional, and global trends in body-mass index since 1980: systematic analysis of health examination surveys and epidemiological studies with 960 country-years and 9.1 million participants. Lancet 377: 557–567. - PMC - PubMed
-
- UK Health and Social Care Information Centre website. Available: www.ic.nhs.uk/pubs/hse11report. Accessed 2013 July 1.
-
- Neovius M, Teixeira-Pinto A, Rasmussen F (2008) Shift in the composition of obesity in young adult men in Sweden over a third of a century. Int J Obes (Lond) 32: 832–836. - PubMed
-
- Flegal KM, Carroll MD, Kit BK, Ogden CL (2012) Prevalence of obesity and trends in the distribution of body mass index among US adults, 1999–2010. JAMA 307: 491–497. - PubMed
Publication types
MeSH terms
Substances
Grants and funding
LinkOut - more resources
Full Text Sources
Other Literature Sources
