. 2013 Aug 8;8(8):e70815.
doi: 10.1371/journal.pone.0070815. eCollection 2013.

Loss of protein kinase C-δ protects against LPS-induced osteolysis owing to an intrinsic defect in osteoclastic bone resorption

Affiliations

Loss of protein kinase C-δ protects against LPS-induced osteolysis owing to an intrinsic defect in osteoclastic bone resorption

Ee Cheng Khor et al. PLoS One. .

Abstract

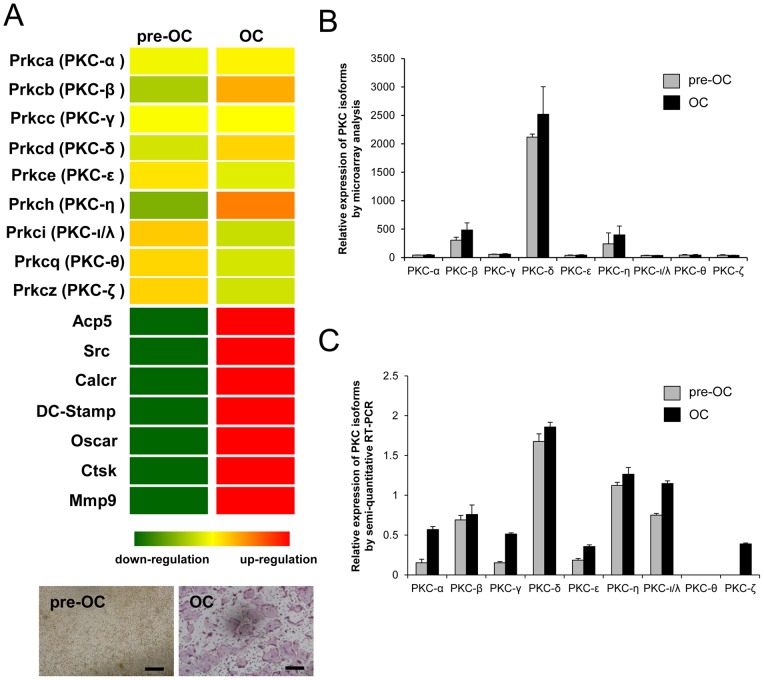
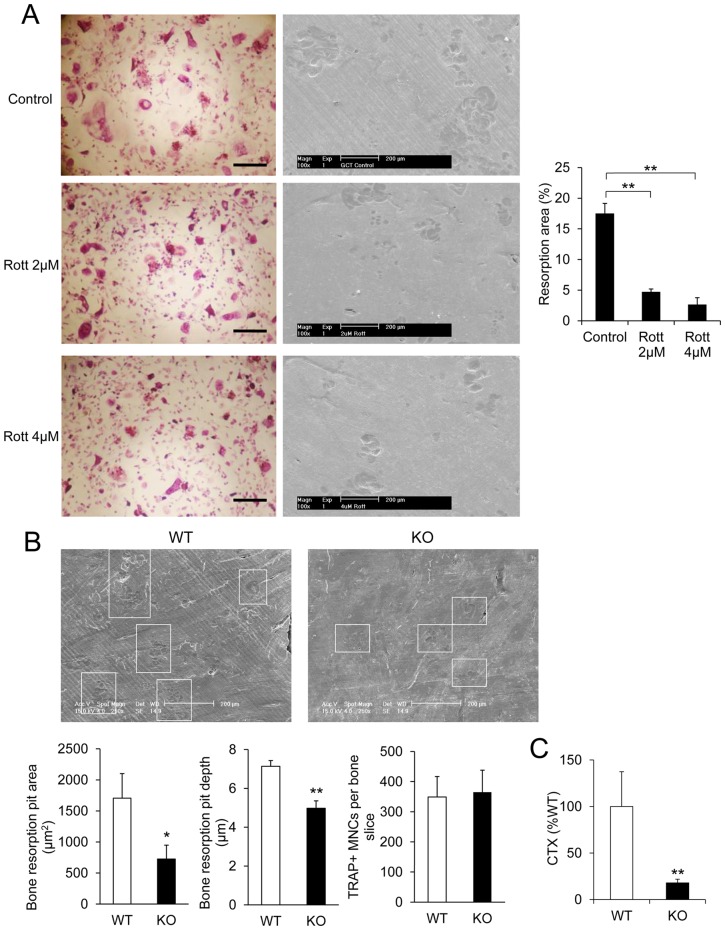
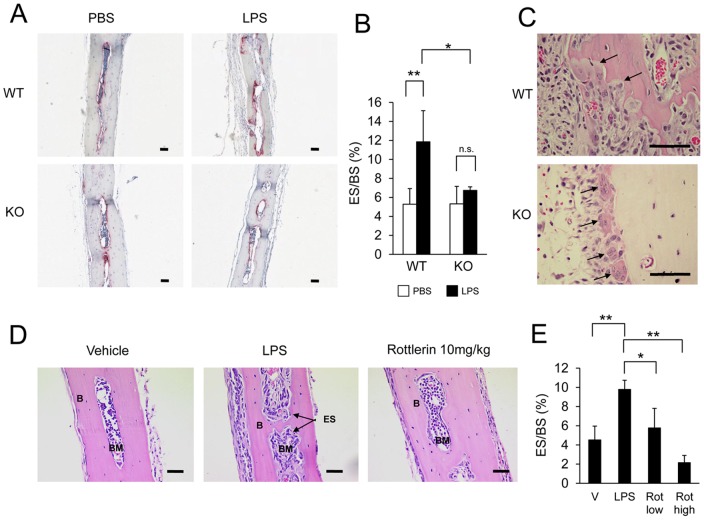
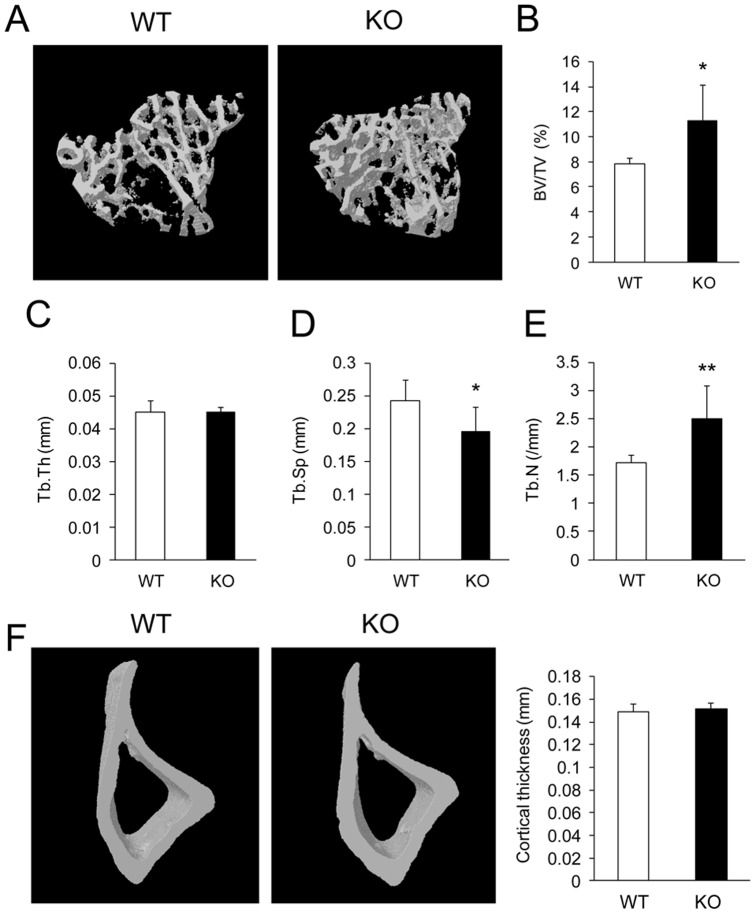
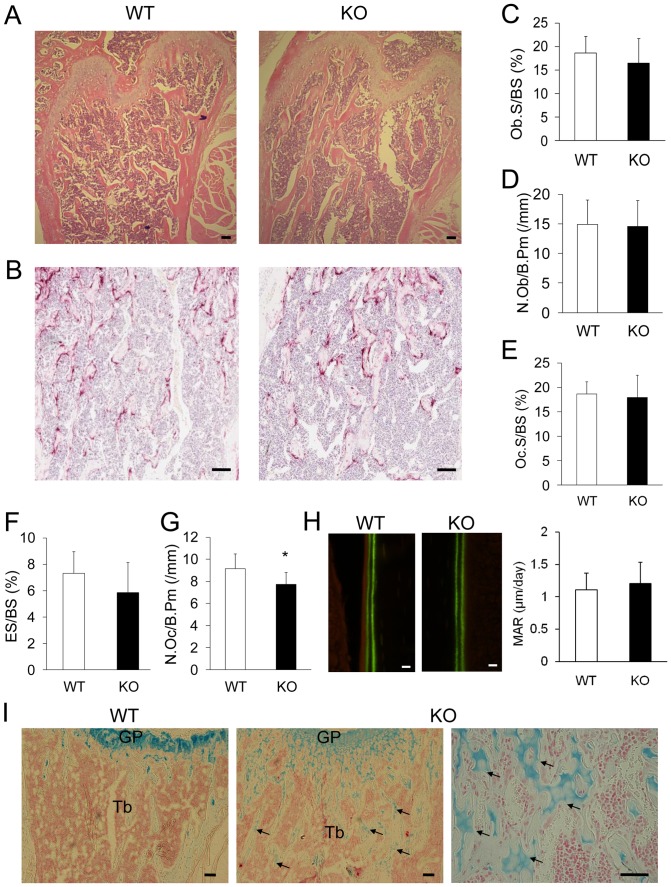
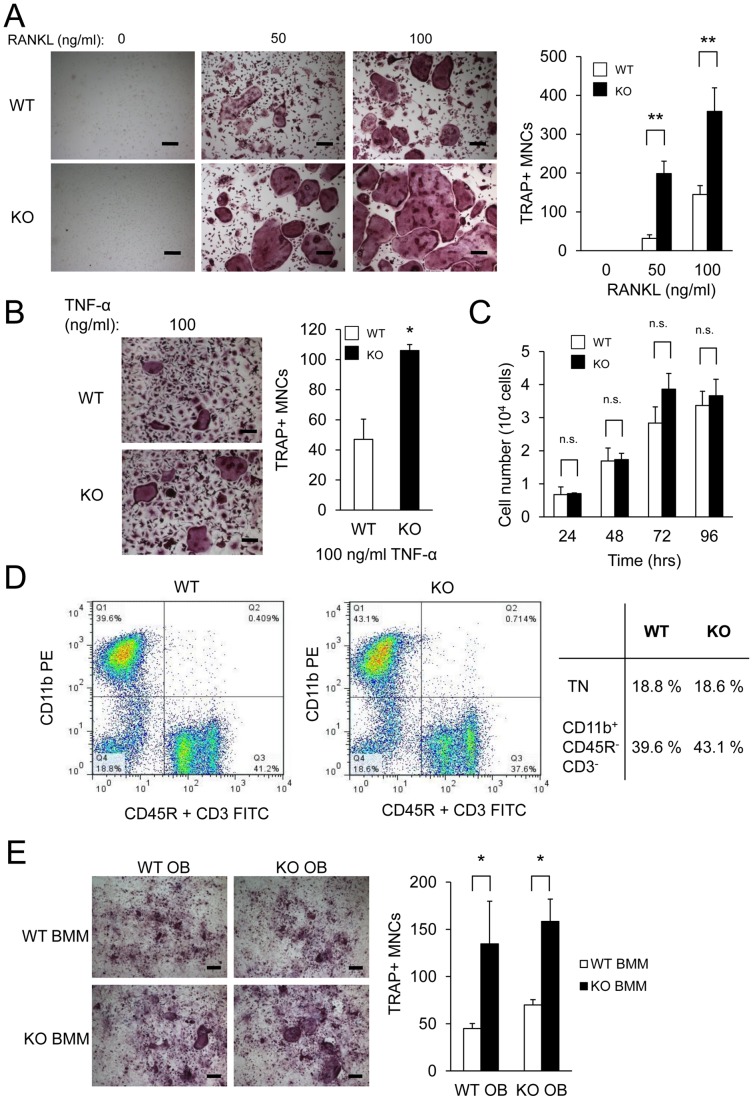
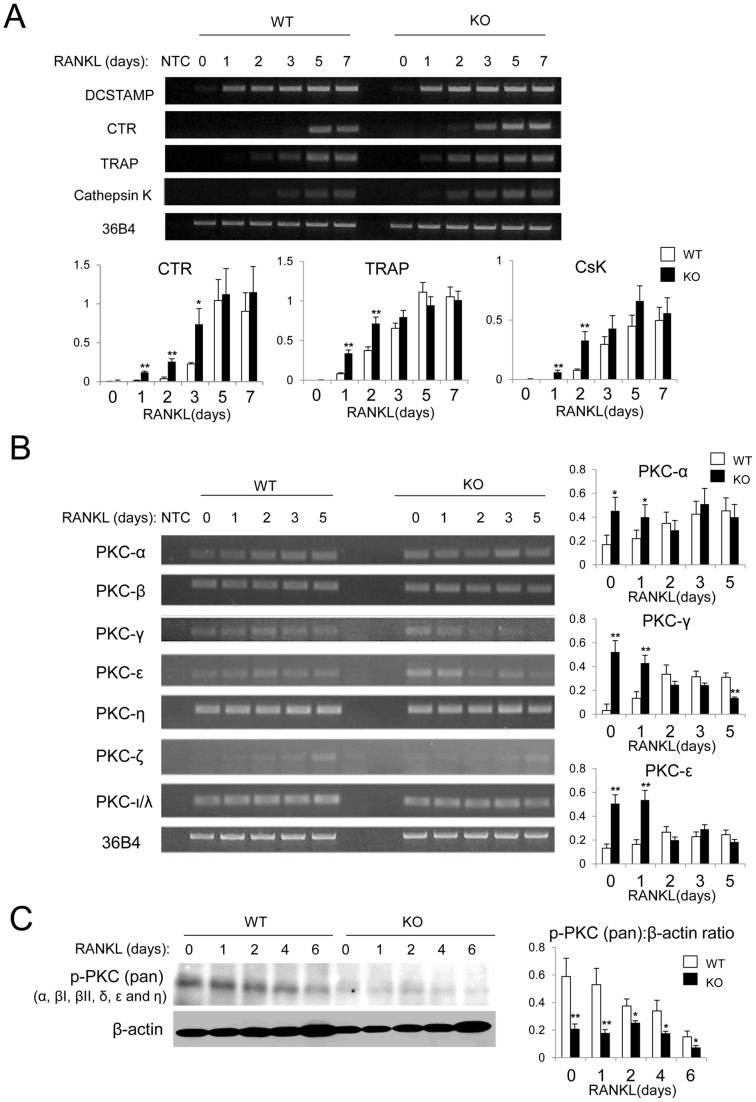
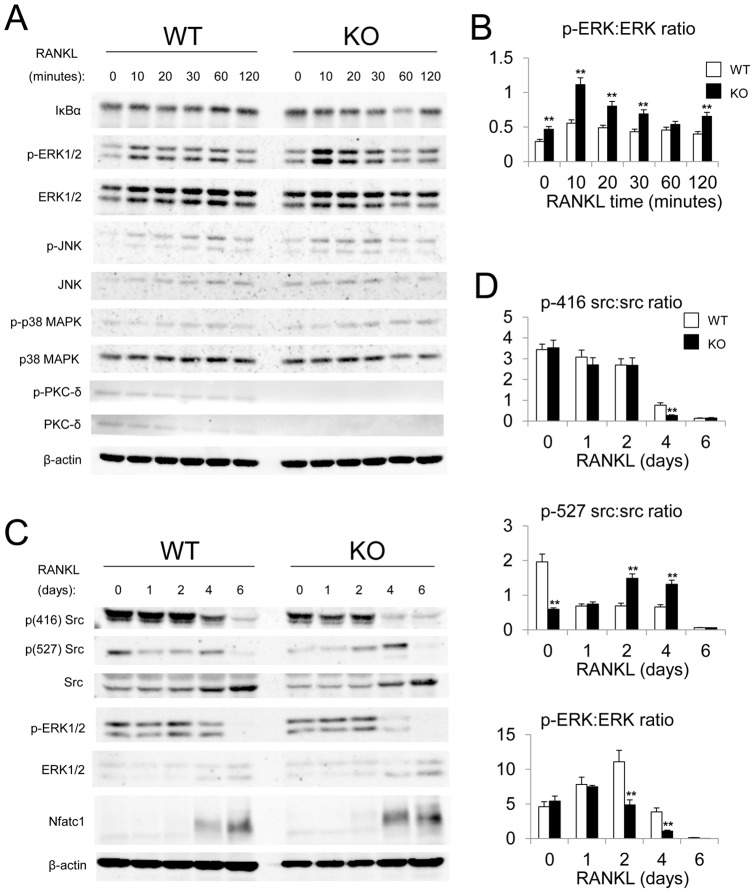
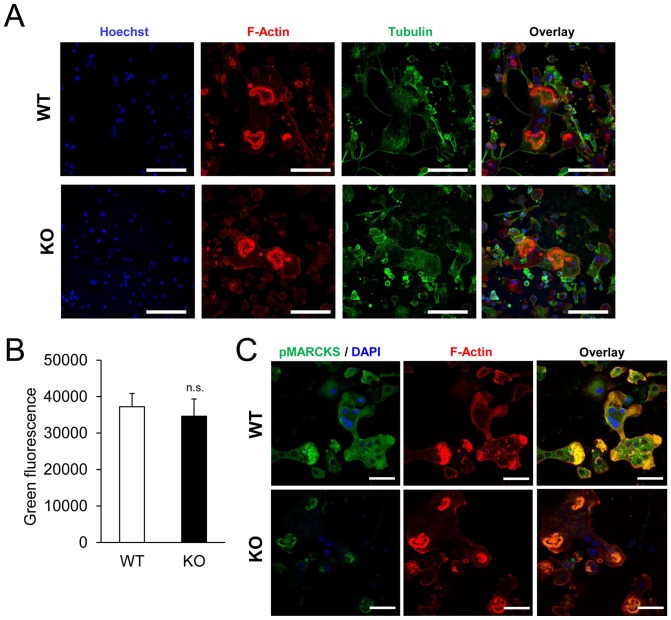
Bone remodeling is intrinsically regulated by cell signaling molecules. The Protein Kinase C (PKC) family of serine/threonine kinases is involved in multiple signaling pathways including cell proliferation, differentiation, apoptosis and osteoclast biology. However, the precise involvement of individual PKC isoforms in the regulation of osteoclast formation and bone homeostasis remains unclear. Here, we identify PKC-δ as the major PKC isoform expressed among all PKCs in osteoclasts; including classical PKCs (-α, -β and -γ), novel PKCs (-δ, -ε, -η and -θ) and atypical PKCs (-ι/λ and -ζ). Interestingly, pharmacological inhibition and genetic ablation of PKC-δ impairs osteoclastic bone resorption in vitro. Moreover, disruption of PKC-δ activity protects against LPS-induced osteolysis in mice, with osteoclasts accumulating on the bone surface failing to resorb bone. Treatment with the PKC-δ inhibitor Rottlerin, blocks LPS-induced bone resorption in mice. Consistently, PKC-δ deficient mice exhibit increased trabeculae bone containing residual cartilage matrix, indicative of an osteoclast-rich osteopetrosis phenotype. Cultured ex vivo osteoclasts derived from PKC-δ null mice exhibit decreased CTX-1 levels and MARKS phosphorylation, with enhanced formation rates. This is accompanied by elevated gene expression levels of cathepsin K and PKC -α, -γ and -ε, as well as altered signaling of pERK and pcSrc416/527 upon RANKL-induction, possibly to compensate for the defects in bone resorption. Collectively, our data indicate that PKC-δ is an intrinsic regulator of osteoclast formation and bone resorption and thus is a potential therapeutic target for pathological osteolysis.


Conflict of interest statement

Competing Interests: The authors have declared that no competing interests exist.

Figures

Figure 1
Figure 1. PKC-δ is the predominant isoform among PKCs expressed in osteoclasts.
Microarray analysis of PKC isoform gene expression during osteoclast differentiation. (A) BMM cells (pre-OC) were treated with 100 ng/ml RANKL for 5 days to differentiate into mature osteoclasts (OC). Total RNA was harvested for microarray analysis. Heatmap demonstrating the upregulation of PKC-β, PKC-δ and PKC-η during osteoclast differentiation, with osteoclast specific genes. Up-regulation and down-regulation are shown in red and green respectively. TRAP staining for osteoclasts was also included in parallel experiment. Scale bar represents 200 μm. (B) Relative expressions of PKC isoforms was presented by arbitrary readings of microarray analysis (C) Semi-quantitative RT-PCR analysis comparing the gene expression profile of PKC isoforms in BMM and RANKL-treated osteoclasts including classical PKCs (−α, −β and −γ), novel PKCs (−δ, −ε, −η and −θ) and atypical PKCs (−ι/λ and −ζ).
Figure 2
Figure 2. Inhibition of PKC-δ and knock out of PKC-δ resulted in impaired osteoclastic bone resorption in vitro.
(A) Multinucleated giant cells isolated from patients presenting with Giant cell tumor (GCT) of bone were cultured on the bovine bone slices in the presence and absence of Rottlerin (Rott). Representative light images of osteoclasts derived from GCT, and scanning electron micrographs of resorptive lacunae on bone slices. Resorbed area as a percentage of total bone slice area was determined. (B) SEM micrographs of bone discs cultured with WT and PKC-δ KO osteoclasts. Osteoclast bone resorption pits are highlighted by white boxes. Average bone resorption area and average pit depth was measured. Total osteoclast numbers were the same on all bone discs. (C) Percentage of CTX released into culture medium by PKC-δ KO and WT osteoclasts cultured in bone. Scale bar represents 200 μm. Bar charts represent mean ± standard deviation. *, p-value <0.05, **, p-value <0.01.
Figure 3
Figure 3. PKC-δ deficiency protects against LPS-induced osteolysis.
(A) Representative TRAP stained histological sections of calvarial bone from WT and PKC-δ KO mice seven days post-injection with Phosphate Buffered Saline (PBS) or Lipopolysaccharide (LPS). (B) Bone eroded surface quantified by bone histomorphometry (n = 4). (C) H&E stained sections of LPS-treated calvaria. Active bone resorbing WT osteoclasts and unattached inactive KO osteoclasts are indicated by arrows. (D) H&E stained sections of WT mice (n = 4) seven days post injection with either Vehicle (V), Lipopolysaccharide (LPS), LPS with 2 mg/kg Rottlerin (Rot low) or LPS with 10 mg/kg Rottlerin (Rot high). (E) Bone eroded surface of Rottlerin treated bone quantified by bone histomorphometry. Unshaded bars in bar charts denote vehicle injections, shaded bars denote LPS injections. Bar charts represent mean ± standard deviation. Scale bar represents 100 μm. *, p-value <0.05. **, p-value<0.01, n.s., no significance (p-value>0.05).
Figure 4
Figure 4. PKC-δ deficiency increases trabecular bone volume.
(A) Micro-CT images of the trabecular bone in the proximal tibial metaphysis of three-month-old female PKC-δ KO mice and age-sex matched WT mice. (B–E) Micro-CT analysis of eight pairs of three-month-old female PKC-δ KO and WT mice tibias for trabecular bone volume (BV/TV), trabecular thickness (Tb.Th), trabecular separation (Tb.Sp) and trabecular number (Tb.N). (F) Micro-CT analysis of tibial cortical thickness measured 5 mm distal to the proximal growth plate. Bar charts represent mean ± standard deviation. *, p-value <0.05. **, p-value<0.01.
Figure 5
Figure 5. Osteoclast deficiencies in trabecular bone of PKC-δ KO mice.
(A–B) Histological sections of three-month-old female PKC-δ KO mice and age-sex matched WT mice femurs stained with H&E (A) and TRAP (B), scale bar represents 100 µm. (C–G) Osteoblast surface (Ob.S/BS), number of osteoblasts (N.Ob/B.Pm), osteoclast surface (Oc.S/BS), eroded surface (ES/BS) and number of osteoclasts (N.Oc/B.Pm) was analyzed for eight pairs (n = 8) of three-month-old, female PKC-δ KO and WT mice femurs. (H) Bone mineral apposition rate measured from calcein-labeled bones, scale bar represents 10 µm. (I) Alcian Blue stained histological sections; far right image shows a higher magnification micrograph of unresorbed cartilage in PKC-δ KO bone, scale bar represents 100 µm. GP; growth plate, Tb; Trabecular bone. Arrows indicate the remnants of unremodeled cartilage matrix within trabecular bone. Bar charts represent mean ± standard deviation. *, p-value <0.05. **, p-value<0.01.
Figure 6
Figure 6. Altered RANKL-induced osteoclastogenesis in PKC-δ KO mice.
(A) Bone marrow monocytes (BMMs) from age-sex matched PKC-δ KO and WT mice hindlimbs were stimulated with M-CSF and different concentrations of RANKL (0, 50 ng/ml and 100 ng/ml) for four days to form osteoclasts. The cells were fixed and TRAP stained to quantify the number of multinucleated osteoclasts (>3 nuclei). Experiments were performed in triplicate. (B) WT and KO BMM stimulated with MCSF and 100 ng/ml of TNF-α to form TRAP positive osteoclasts. Scale bar represents 200 μm. Bar charts represent mean ± standard deviation. (C) MTS cell proliferation assay was performed on M-CSF treated cells stimulated with RANKL at the indicated times. Scale bar represents 200 μm. (D) Bone marrow cells from WT and PKC-δ KO mice were immunostained for CD45R, CD3 and CD11b for flow cytometry analysis and the osteoclast precursor population in WT and PKC-δ KO bone marrow was quantified (TN, triple negative). Charts are presented as pseudocolour density plots. (E) TRAP-stained primary osteoblast and BMM cocultures from WT and PKC-δ KO mice stimulated with 10 nM of Vitamin D3 for seven days. Scale bar represents 200 μm. Bar charts represent mean ± standard deviation. *, p-value <0.05. **, p-value<0.01.
Figure 7
Figure 7. Altered gene expression profile in PKC-δ KO osteoclast cultures.
BMMs from WT and PKC-δ KO mice were stimulated with 100 ng/ml of RANKL for the indicated times (0, 1, 2, 3, 5 and 7 days). Total RNA was extracted for RT-PCR. (A) Gene expression of osteoclast specific genes: DC-STAMP, Calcitonin receptor (CTR), Tartrate-resistant acid phosphatase (TRAP), Cathepsin K (CsK) and reference gene 36B4. Quantitative gene expression relative to 36B4 as determined by densitometry of agarose gel images. NTC, no template control. (B) PKC-δ KO BMM showed altered gene expression of PKC isoforms during RANKL-induced osteoclastogenesis. Quantitative gene expression relative to 36B4 of PKC-α, PKC-γ and PKC-ε by densitometry of agarose gel images. (C) Western blot analysis showing that the phosphorylation levels of PKC isoforms were reduced in PKC-δ KO osteoclasts compared to WT. Statistical analysis was performed by comparing to WT in each time point. *, p-value <0.05. **, p-value <0.01.
Figure 8
Figure 8. Altered ERK and Src signaling in PKC-δ deficient osteoclasts.
WT and PKC-δ KO BMMs were serum-starved overnight before stimulation with M-CSF and 100 ng/ml of RANKL at the indicated times. (A) Western blot analysis of total protein from WT and PKC-δ KO BMMs stimulated with M-CSF and 100 ng/ml of RANKL (short time-course, 0–120 min). (B) Quantitative analysis of short-term ERK phosphorylation relative to total ERK protein expression by densitometry of western blot images. (C) Western blot analysis of RANKL-induced osteoclastogenesis (long time-course, 0–6 days). (D) Quantitative analysis of Src Tyr-416 and Tyr-527 phosphorylation status relative to total Src protein expression, and long-term ERK phosphorylation relative to total ERK protein expression, as measured by densitometry of western blot images. β-actin was probed as a loading control. Statistical analysis was performed by comparing to WT in each time point. *, p-value <0.05. **, p-value<0.01.
Figure 9
Figure 9. Cytoskeletal reorganization, lysosomal acidification and MARCKS phosphorylation in PKC-δ KO osteoclasts.
(A) Osteoclasts on bone slices were immunofluorescently stained with Rhodamine Phalloidin, anti-α-tubulin, and Hoechst to visualize F-actin, α-tubulin and DNA by confocal microscopy. Scale bar represents 100 μm. (B) Osteoclasts were treated with Acridine Orange, which displays green fluorescence at neutral pH. Acridine Orange green fluorescence intensity was measured in a fluorescence microplate reader. Bar charts represent mean ± standard deviation. Experiments were performed in triplicate. n.s., no significance (p-value>0.05). (C) Osteoclasts on bone slices were immunofluorescently stained pMARCKS, Rhodamine Phalloidin and DAPI to examine the phosphorylation levels of MARCKS by confocal microscopy. Scale bar represents 20 μm.

Similar articles

Cited by

References

    1. Kular J, Tickner J, Chim SM, Xu J (2012) An overview of the regulation of bone remodelling at the cellular level. Clinical Biochemistry 45: 863–873. - PubMed
    1. Rodan GA, Martin TJ (2000) Therapeutic Approaches to Bone Diseases. Science 289: 1508–1514. - PubMed
    1. Teitelbaum SL (2000) Bone resorption by osteoclasts. Science 289: 1504–1508. - PubMed
    1. Arai F, Miyamoto T, Ohneda O, Inada T, Sudo T, et al. (1999) Commitment and Differentiation of Osteoclast Precursor Cells by the Sequential Expression of c-Fms and Receptor Activator of Nuclear Factor {kappa}B (RANK) Receptors. J Exp Med 190: 1741–1754. - PMC - PubMed
    1. Yasuda H, Shima N, Nakagawa N, Yamaguchi K, Kinosaki M, et al. (1998) Osteoclast differentiation factor is a ligand for osteoprotegerin/osteoclastogenesis-inhibitory factor and is identical to TRANCE/RANKL. PNAS 95: 3597–3602. - PMC - PubMed

Publication types

MeSH terms

LinkOut - more resources