

Influence of vectors' risk-spreading strategies and environmental stochasticity on the epidemiology and evolution of vector-borne diseases: the example of Chagas' disease
- PMID: 23951018
- PMCID: PMC3738595
- DOI: 10.1371/journal.pone.0070830
Influence of vectors' risk-spreading strategies and environmental stochasticity on the epidemiology and evolution of vector-borne diseases: the example of Chagas' disease
Abstract
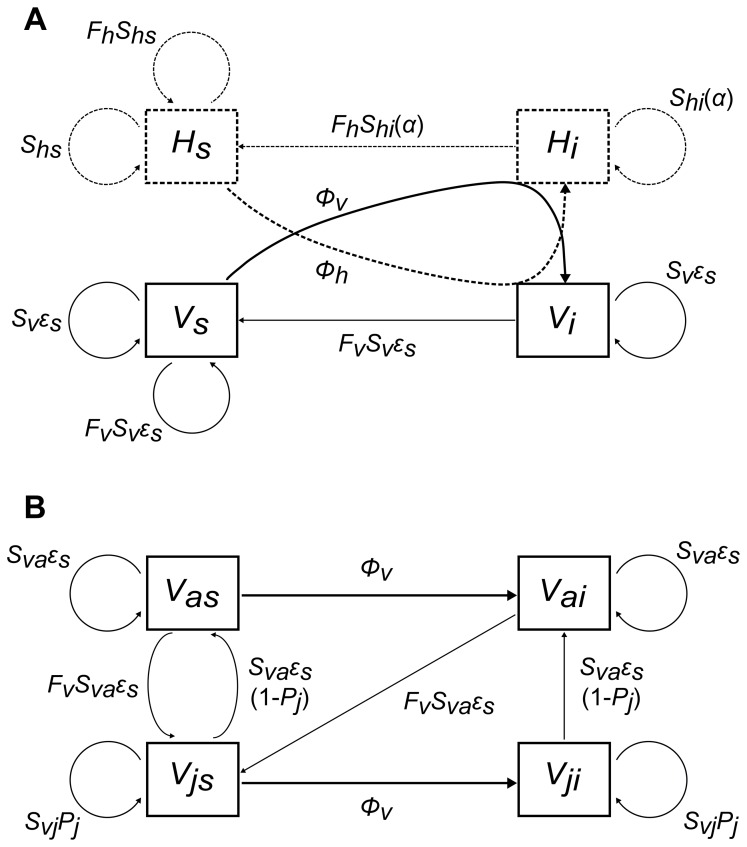
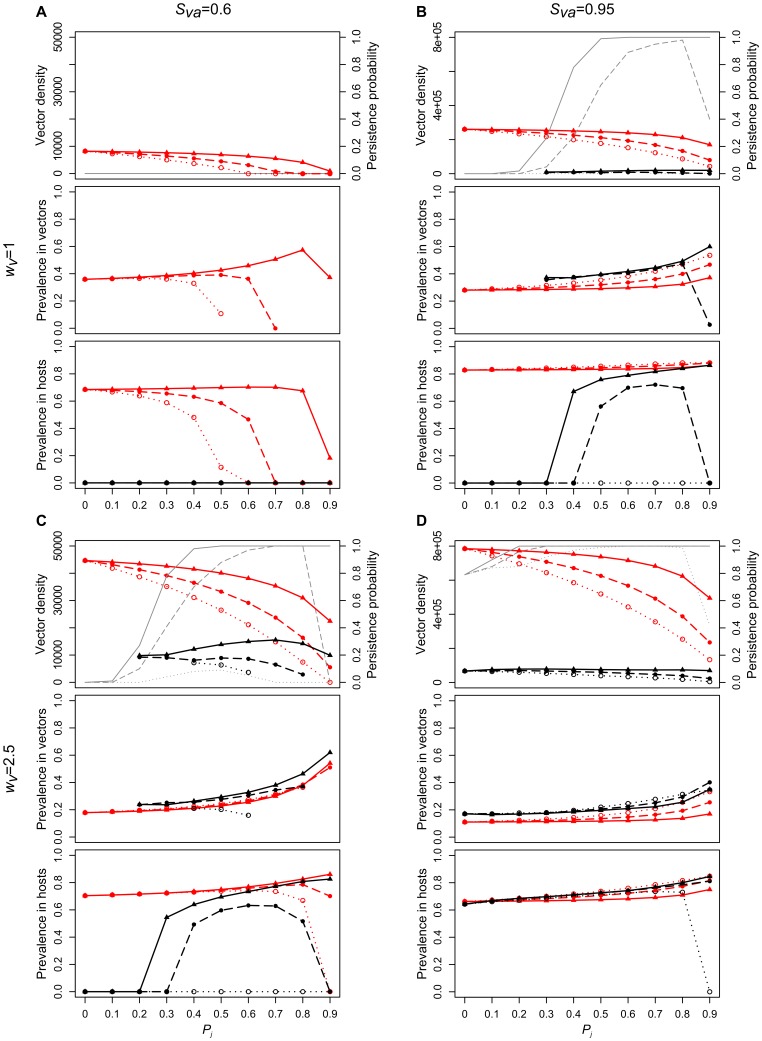
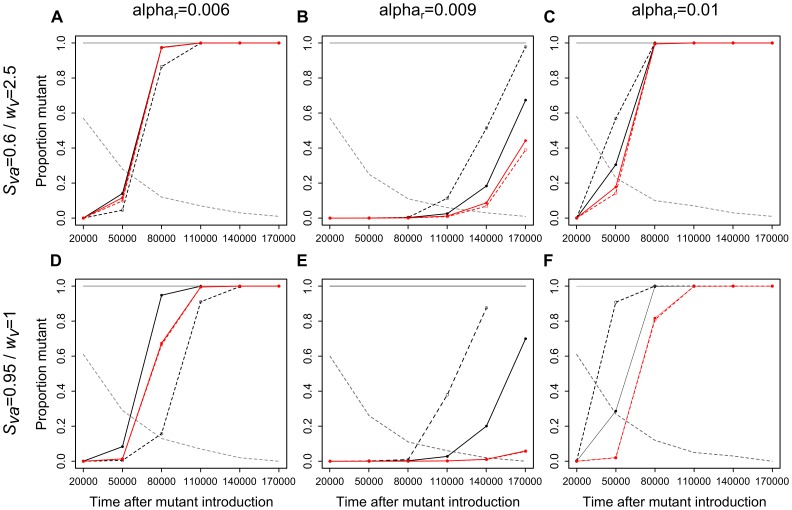
Insects are known to display strategies that spread the risk of encountering unfavorable conditions, thereby decreasing the extinction probability of genetic lineages in unpredictable environments. To what extent these strategies influence the epidemiology and evolution of vector-borne diseases in stochastic environments is largely unknown. In triatomines, the vectors of the parasite Trypanosoma cruzi, the etiological agent of Chagas' disease, juvenile development time varies between individuals and such variation most likely decreases the extinction risk of vector populations in stochastic environments. We developed a simplified multi-stage vector-borne SI epidemiological model to investigate how vector risk-spreading strategies and environmental stochasticity influence the prevalence and evolution of a parasite. This model is based on available knowledge on triatomine biodemography, but its conceptual outcomes apply, to a certain extent, to other vector-borne diseases. Model comparisons between deterministic and stochastic settings led to the conclusion that environmental stochasticity, vector risk-spreading strategies (in particular an increase in the length and variability of development time) and their interaction have drastic consequences on vector population dynamics, disease prevalence, and the relative short-term evolution of parasite virulence. Our work shows that stochastic environments and associated risk-spreading strategies can increase the prevalence of vector-borne diseases and favor the invasion of more virulent parasite strains on relatively short evolutionary timescales. This study raises new questions and challenges in a context of increasingly unpredictable environmental variations as a result of global climate change and human interventions such as habitat destruction or vector control.
Conflict of interest statement
Figures
Similar articles
-
The role of the ratio of vector and host densities in the evolution of transmission modes in vector-borne diseases. The example of sylvatic Trypanosoma cruzi.J Theor Biol. 2012 Nov 7;312:133-42. doi: 10.1016/j.jtbi.2012.07.028. Epub 2012 Aug 7. J Theor Biol. 2012. PMID: 22892441
-
Panstrongylus geniculatus and four other species of triatomine bug involved in the Trypanosoma cruzi enzootic cycle: high risk factors for Chagas' disease transmission in the Metropolitan District of Caracas, Venezuela.Parasit Vectors. 2014 Dec 23;7:602. doi: 10.1186/s13071-014-0602-7. Parasit Vectors. 2014. PMID: 25532708 Free PMC article.
-
An epidemiological model for the dynamics of Chagas' disease.Biosystems. 1991;26(2):127-34. doi: 10.1016/0303-2647(91)90043-k. Biosystems. 1991. PMID: 1841638
-
Interactions between intestinal compounds of triatomines and Trypanosoma cruzi.Trends Parasitol. 2010 Oct;26(10):499-505. doi: 10.1016/j.pt.2010.07.003. Trends Parasitol. 2010. PMID: 20801082 Review.
-
Triatominae-Trypanosoma cruzi/T. rangeli: Vector-parasite interactions.Acta Trop. 2009 May-Jun;110(2-3):137-47. doi: 10.1016/j.actatropica.2008.10.001. Epub 2008 Oct 15. Acta Trop. 2009. PMID: 18992212 Review.
Cited by
-
Increased mortality attributed to Chagas disease: a systematic review and meta-analysis.Parasit Vectors. 2016 Jan 27;9:42. doi: 10.1186/s13071-016-1315-x. Parasit Vectors. 2016. PMID: 26813568 Free PMC article.
-
Evolutionary ecology of Chagas disease; what do we know and what do we need?Evol Appl. 2017 Dec 25;11(4):470-487. doi: 10.1111/eva.12582. eCollection 2018 Apr. Evol Appl. 2017. PMID: 29636800 Free PMC article. Review.
-
A spatially explicit metapopulation model and cattle trade analysis suggests key determinants for the recurrent circulation of rift valley Fever virus in a pilot area of madagascar highlands.PLoS Negl Trop Dis. 2014 Dec 4;8(12):e3346. doi: 10.1371/journal.pntd.0003346. eCollection 2014 Dec. PLoS Negl Trop Dis. 2014. PMID: 25474116 Free PMC article.
-
Competition, virulence, host body mass and the diversification of macro-parasites.J R Soc Interface. 2014 Feb 12;11(93):20131108. doi: 10.1098/rsif.2013.1108. Print 2014 Apr 6. J R Soc Interface. 2014. PMID: 24522783 Free PMC article.
-
Trypanosoma cruzi transmission dynamics in a synanthropic and domesticated host community.PLoS Negl Trop Dis. 2019 Dec 13;13(12):e0007902. doi: 10.1371/journal.pntd.0007902. eCollection 2019 Dec. PLoS Negl Trop Dis. 2019. PMID: 31834879 Free PMC article.
References
-
- Tuljapurkar SD, Orzack SH (1980) Population dynamics in variable environments. I. Long-run growth rates and extinction. Theor Popul Biol 18: 314–342.
-
- Yoshimura J, Clark CW (1993) Adaptation in stochastic environments. Berlin: Springer. 193 p.
-
- Lande R (1988) Genetics and demography in biological conservation. Science 241: 1455–1460. - PubMed
-
- Tauber MJ, Tauber CA, Masaki S (1986) Seasonal adaptations of insects. New York: Oxford University Press.
-
- Danks HV (1987) Insect dormancy: an ecological perspective. Ottawa: The biological survey of Canada (terrestrial arthropods).
Publication types
MeSH terms
LinkOut - more resources
Full Text Sources
Other Literature Sources
Medical
