

Evaluating Alzheimer's disease progression using rate of regional hippocampal atrophy
- PMID: 23951142
- PMCID: PMC3741167
- DOI: 10.1371/journal.pone.0071354
Evaluating Alzheimer's disease progression using rate of regional hippocampal atrophy
Abstract
Alzheimer's disease (AD) is characterized by neurofibrillary tangle and neuropil thread deposition, which ultimately results in neuronal loss. A large number of magnetic resonance imaging studies have reported a smaller hippocampus in AD patients as compared to healthy elderlies. Even though this difference is often interpreted as atrophy, it is only an indirect measurement. A more direct way of measuring the atrophy is to use repeated MRIs within the same individual. Even though several groups have used this appropriate approach, the pattern of hippocampal atrophy still remains unclear and difficult to relate to underlying pathophysiology. Here, in this longitudinal study, we aimed to map hippocampal atrophy rates in patients with AD, mild cognitive impairment (MCI) and elderly controls. Data consisted of two MRI scans for each subject. The symmetric deformation field between the first and the second MRI was computed and mapped onto the three-dimensional hippocampal surface. The pattern of atrophy rate was similar in all three groups, but the rate was significantly higher in patients with AD than in control subjects. We also found higher atrophy rates in progressive MCI patients as compared to stable MCI, particularly in the antero-lateral portion of the right hippocampus. Importantly, the regions showing the highest atrophy rate correspond to those that were described to have the highest burden of tau deposition. Our results show that local hippocampal atrophy rate is a reliable biomarker of disease stage and progression and could also be considered as a method to objectively evaluate treatment effects.
Conflict of interest statement
Figures
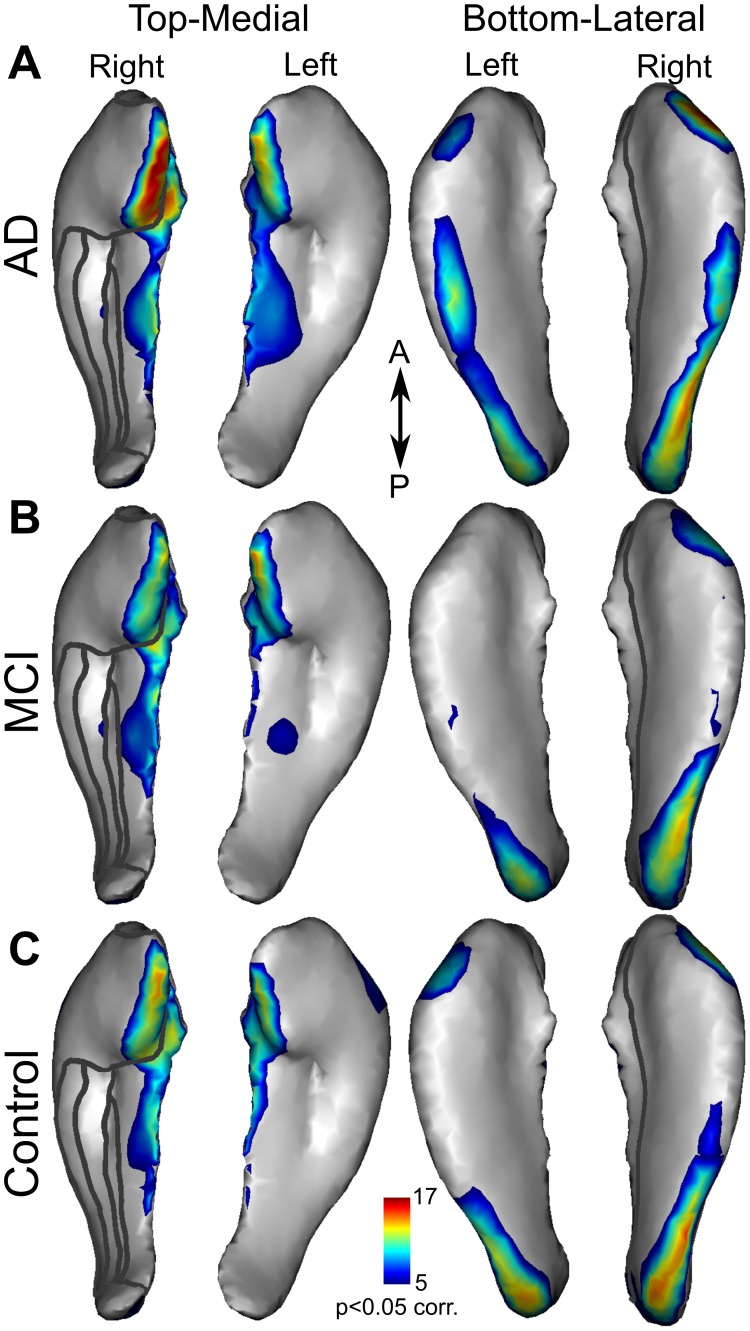
 0.05 corr.) atrophy rates for the left and right hippocampi in patients with AD (A), MCI (B) and controls (C). Significance level (p
 0.05 corr.) is indicated in the colour bar.
 0.05 corr.) is indicated in the colour bar.
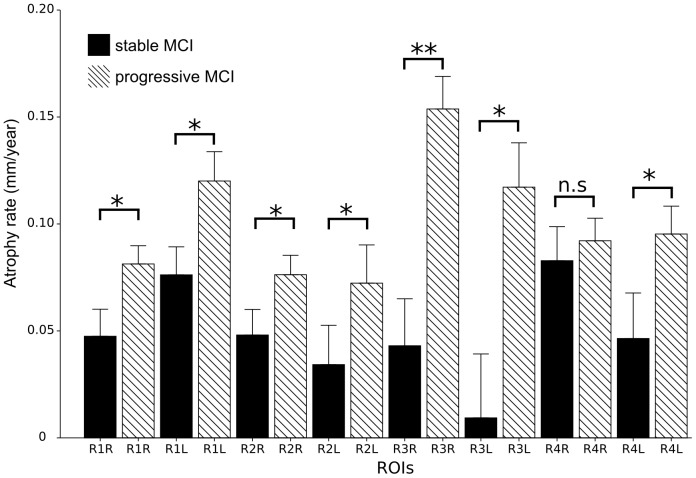
 0.05, **: p
 0.001 Bonferroni adjusted p-values.
References
-
- Cummings JL (2004) Treatment of alzheimer’s disease: current and future therapeutic approaches. Rev Neurol Dis 1: 60–9. - PubMed
-
- McKhann G, Drachman D, Folstein M, Katzman R, Price D, et al. (1984) Clinical diagnosis of alzheimer’s disease: report of the nincds-adrda work group under the auspices of department of health and human services task force on alzheimer’s disease. Neurology 34: 939–44. - PubMed
-
- Braak H, Braak E, Bohl J (1993) Staging of alzheimer-related cortical destruction. Eur Neurol 33: 403–8. - PubMed
-
- Braak H, Braak E (1995) Staging of alzheimer’s disease-related neurofibrillary changes. Neurobiol Aging 16: 271–8; discussion 278–84. - PubMed
Publication types
MeSH terms
Grants and funding
LinkOut - more resources
Full Text Sources
Other Literature Sources
Medical
