. 2013 Aug 12;8(8):e71773.
doi: 10.1371/journal.pone.0071773. eCollection 2013.

Metformin protects rat hepatocytes against bile acid-induced apoptosis

Affiliations

Metformin protects rat hepatocytes against bile acid-induced apoptosis

Titia E Woudenberg-Vrenken et al. PLoS One. .

Abstract

Background: Metformin is used in the treatment of Diabetes Mellitus type II and improves liver function in patients with non-alcoholic fatty liver disease (NAFLD). Metformin activates AMP-activated protein kinase (AMPK), the cellular energy sensor that is sensitive to changes in the AMP/ATP-ratio. AMPK is an inhibitor of mammalian target of rapamycin (mTOR). Both AMPK and mTOR are able to modulate cell death.

Aim: To evaluate the effects of metformin on hepatocyte cell death.

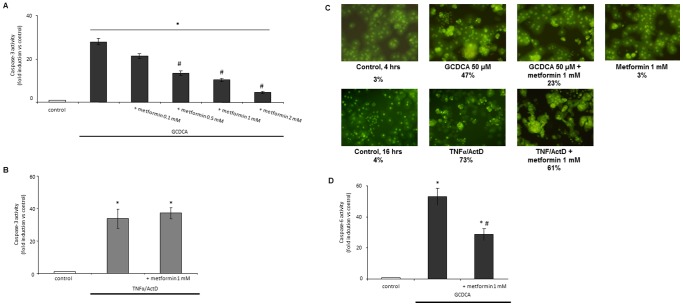
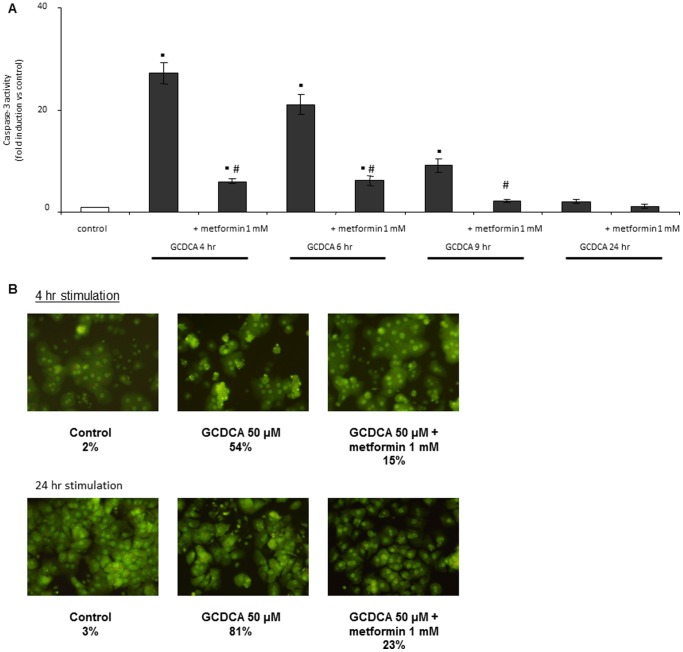
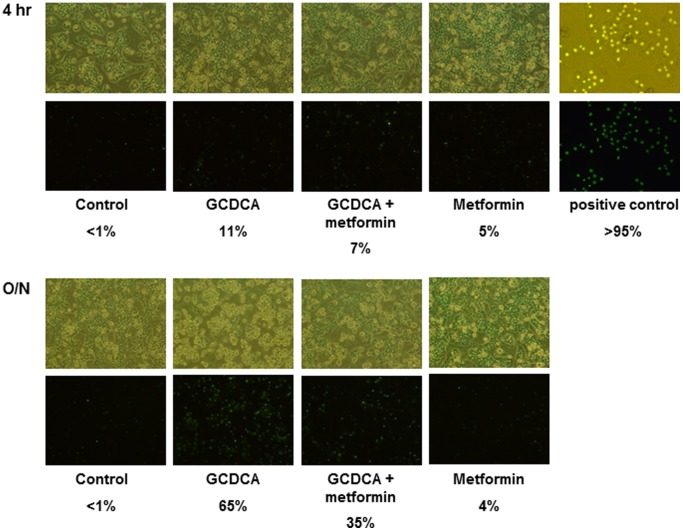
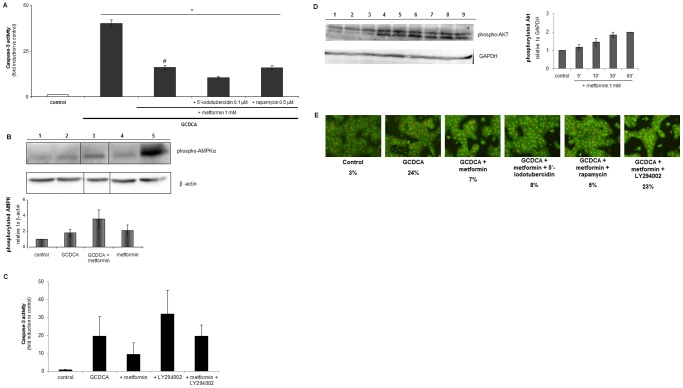
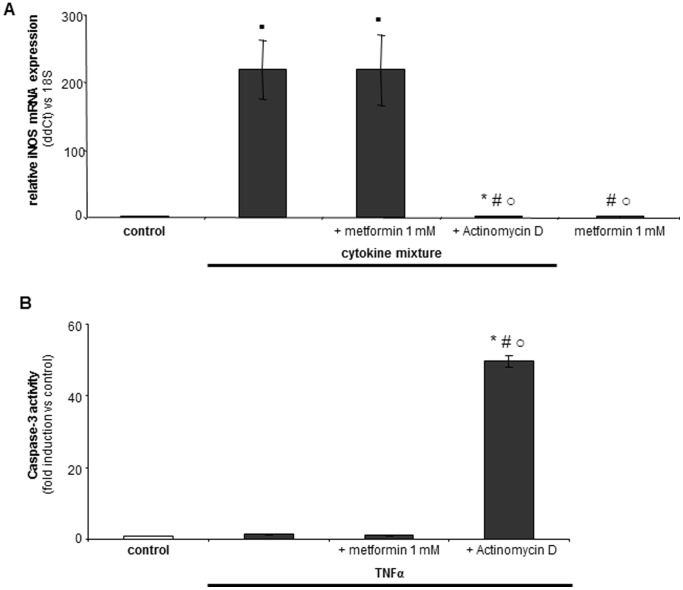
Methods: Apoptotic cell death was induced in primary rat hepatocytes using either the bile acid glycochenodeoxycholic acid (GCDCA) or TNFα in combination with actinomycin D (actD). AMPK, mTOR and phosphoinositide-3 kinase (PI3K)/Akt were inhibited using pharmacological inhibitors. Apoptosis and necrosis were quantified by caspase activation, acridine orange staining and Sytox green staining respectively.

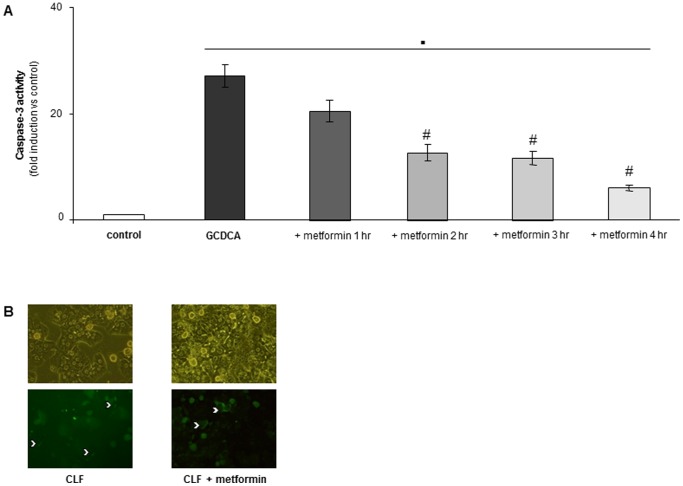
Results: Metformin dose-dependently reduces GCDCA-induced apoptosis, even when added 2 hours after GCDCA, without increasing necrotic cell death. Metformin does not protect against TNFα/ActD-induced apoptosis. The protective effect of metformin is dependent on an intact PI3-kinase/Akt pathway, but does not require AMPK/mTOR-signaling. Metformin does not inhibit NF-κB activation.

Conclusion: Metformin protects against bile acid-induced apoptosis and could be considered in the treatment of chronic liver diseases accompanied by inflammation.


Conflict of interest statement

Competing Interests: The authors have declared that no competing interests exist.

Figures

Figure 1
Figure 1. Metformin dose-dependently reduces bile acid-induced caspase-3 activity, but not TNFα/ActD-induced apoptosis.
Primary rat hepatocytes were exposed to metformin (0.1–2 mmol/L) added 10 minutes prior to (A) GCDCA (50 µmol/L, 4 hrs) or (B) TNFα/ActD (20 ng/ml, 200 ng/ml, 16 hrs). Caspase-3 like activity is shown as fold induction compared to control values; control values were set at one. (C) Metformin prevents GCDCA (4 hrs) induced nuclear condensation as demonstrated by acridine orange staining, but has no effect on TNFα/ActD (16 hrs) induced nuclear condensation. Percentages represent condensed nuclei. Magnification 20X. (D) Metformin also reduces GCDCA-induced caspase-6 activity. Caspase-6 like activity was measured in primary rat hepatocytes exposed to GCDCA (50 µmol/L, 4 hrs) and/or metformin (1 mmol/L) and is shown as fold induction compared to control values; control values were set at one. N = 4 for each experiment. Statistical analysis: * p<0.05 or ▪ p<0.01 compared to control. # p<0.05 compared to GCDCA-treated cells.
Figure 2
Figure 2. Metformin does not delay bile acid-induced apoptosis.
Primary rat hepatocytes were exposed to GCDCA (50 µmol/L) without or in combination with metformin for 4, 6, 9 and 24 hrs. Metformin (1 mmol/L) was added 10 minutes before GCDCA. Control cells are rat hepatocytes not treated with GCDCA or metformin. At the indicated time points, cells were analyzed for (A) caspase-3 like activity, or (B) nuclear condensation as indicated by acridine orange staining and expressed as % condensed nuclei. Magnification 20X. N = 4 for each experiment. Statistical analysis: ▪ p<0.01 compared to control. # p<0.05 compared to GCDCA-treated cells at the corresponding time-point.
Figure 3
Figure 3. Metformin protects primary hepatocytes against apoptosis when added after GCDCA, but not by inhibiting bile acid uptake.
Rat hepatocytes were treated without (control) or with GCDCA (50 µmol/L) for 4 hrs (A). GCDCA-treated hepatocytes were co-incubated with metformin (1 mmol/L) for 1–4 hrs. A longer incubation time with metformin is visualized in the graph by a color change from dark grey to white. Caspase-3 like activity was measured and is shown as fold induction compared to control values; control values were set at one. N = 4. Statistical analysis: ▪ p<0.01 compared to control. # p<0.05 compared to GCDCA-treated cells. The protective effect of metformin is not caused by reduced uptake of GCDCA (B). Primary rat hepatocytes were exposed to the fluorescent bile acid CLF (2 µmol/L) for 1 hr. Metformin (1 mmol/L) was added 10 minutes prior to CLF. Uptake of CLF by hepatocytes was visualized by fluorescent microscopy. N = 3. Representative images 1 hr after incubation are shown. White arrow: CLF uptake in the bile canaliculi. Upper panel: phase contrast. Lower panel: fluorescence. Magnification 20X.
Figure 4
Figure 4. Metformin reduces apoptosis without increasing necrotic cell death.
Cells were exposed to GCDCA (50 µmol/L) for 4–16 hrs. Metformin (1 mmol/L) was added 10 minutes before addition of GCDCA. Cells stimulated with H2O2 (5 mmol/L, 6 hrs) were used as positive control. Sytox green nuclear staining was used to determine necrotic cell death. N = 5. Representative images 4 hrs and 16 hrs after stimulation are shown, percentages in panels indicate % of necrotic cells. Upper panel: phase contrast. Lower panel: fluorescence. Magnification 10X.
Figure 5
Figure 5. The protective effect of metformin involves the PI3-kinase/Akt pathway, but not the AMPK/mTOR pathway.
(A) Primary rat hepatocytes were exposed to GCDCA (50 µmol/L) and metformin (1 mmol/L) for 4 hrs with or without 5′-iodotubercidin (0.1 µmol/L), an inhibitor of AMP-activated protein kinase, and the mTOR inhibitor rapamycin (0.5 µmol/L). Caspase-3 like activity is presented as fold induction compared to control values; control values were set at one. Data are presented as mean of at least three independent experiments +/−S.E.M. Statistical analysis: * p<0.05 compared to control. # p<0.05 compared to GCDCA-treated cells. (B) Western blot analysis for AMPK phosphorylation on cell lysates (45 µl). Lane 1: control hepatocytes; lane 2: GCDCA treated cells (50 µmol/L, 1 hr); lane 3: GCDCA plus metformin (1 mmol/L); lane 4: metformin (1 mmol/L); lane 5: positive control: hepatocytes exposed to the known AMPK activator AICAR (250 µmol/L, 1 hr). All lanes are obtained from the same membrane with the same detection reagent and exposure time. Western blots were quantified and band intensities of phosphorylated AMPKα were expressed as ratio of the intensity of β-actin protein levels. Data are presented as mean of at least three experiments +/− S.E.M. Control values were set at one. A representative Western blot is shown. (C) Caspase-3 activity of heptacoytes exposed to GCDCA (50 µmol/L) for 4 hrs and metformin (1 mmol/) with or without LY294002 (50 µmol/L). Caspase-3 like activity is presented as fold induction compared to control values. Control values were set at one. Data are presented as mean of at least three independent experiments +/− S.E.M. (D) Western blot analysis for Akt phosphorylation on cell lysates (45 µl). Left side. Lane 1: control hepatocytes; lane 2, 3: metformin (1 mmol/L) 5 minutes exposed cells; lane 4, 5: metformin 10 minutes exposed cells; lane 6, 7: metformin 30 minutes exposed cells; lane 8, 9: metformin 60 minutes exposed cells. Western blots were quantified and band intensities of phosphorylated Akt were expressed as ratio of the intensity of GAPDH protein levels (Right side). Data are presented as mean of at least three independent experiments +/− S.E.M. Control values were set at one. A representative Western blot is shown. (E) Cells were exposed to GCDCA (50 µmol/L) for 4 hrs with or without metformin (1 mmol/L), 5′-iodotubercidin (0.1 µmol/L), rapamycin (0.5 µmol/L), or LY294002 (50 µmol/L). Nuclear condensation as indicated by acridine orange staining is shown, and expressed as % condensed nuclei. Magnification 20X. Representative images are shown. N = 4 for each experiment (A–E).
Figure 6
Figure 6. Metformin does not inhibit NF-κB activation.
qPCR analysis for iNOS using cDNA of primary rat hepatocytes exposed for 4 hrs to cytokine mixture with or without 1 mmol/L metformin. The transcriptional inhibitor actinomycin D (200 ng/ml) served as positive control for NF-κB inhibition. (A). Metformin does not reduce cytokine mixture induced iNOS mRNA expression. (B) Metformin does not sensitize hepatocytes to TNFα-induced apoptosis. Caspase-3 like activity was measured in primary rat hepatocytes exposed to TNFα (20 ng/ml, 16 hrs) with or without metformin (1 mmol/L) or actinomycin D (200 ng/ml, positive control for induction of TNFα-induced caspase-3 activity). Caspase-3 activity is shown as fold induction compared to control values; control values were set at one. N = 5 for each experiment. Statistical analysis: Fig. 6A * p<0.05 or ▪ p<0.01 compared to control. # p<0.01 compared to cytokine mixture-treated cells. ○ p<0.01 compared to cytokine mixture plus metformin-treated cells. Fig. 6B * p<0.05 compared to control. # p<0.05 compared to TNFα-treated cells. ○ p<0.05 compared to TNFα plus metformin-treated cells.

Similar articles

Cited by

References

    1. Viollet B, Guigas B, Sanz GN, Leclerc J, Foretz M, et al. (2012) Cellular and molecular mechanisms of metformin: an overview. Clin Sci (Lond) 122: 253–270. - PMC - PubMed
    1. Vuppalanchi R, Chalasani N (2009) Nonalcoholic fatty liver disease and nonalcoholic steatohepatitis: Selected practical issues in their evaluation and management. Hepatology 49: 306–317. - PMC - PubMed
    1. Klein J, Westphal S, Kraus D, Meier B, Perwitz N, et al. (2004) Metformin inhibits leptin secretion via a mitogen-activated protein kinase signalling pathway in brown adipocytes. J Endocrinol 183: 299–307. - PubMed
    1. Mazza A, Fruci B, Garinis GA, Giuliano S, Malaguarnera R, et al. (2012) The role of metformin in the management of NAFLD. Exp Diabetes Res 2012: 716404. - PMC - PubMed
    1. Lin HZ, Yang SQ, Chuckaree C, Kuhajda F, Ronnet G, et al. (2000) Metformin reverses fatty liver disease in obese, leptin-deficient mice. Nature Medicine 6: 998–1003. - PubMed

Publication types

MeSH terms