Transcript profiling identifies iqgap2(-/-) mouse as a model for advanced human hepatocellular carcinoma
- PMID: 23951254
- PMCID: PMC3741273
- DOI: 10.1371/journal.pone.0071826
Transcript profiling identifies iqgap2(-/-) mouse as a model for advanced human hepatocellular carcinoma
Abstract
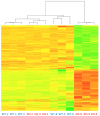
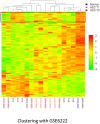
It is broadly accepted that genetically engineered animal models do not always recapitulate human pathobiology. Therefore identifying best-fit mouse models of human cancers that truly reflect the corresponding human disease is of vital importance in elucidating molecular mechanisms of tumorigenesis and developing preventive and therapeutic approaches. A new hepatocellular carcinoma (HCC) mouse model lacking a novel putative tumor suppressor IQGAP2 has been generated by our laboratory. The aim of this study was to obtain the molecular signature of Iqgap2(-/-) HCC tumors and establish the relevance of this model to human disease. Here we report a comprehensive transcriptome analysis of Iqgap2(-/-) livers and a cross-species comparison of human and Iqgap2(-/-) HCC tumors using Significance Analysis of Microarray (SAM) and unsupervised hierarchical clustering analysis. We identified the Wnt/β-catenin signaling pathway as the top canonical pathway dysregulated in Iqgap2(-/-) livers. We also demonstrated that Iqgap2(-/-) hepatic tumors shared genetic signatures with HCC tumors from patients with advanced disease as evidenced by a 78% mouse-to-human microarray data set concordance rate with 117 out of 151 identified ortholog genes having similar expression profiles across the two species. Collectively, these results indicate that the Iqgap2 knockout mouse model closely recapitulates human HCC at the molecular level and supports its further application for the study of this disease.
Conflict of interest statement
Figures


Similar articles
-
IQGAP1 and IQGAP2 are reciprocally altered in hepatocellular carcinoma.BMC Gastroenterol. 2010 Oct 26;10:125. doi: 10.1186/1471-230X-10-125. BMC Gastroenterol. 2010. PMID: 20977743 Free PMC article.
-
Development of hepatocellular carcinoma in Iqgap2-deficient mice is IQGAP1 dependent.Mol Cell Biol. 2008 Mar;28(5):1489-502. doi: 10.1128/MCB.01090-07. Epub 2008 Jan 7. Mol Cell Biol. 2008. PMID: 18180285 Free PMC article.
-
Differential expression of IQGAP1/2 in Hepatocellular carcinoma and its relationship with clinical outcomes.Asian Pac J Cancer Prev. 2014;15(12):4951-6. doi: 10.7314/apjcp.2014.15.12.4951. Asian Pac J Cancer Prev. 2014. PMID: 24998570
-
Integrative analysis of aberrant Wnt signaling in hepatitis B virus-related hepatocellular carcinoma.World J Gastroenterol. 2015 May 28;21(20):6317-28. doi: 10.3748/wjg.v21.i20.6317. World J Gastroenterol. 2015. PMID: 26034368 Free PMC article. Review.
-
Targeting Wnt/β-catenin pathway in hepatocellular carcinoma treatment.World J Gastroenterol. 2016 Jan 14;22(2):823-32. doi: 10.3748/wjg.v22.i2.823. World J Gastroenterol. 2016. PMID: 26811628 Free PMC article. Review.
Cited by
-
Role of IQ Motif-Containing GTPase-Activating Proteins in Hepatocellular Carcinoma.Front Oncol. 2022 Jun 16;12:920652. doi: 10.3389/fonc.2022.920652. eCollection 2022. Front Oncol. 2022. PMID: 35785216 Free PMC article. Review.
-
Protective Effects of Naringin-Dextrin Nanoformula against Chemically Induced Hepatocellular Carcinoma in Wistar Rats: Roles of Oxidative Stress, Inflammation, Cell Apoptosis, and Proliferation.Pharmaceuticals (Basel). 2022 Dec 14;15(12):1558. doi: 10.3390/ph15121558. Pharmaceuticals (Basel). 2022. PMID: 36559011 Free PMC article.
-
SENP3-mediated host defense response contains HBV replication and restores protein synthesis.PLoS One. 2019 Jan 14;14(1):e0209179. doi: 10.1371/journal.pone.0209179. eCollection 2019. PLoS One. 2019. PMID: 30640896 Free PMC article.
-
Long non-coding ribonucleic acid ATP2B1-AS1 modulates endothelial permeability through regulating the miR-4729-IQGAP2 axis in diabetic retinopathy.J Diabetes Investig. 2022 Mar;13(3):443-452. doi: 10.1111/jdi.13740. Epub 2022 Jan 25. J Diabetes Investig. 2022. PMID: 34935307 Free PMC article.
-
Altered methylation of specific DNA loci in the liver of Bhmt-null mice results in repression of Iqgap2 and F2rl2 and is associated with development of preneoplastic foci.FASEB J. 2017 May;31(5):2090-2103. doi: 10.1096/fj.201601169R. Epub 2017 Feb 8. FASEB J. 2017. PMID: 28179424 Free PMC article.
References
-
- Jemal A, Murray T, Ward E, Samuels A, Tiwari RC, et al. (2005) Cancer statistics, 2005. CA Cancer J Clin 55: 10–30. - PubMed
-
- Bruix J, Sherman M (2005) Management of hepatocellular carcinoma. Hepatology 42: 1208–1236. - PubMed
-
- El-Serag HB, Rudolph KL (2007) Hepatocellular carcinoma: epidemiology and molecular carcinogenesis. Gastroenterology 132: 2557–2576. - PubMed
-
- Rangarajan A, Weinberg RA (2003) Opinion: Comparative biology of mouse versus human cells: modelling human cancer in mice. Nat Rev Cancer 3: 952–959. - PubMed
Publication types
MeSH terms
Substances
LinkOut - more resources
Full Text Sources
Other Literature Sources
Medical
Molecular Biology Databases

