. 2013 Jun 3;2(8):845-54.
doi: 10.1242/bio.20134614. eCollection 2013 Aug 15.

Non-directional radial intercalation dominates deep cell behavior during zebrafish epiboly

Affiliations

Non-directional radial intercalation dominates deep cell behavior during zebrafish epiboly

Robert Bensch et al. Biol Open. .

Abstract

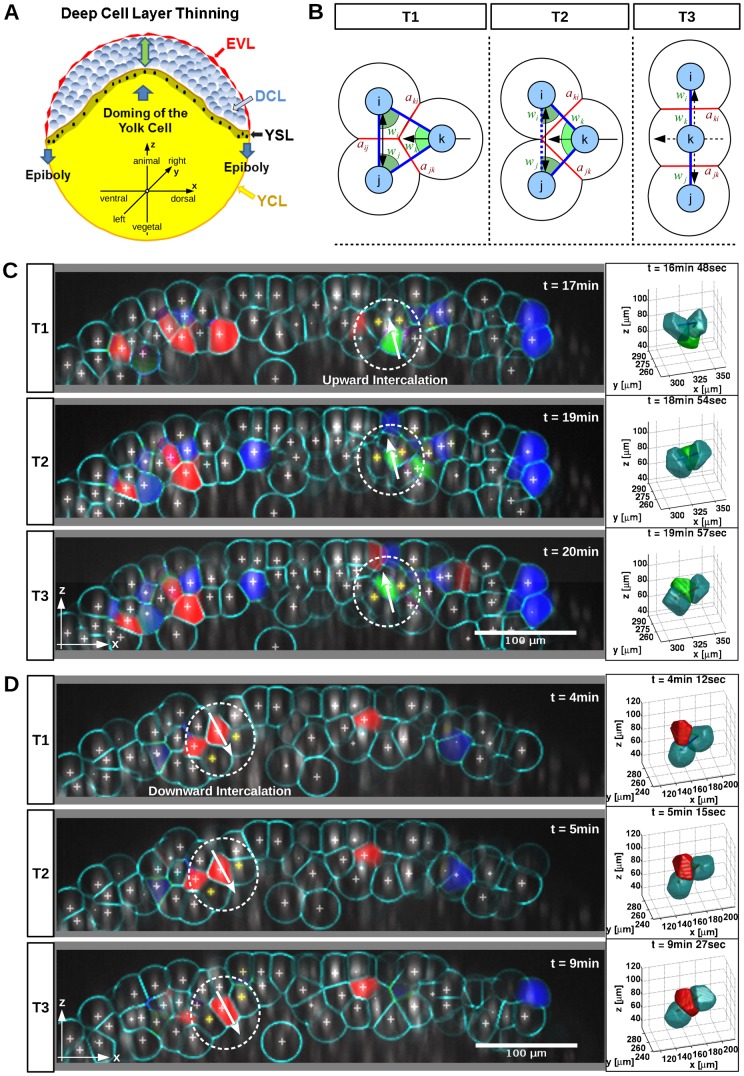
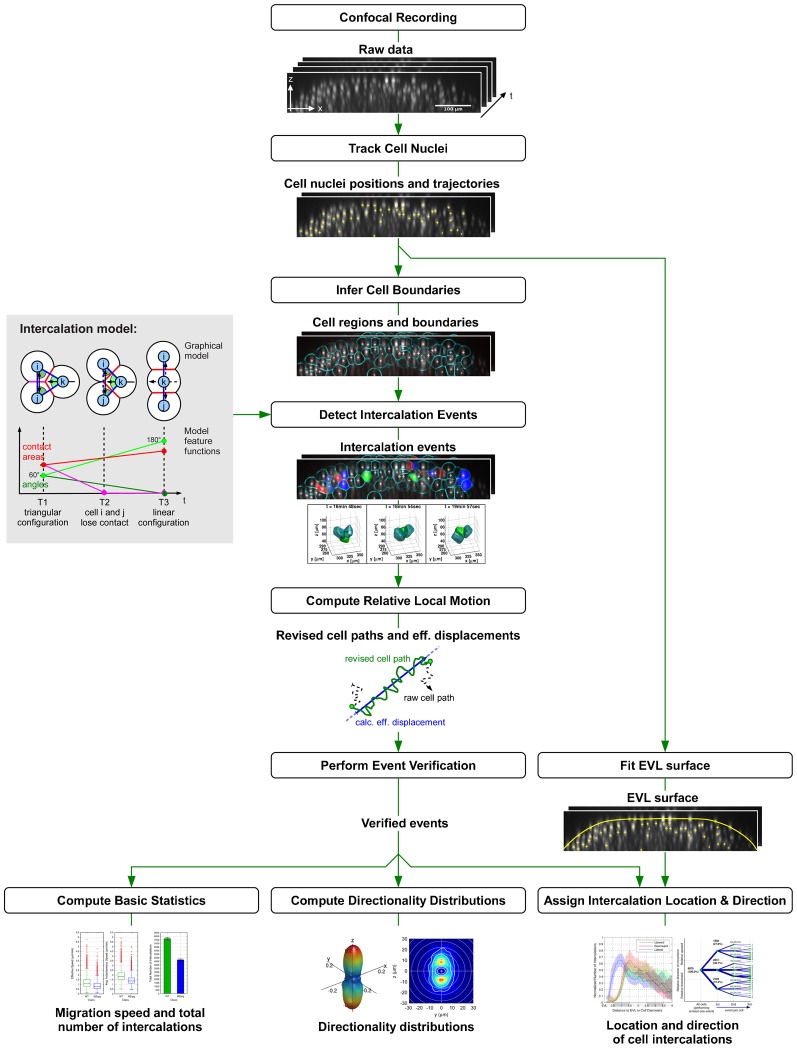
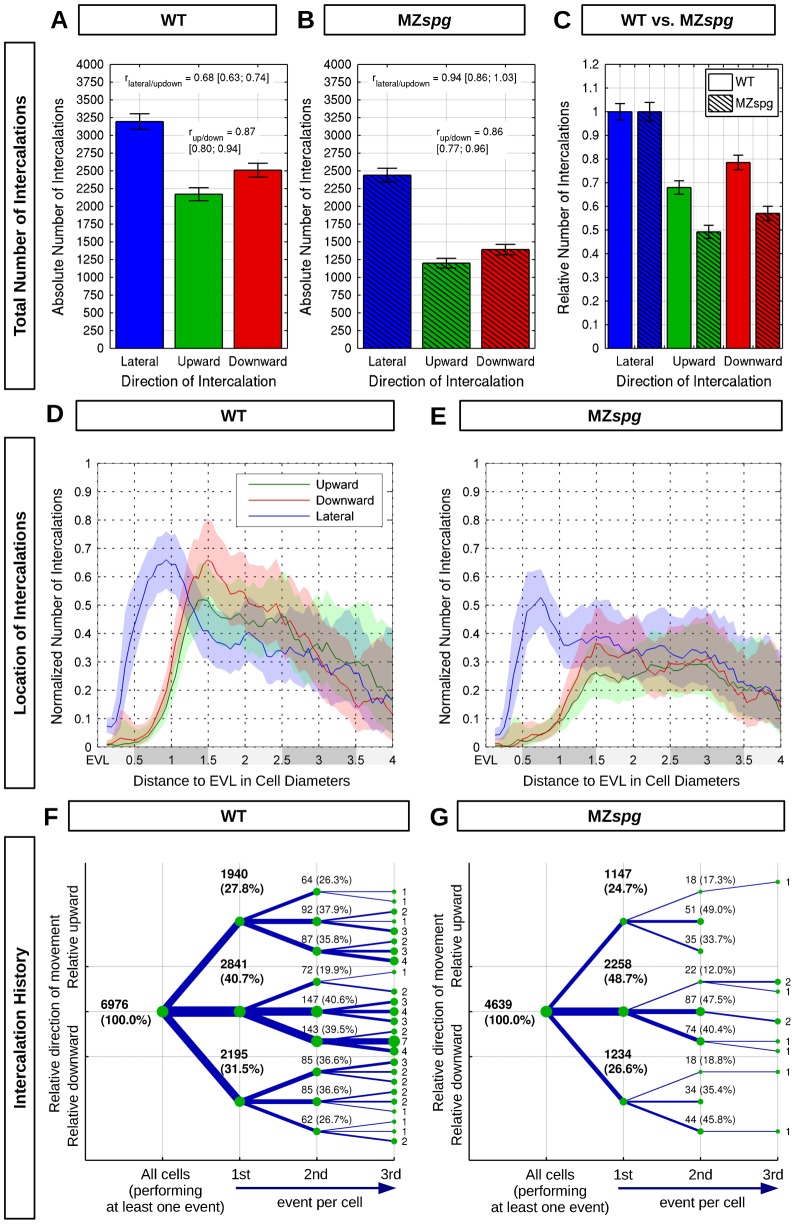
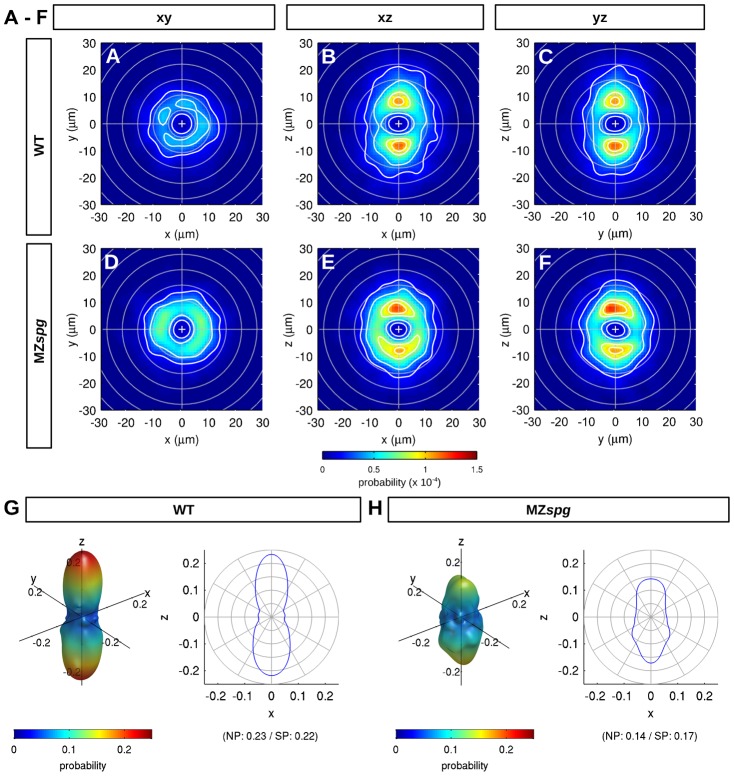
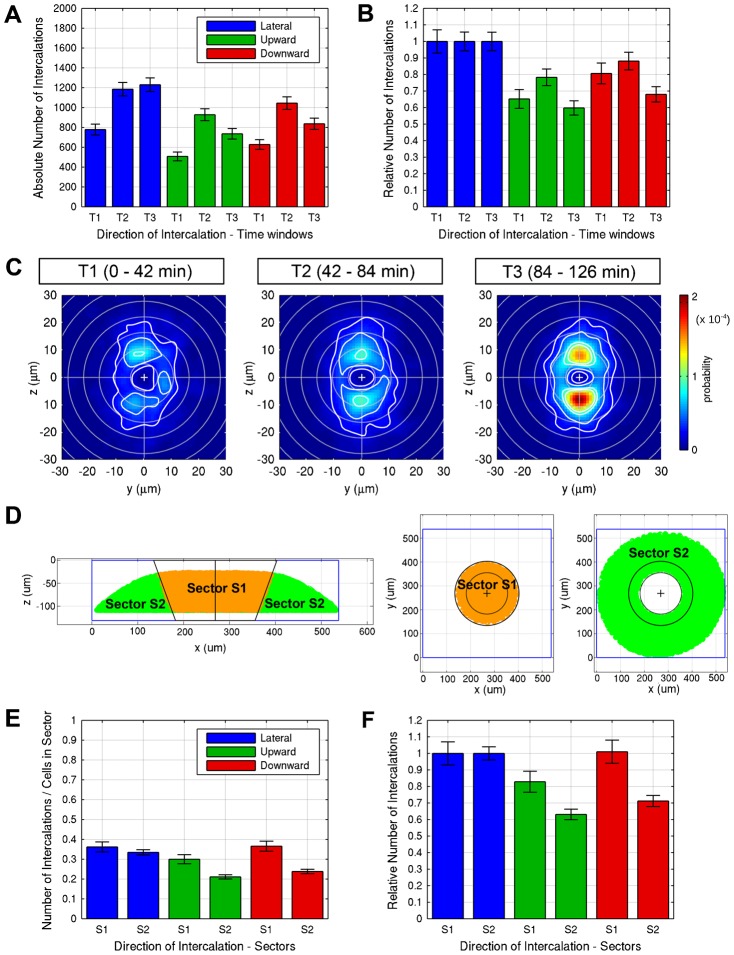
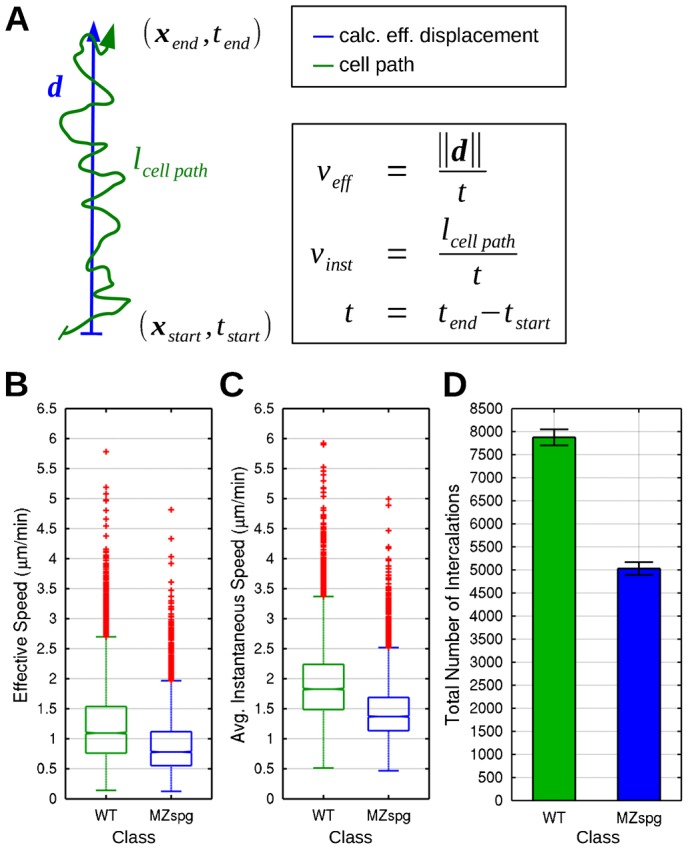
Epiboly is the first coordinated cell movement in most vertebrates and marks the onset of gastrulation. During zebrafish epiboly, enveloping layer (EVL) and deep cells spread over the vegetal yolk mass with a concomitant thinning of the deep cell layer. A prevailing model suggests that deep cell radial intercalations directed towards the EVL would drive deep cell epiboly. To test this model, we have globally recorded 3D cell trajectories for zebrafish blastomeres between sphere and 50% epiboly stages, and developed an image analysis framework to determine intercalation events, intercalation directionality, and migration speed for cells at specific positions within the embryo. This framework uses Voronoi diagrams to compute cell-to-cell contact areas, defines a feature-based spatio-temporal model for intercalation events and fits an anatomical coordinate system to the recorded datasets. We further investigate whether epiboly defects in MZspg mutant embryos devoid of Pou5f1/Oct4 may be caused by changes in intercalation behavior. In wild-type and mutant embryos, intercalations orthogonal to the EVL occur with no directional bias towards or away from the EVL, suggesting that there are no directional cues that would direct intercalations towards the EVL. Further, we find that intercalation direction is independent of the previous intercalation history of individual deep cells, arguing against cues that would program specific intrinsic directed migration behaviors. Our data support a dynamic model in which deep cells during epiboly migrate into space opening between the EVL and the yolk syncytial layer. Genetic programs determining cell motility may control deep cell dynamic behavior and epiboly progress.

Keywords: Epiboly; Gastrulation; Pou5f1; Radial intercalation.


Conflict of interest statement

Competing Interests: The authors have no competing interests to declare.

Figures

Fig. 1.
Fig. 1.. Automated detection of intercalating zebrafish blastomeres.
(A) Schematic view of DCL thinning and epiboly during zebrafish early gastrulation with coordinate systems used. (B) Three-stage (T1 to T3) model of cell intercalation for point triple analysis. The cell located in the center (k) intercalates between the neighboring cells (i and j). Pairwise distances (blue), enclosing angles (green) and contact areas (red). (C,D) Computational detection and classification of radial intercalations from 3D time-lapse recording (supplementary material Movies 1, 2). Embryo stages: sphere to 50% epiboly. The rendering shows lateral views (animal pole at top) with raw nuclei fluorescence (grey), tracked nuclei positions (crosses) and calculated cell boundaries (cyan). Arrows indicate direction of cell migration. Upward (green), downward (red), and lateralward intercalations (blue) were detected along an 18 µm thick animal–vegetal oriented sheet transecting the embryo along its dorsoventral axis (shown here as y-projection representing 18 µm orthogonal to the z-stack). In the circled areas, a blastomere intercalates between two neighboring cells (yellow crosses) located in adjacent more exterior level (C) or in adjacent more interior level (D). These two groups of cells were separately rendered in 3D (right). Scale bars: 100 µm.
Fig. 2.
Fig. 2.. Workflow of image analysis.
The workflow of image analysis is schematically presented: starting at the raw data input (top) the successive steps performing image analysis and data evaluations are presented. Details on the algorithms can be found in the Materials and Methods section with the same text headings. In the data flow intermediate results are illustrated that serve as input for the subsequent algorithm. Final results are presented at the bottom.
Fig. 3.
Fig. 3.. Quantification of radial and lateral intercalation events.
(A,B) Absolute number of lateralward, upward, and downward intercalations in WT and MZspg (summed over 6 embryos for WT and MZspg each). Ratios between up- and downward, and between lateral and up-/downward intercalations are shown in each graph. (C) Relative number of upward or downward intercalations normalized to the number of lateralward intercalations. (D,E) Quantification of WT (D) and MZspg (E) blastomeres performing upward, downward, or lateralward intercalations in each depth level. Depth levels (shaded grey along x-axis) were numbered and distance was measured starting from the EVL in vegetal direction. To be able to compare different depth levels, the absolute number of intercalations (summed over 6 embryos for WT and MZspg each; supplementary material Fig. S1) was normalized by the total number of cells observed for each distance. The x-axis is truncated at 4.0, where the number of measured intercalations becomes too small to provide meaningful results. (F,G) Summarized intercalation history of all individual cells (sum over six embryos for each genotype). The graph presents up to three successive intercalations of individual blastomeres, indicating upward, downward, or lateralward directions. The root node (leftmost) denotes all cells performing the first intercalation event. The absolute number and relative fraction of intercalations is given at each node. Errors are given by 95% confidence intervals assuming Poisson noise.
Fig. 4.
Fig. 4.. Motion directionality of intercalation events.
(A–F) Average motion directionality analyzed for WT (A–C) and MZspg (D–F) mbryos. The occurrence probability for an intercalation with certain migration direction and displacement is indicated by color. Isocontours (white) denote lines of equal probability. Cross-sections of 3D directionality distributions are given: x–y plane (A,D), perpendicular to animal–vegetal axis, x–z plane (B,E) and y–z plane (C,F), perpendicular to left–right and dorsoventral axis, respectively. (G,H) 3D reconstruction of the average motion directionality for WT (G) and MZspg (H) embryos (modeled by spherical harmonics of degree l = 0…10). (Left) 3D rendering visualizing occurrence probability of intercalation directions using both color (blue = low and red = high probability) and shape (extension in each direction corresponds to probability). (Right) 2D plot visualizing occurrence probability of intercalation directions averaged along the latitudes. (P<0.01; n = 6 embryos each WT and MZspg).
Fig. 5.
Fig. 5.. Analysis of spatial and temporal patterns of intercalation.
(A,B) Absolute number (A) of lateralward, upward, and downward intercalations in WT for the time windows T1 (0–42 min), T2 (42–84 min), and T3 (84–126 min). The data are summed over 6 embryos each. (B) Relative number of upward or downward intercalations in each time window normalized to the number of lateralward intercalations. (C) Average motion directionality analyzed for WT embryos for each of the time windows T1 to T3. The occurrence probability for an intercalation with certain migration direction and displacement is indicated by color. Isocontours (white) denote lines of equal probability. Cross-sections of 3D directionality distributions are given for the y–z plane. (D) To analyze potential differences in intercalation behavior between an inner sector located centrally at the animal pole and an outer sector encompassing more marginal and vegetal cells, the 3D space of the image data stack was separated into an inner sector S1 (orange) and an outer sector S2 (green), visualized in lateral (left) and animal pole views (right).(E,F) Number (E) of lateralward, upward, and downward intercalations in WT for the sectors S1 and S2 normalized by the number of cells for each sector. The data are summed over 6 embryos each. (F) Relative number of upward or downward intercalations in each sector normalized to the number of lateralward intercalations.
Fig. 6.
Fig. 6.. Migration speed of intercalating cells.
(AC) Radial intercalation dynamics. The effective and average instantaneous speeds of intercalating blastomeres were quantified. (A) Schematic drawing of cell path (green) and calculated effective displacement (blue) during intercalation. Calculation and comparison of effective (B) and average instantaneous speed (C) for WT and MZspg embryos (P<0.05; n = 6 embryos each WT and MZspg; Standard MATLAB boxplots). (D) Quantification of the total absolute number of intercalations for WT and MZspg embryos (P<0.05; summed over n = 6 embryos each WT and MZspg). Error bars show 95% confidence intervals assuming Poisson noise.

References

    1. Babb S. G., Marrs J. A. (2004). E-cadherin regulates cell movements and tissue formation in early zebrafish embryos. Dev. Dyn. 230, 263–277 10.1002/dvdy.20057 - DOI - PubMed
    1. Kane D. A., McFarland K. N., Warga R. M. (2005). Mutations in half baked/E-cadherin block cell behaviors that are necessary for teleost epiboly. Development 132, 1105–1116 10.1242/dev.01668 - DOI - PubMed
    1. Keller R. E. (1980). The cellular basis of epiboly: an SEM study of deep-cell rearrangement during gastrulation in Xenopus laevis. J. Embryol. Exp. Morphol. 60, 201–234. - PubMed
    1. Keller R. (2005). Cell migration during gastrulation. Curr. Opin. Cell Biol. 17, 533–541 10.1016/j.ceb.2005.08.006 - DOI - PubMed
    1. Keller R., Davidson L. A., Shook D. R. (2003). How we are shaped: the biomechanics of gastrulation. Differentiation 71, 171–205 10.1046/j.1432-0436.2003.710301.x - DOI - PubMed

LinkOut - more resources