School Age Effects of the Newborn Individualized Developmental Care and Assessment Program for Medically Low-Risk Preterm Infants: Preliminary Findings
- PMID: 23951557
- PMCID: PMC3742017
- DOI: 10.4103/2249-4847.105982
School Age Effects of the Newborn Individualized Developmental Care and Assessment Program for Medically Low-Risk Preterm Infants: Preliminary Findings
Abstract
Background: By school age, even low risk moderately preterm-born children show more neuro-cognitive deficits, underachievement, behavioral problems, and poor social adaptation than full-term peers.
Aim: To evaluate the outcomes at school-age for moderately preterm-born children (29-33 weeks gestational age), appropriate in growth for gestational age (AGA) and medically at low-risk, randomized to Newborn Individualized Developmental Care and Assessment Program (NIDCAP) or standard care in the Newborn Intensive Care Unit. At school-age, the experimental (E) group will show better neuropsychological and neuro-electrophysiological function, as well as improved brain structure than the control (C) group.
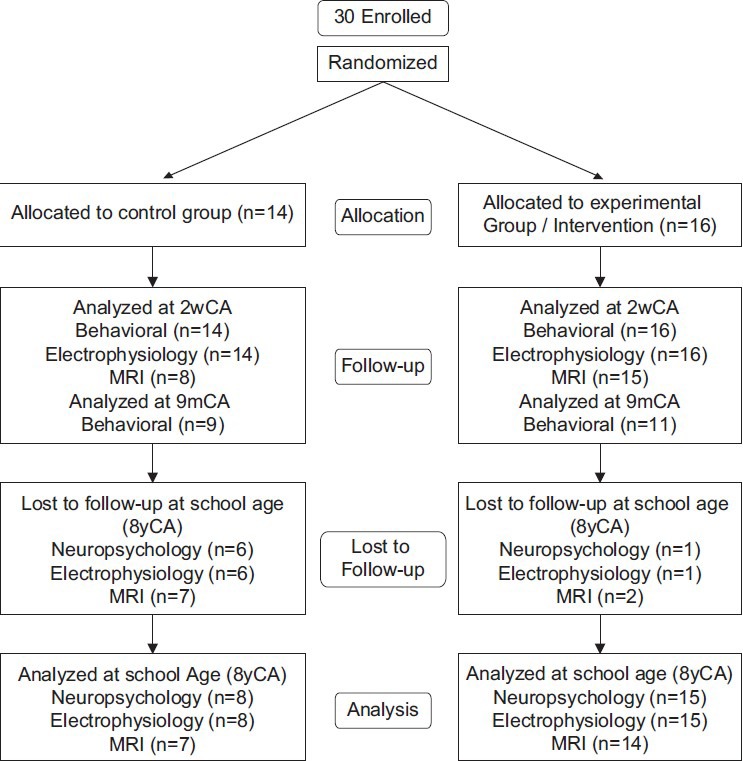
Materials and methods: The original sample consisted of 30 moderately preterm-born infants (29 to 33 weeks), 23 (8C and 15E) of them were evaluated at 8 years of age, corrected-for-prematurity with neuropsychological, EEG spectral coherence, and diffusion tensor magnetic resonance imaging (DT MRI) measures.
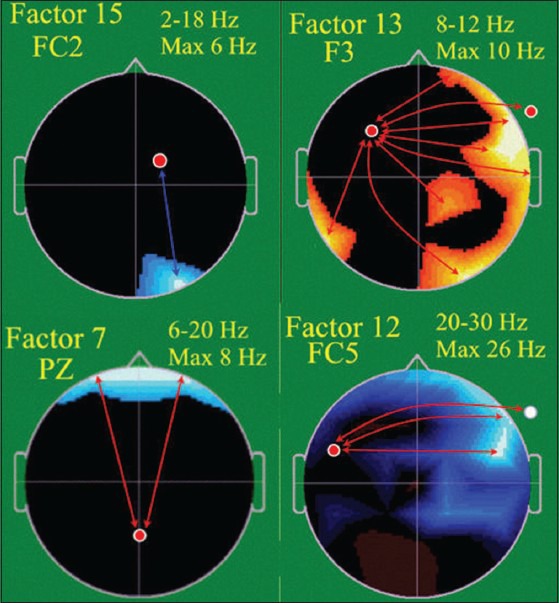
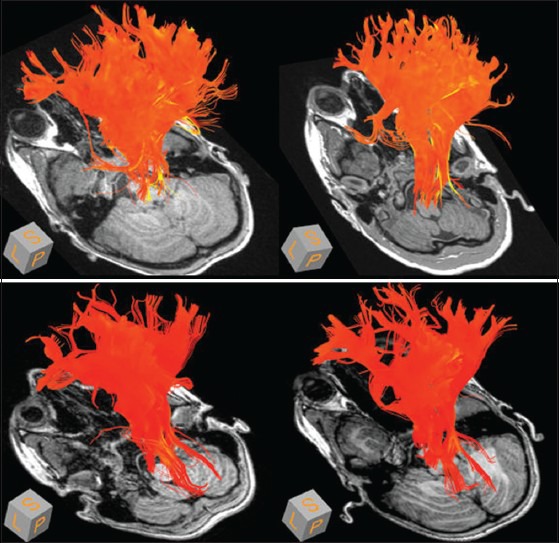
Results: E-performed significantly better than C-group children on the Kaufman Assessment Battery for Children-Second Edition (KABC-II) and trended towards better scores on the Rey-Osterrieth Complex Figure Test. They also showed more mature frontal and parietal brain connectivities, and more mature fiber tracts involving the internal capsule and the cingulum. Neurobehavioral results in the newborn period successfully predicted neuropsychological functioning at 8 years corrected age.
Conclusion: Moderately preterm infants cared for with the NIDCAP intervention showed improved neuropsychological and neuro-electrophysiological function as well as improved brain structure at school-age.
Keywords: Diffusion tensor magnetic resonance imaging; electroencephalogram; neuropsychological function; newborn individualized developmental care and assessment program; prematurity; school-age; spectral coherence.
Conflict of interest statement
Figures

References
-
- Taylor H, Klein N, Drotar D, Schluchter M, Hack M. Consequences and Risks of <1000-g Birth Weight for Neuropsychological Skills, Achievement, and Adaptive Functioning. J Dev Behav Pediatr. 2006:459–70. - PubMed
-
- Aarnoudse-Moens C, Duivenvoorden H, Weisglas-Kuperus N, Van Goudoever J, Oosterlaan J. The profile of executive function in very preterm children at 4 to 12 years. Dev Med Child Neurol. 2012;54:247–53. - PubMed
-
- Washington: DC; 2005. U.S. Department of Health and Human Services Center for Disease Control. National Vital Statistics Reports: Births: Final Data for 2004.
-
- Duffy FH, Als H, McAnulty GB. Infant EEG spectral coherence data during quiet sleep: Unrestricted Principal Components Analysis-Relation of factors to gestational age, medical risk, and neurobehavioral status. Clin Electroencephalogr. 2003;34:54–69. - PubMed
-
- Constable RT, Ment LR, Vohr B, Kesler SR, Fulbright RK, Lacadie C, et al. Prematurely born children demonstrate white matter miscrostructural differences at 12 years of age, relative to term control subjects: An investigation of group and gender effects. Pediatrics. 2008;121:306–16. - PubMed
Grants and funding
LinkOut - more resources
Full Text Sources
Miscellaneous