. 2013 Aug 15;154(4):888-903.
doi: 10.1016/j.cell.2013.07.020.

Developmental fate and cellular maturity encoded in human regulatory DNA landscapes

Affiliations

Developmental fate and cellular maturity encoded in human regulatory DNA landscapes

Andrew B Stergachis et al. Cell. .

Abstract

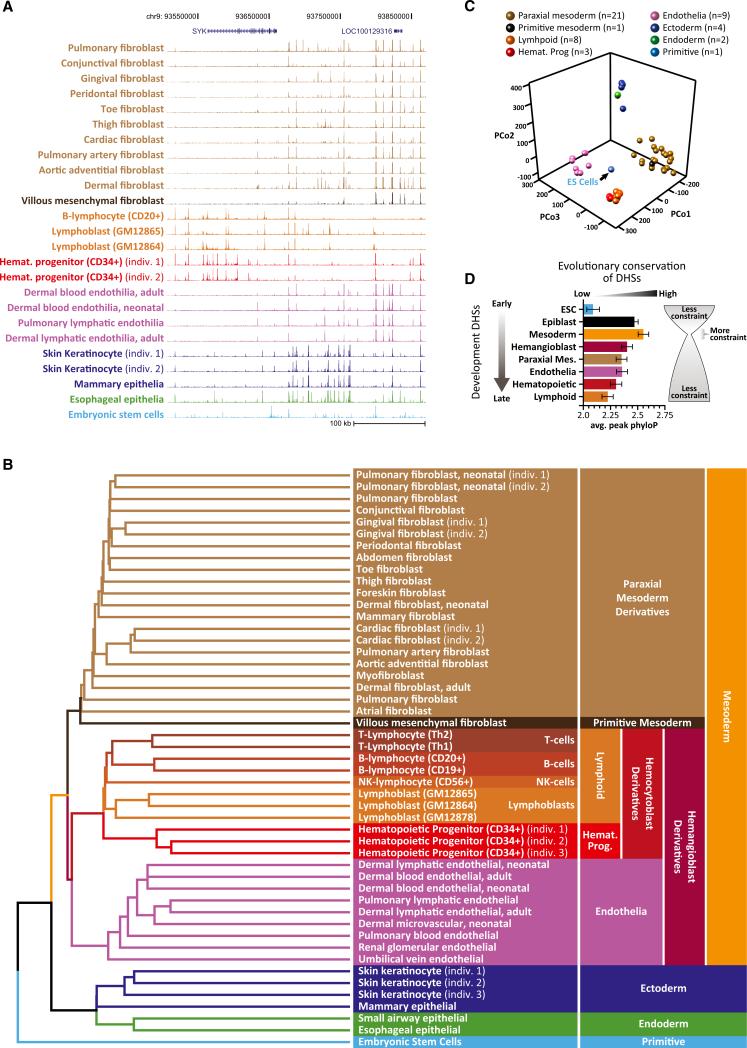
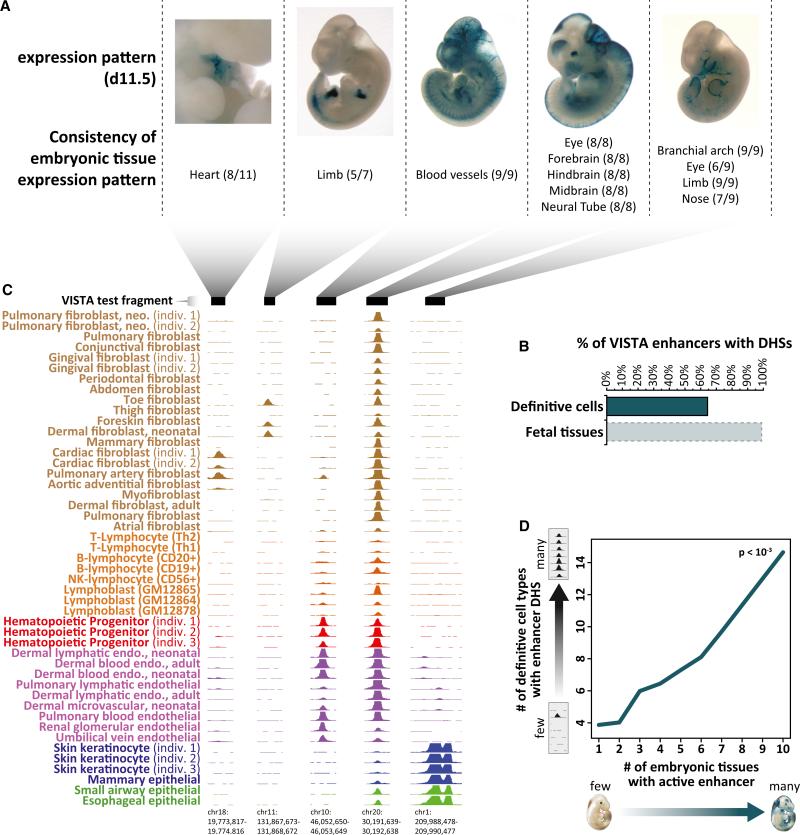
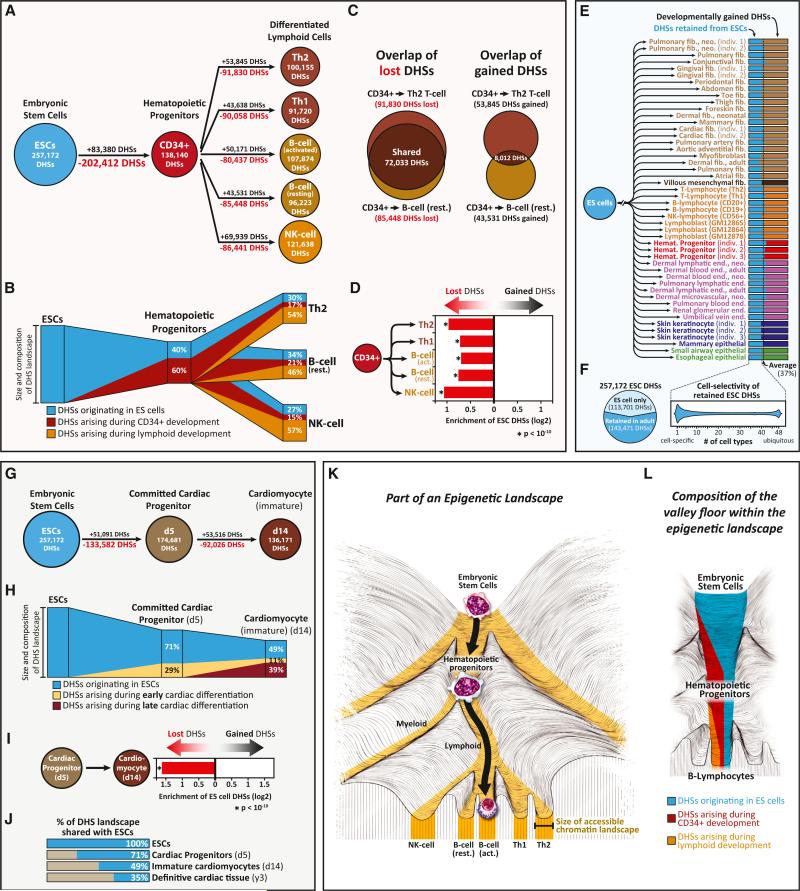
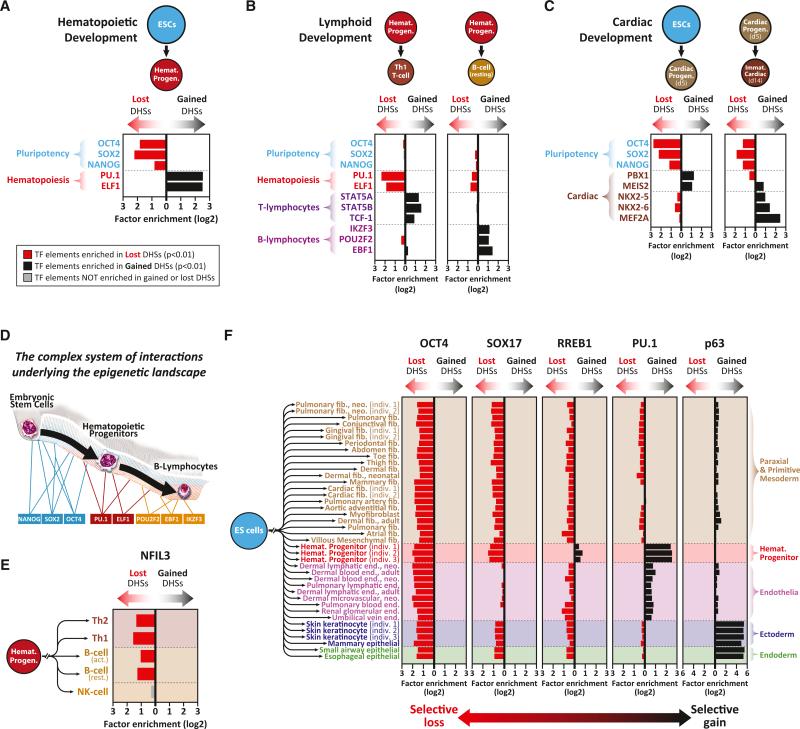
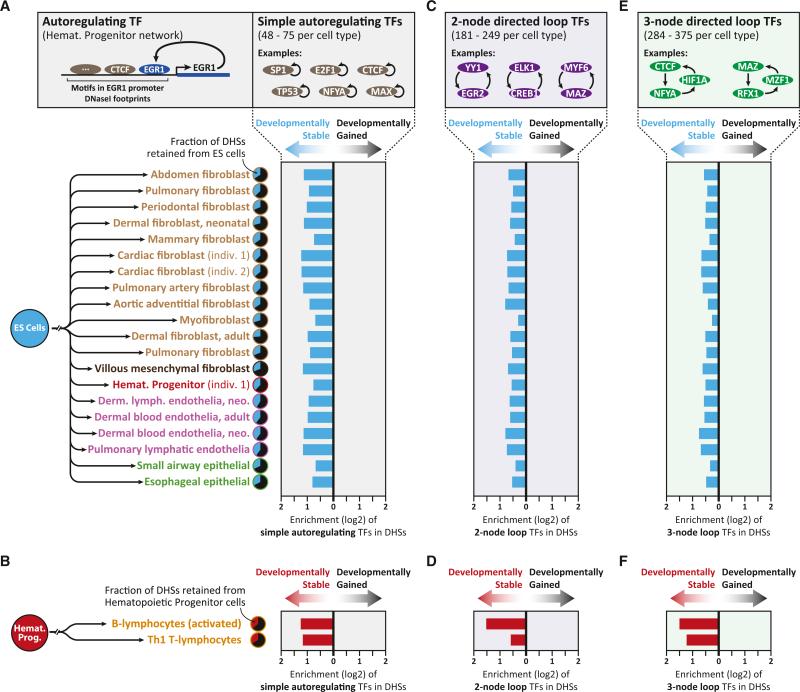
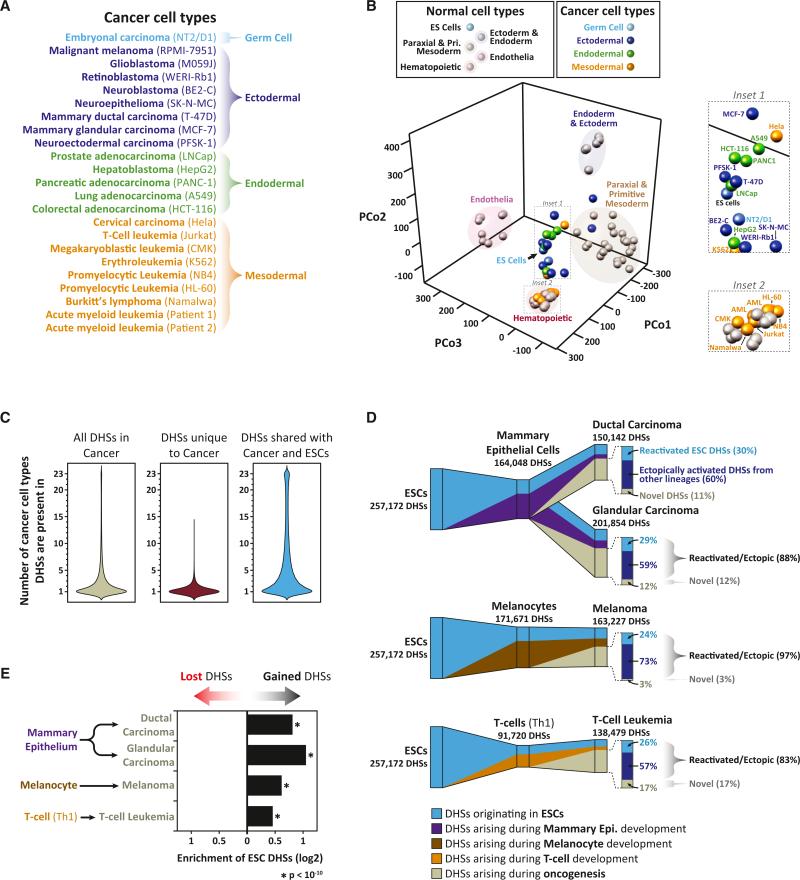
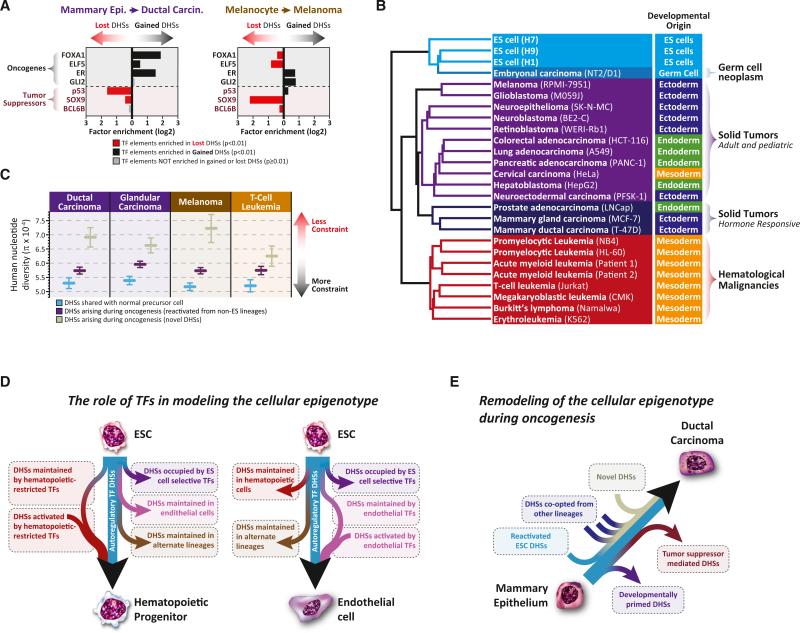
Cellular-state information between generations of developing cells may be propagated via regulatory regions. We report consistent patterns of gain and loss of DNase I-hypersensitive sites (DHSs) as cells progress from embryonic stem cells (ESCs) to terminal fates. DHS patterns alone convey rich information about cell fate and lineage relationships distinct from information conveyed by gene expression. Developing cells share a proportion of their DHS landscapes with ESCs; that proportion decreases continuously in each cell type as differentiation progresses, providing a quantitative benchmark of developmental maturity. Developmentally stable DHSs densely encode binding sites for transcription factors involved in autoregulatory feedback circuits. In contrast to normal cells, cancer cells extensively reactivate silenced ESC DHSs and those from developmental programs external to the cell lineage from which the malignancy derives. Our results point to changes in regulatory DNA landscapes as quantitative indicators of cell-fate transitions, lineage relationships, and dysfunction.


Figures

Figure 1
Figure 1. Lineage Programming of Human Regulatory DNA
(A) Evidence of lineage patterning in primary DHS data. DNase I cleavage-density profiles for 24 exemplary primary human cell types and ESCs across an ~350 kb region along chromosome 9. Cell types are colored according to their embryological derivation as indicated in (B). (B) Clustering DHS profiles recovers precise embryological relationships. Unbiased clustering of the linear patterning of DHSs from 48 diverse, definitive cell types plus ESCs. Branches and cell types are colored according to their embryological origin, with embryological ancestors common to multiple cell types indicated on the right. Note the rooting of the tree by ESCs and the partitioning of major branches corresponding to the trilaminar embryo. Note also the demarcation of early fate decisions such as partitioning of hemangioblast derivatives into endothelia and blood. (C) PCoA of cell-type relationships. Shown is each cell type from (B) projected into a three-dimensional principal coordinates space. Cell-type coloring is indicated above. Note the centrality of ESCs and the spatial separation of major lineage groups. (D) “Hourglass” pattern of regulatory DNA conservation across the developmental spectrum. Shown is the mean evolutionary conservation (phyloP, x axis) of DHSs common to the indicated lineage branches. Error bars represent 95% confidence intervals. See also Figure S1 and S3 and Tables S1 and S2.
Figure 2
Figure 2. Developmental Persistence of Chromatin Accessibility at Primitive Enhancers
(A) Mouse day 11.5 embryonic tissue activity (blue lacZ staining) of five representative transgenic human enhancer elements from the VISTA database. Shown below each image are numbers of individual embryos with enhancer activity (staining) in the indicated anatomical structure. (B) Persistence of DNase I hypersensitivity at embryonic enhancers. The percentage of embryonic enhancers from the VISTA database marked with DHSs in one or more definitive cell types (top) or early human fetal tissues (~day 70–150) (bottom). (C) DNase I hypersensitivity at five enhancer elements corresponding to (A) across 47 definitive cell types from Figure 1. Note the relationship between the anatomical staining patterns in (A) and the cellular restriction (or lack thereof) of DNase I hypersensitivity. (D) Embryonic enhancer tissue spectrum parallels DHS spectrum in definitive cells. The number of embryonic tissues with an active enhancer by lacZ staining (x axis) is linearly proportional (linear regression p value < 10–3) to the number of definitive cell types showing DNase I hypersensitivity at the same enhancer (y axis). See also Figure S2.
Figure 3
Figure 3. Developmental Extinction, Maintenance, and De Novo Activation of Chromatin Accessibility at Regulatory DNA
(A and B) Composition of developing hematopoietic regulatory landscapes. (A) Shown are acquired (black) versus extinguished (red) DHSs during hematopoietic developmental transitions. (B) Schematic illustrating the number of inherited versus acquired DHSs during hematopoietic developmental transitions. The lymphoid DHS compartment colored blue comprises a strict subset of the hematopoietic progenitor DHS compartment colored in blue. (C and D) Preferential extinction of common early developmental DHSs during development. (C) Comparison of DHSs lost (left) or acquired (right) during the differentiation of hematopoietic progenitors. (D) Shown is the enrichment of ESC DHSs within lost versus gained DHS compartments. p values were calculated using the hypergeometric test. (E and F) Formulaic composition of terminal regulatory DNA landscapes. (E) Shown is the proportion of the DHS landscape from each definitive cell type that is shared with ESCs. This proportion remains nearly constant at ~37%. (F) Approximately 60% of the ESC DHS landscape persists in varying combinations in definitive cell types (left), and each definitive cell type appears to retain a different cohort of ESC DHSs (right). (G–J) Regulatory DNA landscape of cardiac differentiation. (G) Acquired (black) versus extinguished (red) DHSs during cardiac differentiation. (H) Schematic illustrating the number of inherited versus gained DHSs during cardiac differentiation. (I) Enrichment of ESC DHSs within lost versus gained DHS compartments. p value was calculated using the hypergeometric test. (J) Clock-like extinction of ESC DHSs during cardiac differentiation. (K and L) The epigenetic landscape valley floor. (K) Differentiation is accompanied by the progressive restriction of the size of the accessible regulatory DNA landscape (e.g., a narrowing of the epigenetic landscape's valley floors) (gold). (L) Schematic showing restriction, perpetuation, and de novo activation that accompanies differentiation. See also Figure S3.
Figure 4
Figure 4. Selective Loss versus Gain of DHSs Targeted by Lineage Regulators
(A–C) Enrichment of lineage regulators in developmentally dynamic DHSs. Enrichment of binding elements for three pluripotency TFs (blue), eight hematopoietic lineage and sublineage TFs (red/purple), and five cardiac lineage TFs (brown) in DHSs lost versus gained during (A) the differentiation of ESCs into hematopoietic progenitors, (B) the differentiation of hematopoietic progenitors into Th1 T cells or B cells, and (C) the differentiation of ESCs into cardiac progenitors and immature cardiomyocytes. p values were calculated using the hypergeometric test. (D) The “guy-ropes” modeling the epigenetic landscape. Sequential activation of transcriptional regulators underpins the topology and trajectory of the epigenetic landscape—paralleling Waddington's regulatory genes and “guy-ropes” (Waddington, 1957). (E and F) Lineage-restricted TFs enable the selective retention of regulatory DNA. (E) DHSs containing binding elements for the NK cell master regulator NFIL3 are selectively retained by NK cells and lost in all other lineages. (F) Shown is enrichment of binding elements for five lineage regulators in the DHSs gained versus lost during lineage differentiation from ESCs. See also Figure S4.
Figure 5
Figure 5. Epigenetically Stable DHSs Are Potentiated by TFs that Regulate Their Own Expression
(A) Enrichment of DNase I-footprinted binding elements for simple autoregulating TFs in developmentally stable (i.e., retained from ESCs) versus developmentally gained DHSs in 20 cell types with annotated regulatory networks (Neph et al., 2012b). (B) Enrichment of DNase I-footprinted binding elements for simple autoregulating TFs in developmentally stable DHSs retained from hematopoietic progenitors, excluding sites retained from ESCs. (C–F) Enrichment of DNase I-footprinted binding elements for TFs involved in two-node (C and D) or three-node (E and F) autoregulatory loops in developmentally stable versus developmentally gained DHSs. All enrichments shown are significant (p < 10–10, hypergeometric distribution). See also Figure S5.
Figure 6
Figure 6. Retrograde Remodeling of the Regulatory DNA Landscape during Oncogenesis
(A) Developmental origins of 21 cancer cell lines and 2 primary cancers analyzed with genome-wide DNase I mapping. (B) PCoA of normal versus malignant cell-type relationships. Shown are normal and cancer cell types projected into a three-dimensional principal coordinates space. Cell-type coloring is indicated above. Note the prominent clustering of cancer cell types around ESCs (inset 1). (C) Cell selectivity of cancer cell DHSs. Distribution of the number of cancer cell types in which (left) a DHS found in any cancer cell type is observed, (middle) a DHS that is unique to cancer cell types and not found in any of the normal cell types is observed, and (right) a DHS shared between a cancer cell type and ESCs is observed. (D) Disordered retrograde remodeling of the accessible regulatory DNA landscape during oncogenesis. (D) Shown is the contribution of DHSs found in nonmalignant predecessors to the DHS landscape of each of four cancer cell types. Cancer DHS landscapes are partitioned into DHSs originating in ESCs and maintained in nonmalignant predecessors (blue), DHSs retained from nonmalignant predecessors but not present in ESCs (purple/brown/orange), and DHSs arising during oncogenesis (gray). (Right) Proportion of DHSs arising during oncogenesis that are reactivated (i.e., not inherited) ESC DHSs (light blue), ectopically activated DHSs from alternative lineages (dark blue), or novel DHSs unique to each cancer cell type (gray). (E) Shown is the enrichmentof ESC DHSs within lost versus gained DHS compartments duringoncogenesis. p values were calculated using the hypergeometric test. See also Figure S6 and Table S3.
Figure 7
Figure 7. TF Drivers, Functional Organization, and Evolutionary Pressures on Cancer Regulatory Landscapes
(A) Oncogenic versus tumor-suppressor TF targets in DHSs gained versus lost during oncogenesis. Shown is the enrichment of binding elements for four TF oncogenes and three TF tumor suppressors in the DHSs lost versus gained during the oncogenic transformation of mammary epithelium and melanocytes. (B) Functional reorientation of the malignant regulatory DNA landscape. Clustering of DHSs from 23 cancer cell types and three different ES lines. Note the predominance of functional or phenotypic features over embryological origins. (C) DHSs arising during oncogenesis show relaxed evolutionary constraint. Human nucleotide diversity measurements (π, y axis) at DHSs retained from nonmalignant predecessors but not present in ESCs (blue); DHSs arising during oncogenesis that are ectopically activated from alternative lineages, excluding ESCs (purple); and DHSs arising during oncogenesis that are novel to cancer (gray). Error bars represent 95% confidence intervals. (D and E) Models of normal development and oncogenesis. Shown are the actions of different TF classes on the developing regulatory DNA landscape of hematopoietic progenitors and endothelial cells (D) as well as the oncogenic transformation of mammary epithelium (E). See also Figure S7.

References

    1. Akhtar-Zaidi B, Cowper-Sal-lari R, Corradin O, Saiakhova A, Bartels CF, Balasubramanian D, Myeroff L, Lutterbaugh J, Jarrar A, Kalady MF, et al. Epigenomic enhancer profiling defines a signature of colon cancer. Science. 2012;336:736–739. - PMC - PubMed
    1. Alon U. An Introduction to Systems Biology: Design Principles of Biological Circuits. First Edition Chapman and Hall/CRC; London: 2006.
    1. Bard J, Rhee SY, Ashburner M. An ontology for cell types. Genome Biol. 2005;6:R21. - PMC - PubMed
    1. Beard J. Embryological aspects and etiology of carcinoma. Lancet. 1902;159:1758–1761.
    1. Bernstein BE, Mikkelsen TS, Xie X, Kamal M, Huebert DJ, Cuff J, Fry B, Meissner A, Wernig M, Plath K, et al. A bivalent chromatin structure marks key developmental genes in embryonic stem cells. Cell. 2006;125:315–326. - PubMed

Publication types