. 2013 Aug 14;14(2):159-70.
doi: 10.1016/j.chom.2013.07.009.

PPARγ-mediated increase in glucose availability sustains chronic Brucella abortus infection in alternatively activated macrophages

Affiliations

PPARγ-mediated increase in glucose availability sustains chronic Brucella abortus infection in alternatively activated macrophages

Mariana N Xavier et al. Cell Host Microbe. .

Abstract

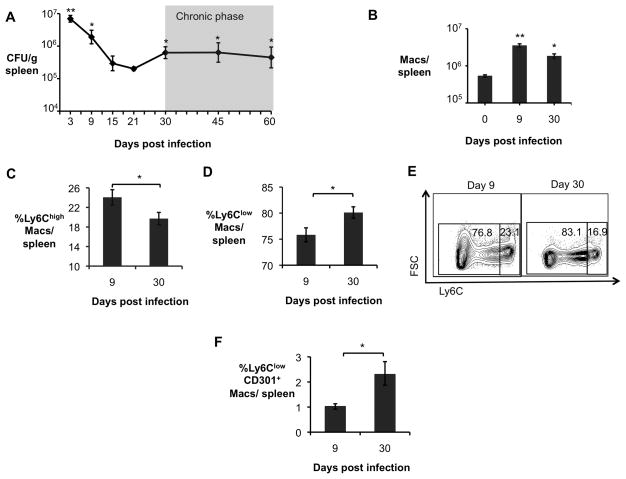
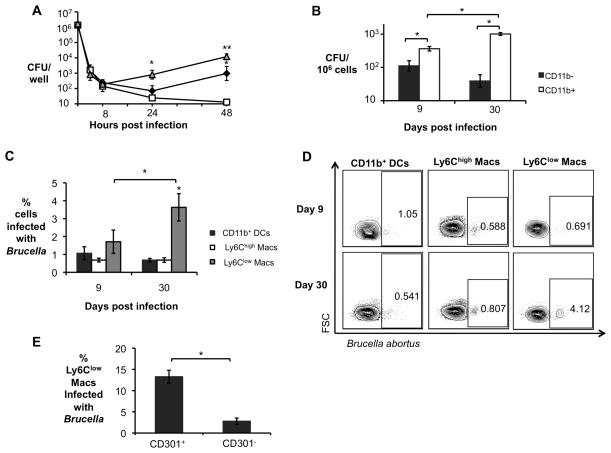
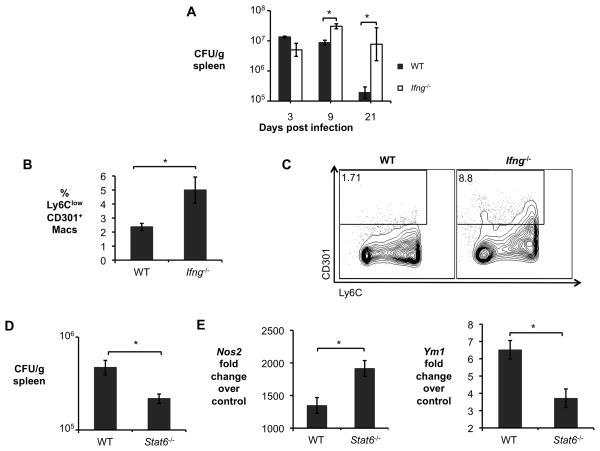
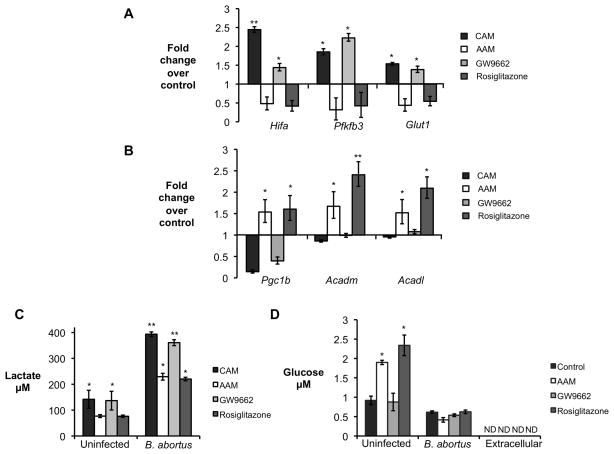
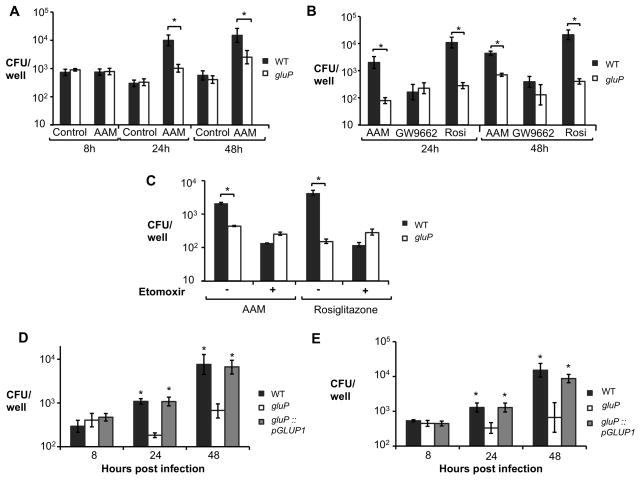
Eradication of persistent intracellular bacterial pathogens with antibiotic therapy is often slow or incomplete. However, strategies to augment antibiotics are hampered by our poor understanding of the nutritional environment that sustains chronic infection. Here we show that the intracellular pathogen Brucella abortus survives and replicates preferentially in alternatively activated macrophages (AAMs), which are more abundant during chronic infection. A metabolic shift induced by peroxisome proliferator-activated receptor γ (PPARγ), which increases intracellular glucose availability, is identified as a causal mechanism promoting enhanced bacterial survival in AAMs. Glucose uptake was crucial for increased replication of B. abortus in AAMs, and for chronic infection, as inactivation of the bacterial glucose transporter gluP reduced both intracellular survival in AAMs and persistence in mice. Thus, a shift in intracellular nutrient availability induced by PPARγ promotes chronic persistence of B. abortus within AAMs, and targeting this pathway may aid in eradicating chronic infection.


Figures

Figure 1
Figure 1. Alternatively activated macrophages are more abundant during chronic brucellosis
(A) B. abortus 2308 CFU counts in spleens from C57BL/6J mice (n=5) at 3, 9, 15, 21, 30, 45 and 60 days post infection (d.p.i). (B) Numbers of macrophages (CD3B220NK1.1Ly6GCD11b+F4/80+) determined by flow cytometry in spleens of B. abortus infected mice (n=4) at 0, 9 and 30 d.p.i. (C) Frequency of CD3B220NK1.1Ly6GCD11b+F4/80+Ly6Chigh macrophages (CAM) measured by flow cytometry in spleens of B. abortus infected mice (n=4) at 9 and 30 d.p.i.. (D) Frequency of CD3B220NK1.1Ly6GCD11b+F4/80+Ly6Clow macrophages determined by flow cytometry in spleens of B. abortus infected mice (n=4) at 9 and 30 d.p.i. (E) Representative data plot of Ly6Clow and Ly6Chigh populations in spleens of B. abortus infected mice at 9 and 30 d.p.i.. (F) Frequency of CD3B220NK1.1Ly6GCD11b+F4/80+Ly6ClowCD301+ macrophages (AAM) measured by flow cytometry in spleens of B. abortus infected mice (n=4) at 9 and 30 d.p.i.. Values represent mean ± SEM. (*) Represents P<0.05 and (**) represents P<0.01 using one way ANOVA for (A–B) or unpaired t-test analysis for (C–E). See also Fig. S1.
Figure 2
Figure 2. Increased B. abortus survival in AAM during chronic infection
(A) B. abortus survival over time in C57BL/6J BMDM that were not treated (black diamond), or stimulated with 10ng/mL of rIFNγ (CAM, open square) and stimulated with 10ng/mL of rIL-4 (AAM, grey triangle). Data shown are compiled from four independent experiments. (B) B. abortus 2308 CFU counts in CD11b and CD11b+ splenocytes from C57BL/6J mice (n=5) at 9 and 30 days post infection (d.p.i.). (C) Frequency of B. abortus infected CD11b+ dendritic cells (DCs, F4/80Ly6G CD11b+CD11c+), Ly6Chigh macrophages (CD11cLy6GCD11b+F4/80+Ly6Chigh) and Ly6Clow macrophages (CD11cLy6GCD11b+F4/80+Ly6Clow) determined by flow cytometry in CD11b+ splenocytes from infected C57BL/6J mice (n=5) at 9 and 30 d.p.i. (D) Representative data plot of populations shown in (C). (E) Frequency of B. abortus infected CD301+ (AAM) and CD301 Ly6Clow macrophages in CD11b+ splenocytes determined by flow cytometry in CD11b+ splenocytes from C57BL/6J infected mice (n=5) at 30 d.p.i. Values represent mean ± SEM. (*) Represents P<0.05 and (**) represents P<0.01 using one way ANOVA for (A) or unpaired t-test analysis for (B–C) and (E).
Figure 3
Figure 3. Defects in generation of CAM or AAM affect B. abortus survival in vivo
(A) B. abortus 2308 CFU counts in spleens from C57BL/6J and congenic Ifng−/− mice (n=5) at 3, 9, and 21, days post infection (d.p.i). (B) Frequency of CD3B220NK1.1Ly6GCD11b+F4/80+Ly6ClowCD301+ macrophages (AAM) measured by flow cytometry in spleens of B. abortus infected C57BL/6J and congenic Ifng−/− mice (n=5) at 9 d.p.i.. (C) Representative data plot of populations shown in (B). (D) B. abortus 2308 CFU counts in spleens of C57BL/6J and congenic Stat6−/− mice (n=5) at 30 d.p.i. (E) Real time RT-PCR gene expression analysis of CAM gene Nos2 and AAM gene Ym1 in CD11b+ splenocytes from B. abortus infected C57BL/6J and congenic Stat6−/− mice (n=5) at 30 d.p.i. Values represent mean ± SEM. (*) Represents P<0.05 using unpaired t-test statistical analysis. See also Fig. S2.
Figure 4
Figure 4. Increased survival of B. abortus during chronic infection is dependent on PPARγ
(A) Real time RT-PCR gene expression analysis of Pparg in CD11b+ splenocytes from B. abortus-infected C57BL/6J mice (n=5) at 3, 9, 30 and 60 dpi. (B) B. abortus 2308 CFU counts, measured at 30 d.p.i., in spleens from C57BL/6J mice (n=5) treated daily from 18 to 30 d.p.i. with PPARγ antagonist GW9662 or PBS control. (C) Frequency of CD3B220NK1.1Ly6GCD11b+F4/80+Ly6ClowCD301+ macrophages (AAM) measured by flow cytometry at 30 d.p.i. in spleens of C57BL/6J mice (n=5) treated daily from 18 to 30 d.p.i. with PPARγ antagonist GW9662 or PBS control. (D) B. abortus 2308 CFU counts, measured at 9 and 30 d.p.i., in spleens from C57BL/6J mice (n=5) treated daily for 7 days prior to infection with PPARγ agonist Rosiglitazone or PBS control. (E) Frequency of CD3B220NK1.1Ly6GCD11b+F4/80+Ly6ClowCD301+ macrophages (AAM) measured by flow cytometry at 9 and 30 d.p.i. in spleens from C57BL/6J mice (n=5) treated daily for 7 days prior to infection with PPARγ agonist Rosiglitazone or PBS control. (F) Real time RT-PCR gene expression analysis of Pparg in BMDM from C57BL/6J mice stimulated with rIFN-γ (CAM), rIL-4 (AAM), or non-stimulated (Control) and infected with B. abortus for 24h. Data shown are compiled from four independent experiments. (G) B. abortus 2308 CFU counts in BMDM from C57BL/6J mice, stimulated with rIL-4 (AAM) or with IL-4 + 3μM of PPARγ antagonist GW9662 (GW9662) or with 5μM of PPARγ agonist Rosiglitazone and infected with B. abortus for 24 and 48h. Data shown in (F) and (G) are compiled from four independent experiments. Values represent mean ± SEM. (*) Represents P<0.05 using one way ANOVA for (A) and (F) or unpaired t-test analysis for (B–E) and (G). See also Fig. S3.
Figure 5
Figure 5. B. abortus infected AAM exhibit a PPARγ-dependent decrease in glycolytic metabolism
(A) Real time RT-PCR gene expression analysis of glycolytic pathway genes Hifa (hypoxia inducible factor α), Pfkfb3 (phosphofructokinase-3) and Glut1 (glucose transporter 1) in C57BL/6J BMDM stimulated with rIFNγ (CAM), with rIL-4 (AAM), with IL-4 + GW9662 (GW9662) or with Rosiglitazone and infected with B. abortus for 8 hours. Results are expressed as fold change over untreated macrophages infected with B. abortus. (B) Real time RT-PCR gene expression analysis of fatty acid β-oxidation pathway genes Pgc1b (PPARγ coactivator 1 β), Acadm (medium-chain acyl-CoA dehydrogenase) and Acadl (long-chain acyl-CoA dehydrogenase) in BMDM from C57BL/6J stimulated rIFNγ (CAM), with rIL-4 (AAM), with IL-4 + GW9662 (GW9662) or with Rosiglitazone and infected with B. abortus for 8 hours. Results are expressed as fold change over untreated macrophages infected with B. abortus. (C) Measurement of lactate concentration in supernatant from BMDM from C57BL/6J stimulated with rIFNγ (CAM), with rIL-4 (AAM) or IL-4 + GW9662 (GW9662) or with Rosiglitazone and uninfected or infected with B. abortus for 24 hours. (D) Measurement of intracellular glucose concentration in BMDM from C57BL/6J unstimulated (control) and stimulated with rIL-4 (AAM), with IL-4 + GW9662 (GW9662), or with Rosiglitazone and uninfected or infected with B. abortus for 24 hours. Values represent mean ± SEM and represent combined results of four independent experiments conducted in duplicate. (*) Represents P<0.05 and (**) represents P<0.01 using one way ANOVA. See also Fig. S4.
Figure 6
Figure 6. A PPARγ-dependent increase in intracellular glucose availability promotes survival of B. abortus in macrophages
(A) Recovery of B. abortus from C57BL/6J BMDM that were sham-treated (Control) or treated with rIL-4 (AAM). BMDM were infected with B. abortus 2308 WT or isogenic gluP mutant for 8, 24 and 48h. (B) Recovery of B. abortus from C57BL/6J BMDM stimulated with rIL-4 (AAM), with IL-4 + GW9662 (GW9662) or with Rosiglitazone (Rosi) and infected with B. abortus 2308 (WT) or isogenic gluP mutant for 24 and 48h. (C) Recovery of B. abortus from BMDM from C57BL/6J treated or not with the β-oxidation inhibitor etomoxir (50 μM) in the presence of rIL-4 (AAM) or Rosiglitazone and infected with B. abortus 2308 WT or isogenic gluP mutant for 48h. (D) Recovery of B. abortus from BMDM from C57BL/6J stimulated rIL-4 (AAM) and infected with B. abortus 2308 WT or isogenic gluP mutant or complemented gluP mutant (gluP::pGLUP1) for 8, 24 and 48h. (E) Recovery of B. abortus from BMDM from C57BL/6J stimulated with Rosiglitazone and infected with B. abortus 2308 WT or isogenic gluP mutant or complemented gluP mutant (gluP::pGLUP1) for 8, 24 and 48h. Values represent mean ± SEM of data from four independent experiments conducted in duplicate. (*) Represents P<0.05 using unpaired t-test for (A–C) or one way ANOVA statistical analysis for (D–E). See also Fig S5.
Figure 7
Figure 7. A PPARγ-dependent increase in intracellular glucose availability in macrophages promotes B. abortus persistence in vivo
(A) Competitive index (ratio of WT to gluP mutant) in spleens of C57BL/6J mice (n=5) infected with a 1:1 mixture of B. abortus 2308 WT and isogenic gluP mutant for 9 and 30 days. (B) Competitive index, measured at 30 days post infection (d.p.i.), in spleens from C57BL/6J mice (n=5) treated daily from 18 to 30 d.p.i. with PPARγ antagonist GW9662 or PBS control and infected with a 1:1 mixture of B. abortus 2308 WT and isogenic gluP mutant. (C) Competitive index, measured at 9 and 30 d.p.i., in spleens from C57BL/6J mice (n=5) treated daily for 7 days prior to infection with PPARγ agonist Rosiglitazone or PBS control and infected with a 1:1 mixture of B. abortus 2308 WT and isogenic gluP mutant. (D) Competitive index, measured at 9 and 30 d.p.i., in spleens from Ppargfl/flLysMcre/ (Mac-PPARγ KO) or littermates Ppargfl/flLysM−/− (Control) mice (n=5) infected with a 1:1 mixture of B. abortus 2308 WT and isogenic gluP mutant. Values represent mean ± SEM. (*) Represents P<0.05 using unpaired t-test statistical analysis.

Comment in

References

    1. Abdullah Z, Geiger S, Nino-Castro A, Böttcher JP, Muraliv E, Gaidt M, Schildberg FA, Riethausen K, Flossdorf J, Krebs W, et al. Lack of PPARg in Myeloid Cells Confers Resistance to Listeria monocytogenes Infection. PLoS ONE. 2012;7:e37349. - PMC - PubMed
    1. Al Dahouk S, Jubier-Maurin V, Scholz HC, Tomaso H, Karges W, Neubauer H, Kohler S. Quantitative analysis of the intramacrophagic Brucella suis proteome reveals metabolic adaptation to late stage of cellular infection. Proteomics. 2008;8:3862–3870. - PubMed
    1. Alton GG, Jones LM, Pietz DE. Laboratory Techniques in Brucellosis. 2. Geneva: World Health Organization; 1975. - PubMed
    1. Barbier T, Nicolas C, Letesson JJ. Brucella adaptation and survival at the crossroad of metabolism and virulence. FEBS letters. 2011;585:2929–2934. - PubMed
    1. Bensinger SJ, Tontonoz P. Integration of metabolism and inflammation by lipid-activated nuclear receptors. Nature. 2008;454:470–477. - PubMed

Publication types